Global Solar Panel Market
- An Outline of the Global Solar Panel Market
- Market Definition and Segmentation
- Study Assumptions and Abbreviations
- Research Methodology & Approach
- Primary Research
- Secondary Research
- Data Triangulation
- SPSS Methodology
- Executive Summary
- Growth Drivers
- Major Roadblocks
- Opportunities
- Prevalent Trends
- Government Regulation
- Growth Outlook
- Competitive White Space Analysis – Identifying Untapped Market Gaps
- Risk Overview
- SWOT
- Technological Advancement
- Technology Maturity Matrix for Solar Panel
- Recent News
- Regional Demand
- Solar Panel Market by Geography – Strategic Comparative Analysis
- Strategic Segment Analysis: Solar Panel Demand Landscape
- Solar Panel Demand Trends Driven by Electrification, Downsizing, and Lightweighting (2026-2036)
- Root Cause Analysis (RCA) for discovering problems of the Solar Panel Market
- Porter Five Forces
- PESTLE
- Comparative Positioning
- Global Solar Panel Market – Key Player Analysis (2024)
- Competitive Landscape: Key Suppliers/Players
- Competitive Model: A Detailed Inside View for Investors
- Company Market Share, 2024 (%)
- Business Profile of Key Enterprise
- JinkoSolar Holding Co., Ltd.
- JA Solar Technology Co., Ltd.
- LONGi Green Energy Technology Co., Ltd.
- Canadian Solar Inc.
- Trina Solar Co., Ltd.
- DMEGC Solar Energy Co., Ltd.
- Astronergy (CHINT Solar)
- Boviet Solar
- Risen Energy Co., Ltd.
- Qcells (Hanwha Qcells)
- Adani Solar
- TCL Solar
- Tongwei Co., Ltd.
- Business Profile of Key Enterprise
- Market Revenue by Value (USD Million), Volume (Thousand Tons), and Compound Annual Growth Rate (CAGR)
- Solar Panel Market Segmentation Analysis (2026-2036)
- By Technology
- Monocrystalline Silicon (Mono-Si), Market Value (USD Million), and CAGR, 2026-2036F
- Polycrystalline Silicon (Poly-Si), Market Value (USD Million), and CAGR, 2026-2036F
- Thin-Film, Market Value (USD Million), and CAGR, 2026-2036F
- Others, Market Value (USD Million), and CAGR, 2026-2036F
- By Deployment
- Ground-mounted, Market Value (USD Million), and CAGR, 2026-2036F
- Rooftop, Market Value (USD Million), and CAGR, 2026-2036F
- By Connection Type
- In-grid, Market Value (USD Million), and CAGR, 2026-2036F
- Off-grid, Market Value (USD Million), and CAGR, 2026-2036F
- By Application
- Residential, Market Value (USD Million), and CAGR, 2026-2036F
- Commerce & Industrial (C&I), Market Value (USD Million), and CAGR, 2026-2036F
- Regional Synopsis, Value (USD Million), 2026-2036
- North America Market Value (USD Million) and CAGR & Y-o-Y Growth Trend, 2026-2036F
- Europe Market Value (USD Million) and CAGR & Y-o-Y Growth Trend, 2026-2036F
- Asia Pacific Market Value (USD Million) and CAGR & Y-o-Y Growth Trend, 2026-2036F
- Latin America Market Value (USD Million) and CAGR & Y-o-Y Growth Trend, 2026-2036F
- Middle East and Africa Market Value (USD Million) and CAGR & Y-o-Y Growth Trend, 2026-2036F
- By Technology
- Solar Panel Market Segmentation Analysis (2026-2036)
- North America Market
- Overview
- Market Value (USD Million), Current and Future Projections, 2026-2036
- Increment $ Opportunity Assessment, 2026-2036
- Segmentation (USD million), 2026-2036,
- By Technology
- Monocrystalline Silicon (Mono-Si), Market Value (USD Million), and CAGR, 2026-2036F
- Polycrystalline Silicon (Poly-Si), Market Value (USD Million), and CAGR, 2026-2036F
- Thin-Film, Market Value (USD Million), and CAGR, 2026-2036F
- Others, Market Value (USD Million), and CAGR, 2026-2036F
- By Deployment
- Ground-mounted, Market Value (USD Million), and CAGR, 2026-2036F
- Rooftop, Market Value (USD Million), and CAGR, 2026-2036F
- By Connection Type
- In-grid, Market Value (USD Million), and CAGR, 2026-2036F
- Off-grid, Market Value (USD Million), and CAGR, 2026-2036F
- By Application
- Residential, Market Value (USD Million), and CAGR, 2026-2036F
- Commerce & Industrial (C&I), Market Value (USD Million), and CAGR, 2026-2036F
- Country Level Analysis, Value (USD Million)
- U.S. Market Value (USD Million) and CAGR & Y-o-Y Growth Trend, 2026-2036F
- Canada Market Value (USD Million) and CAGR & Y-o-Y Growth Trend, 2026-2036F
- By Technology
- Overview
- Europe Market
- Overview
- Market Value (USD Million), Current and Future Projections, 2026-2036
- Increment $ Opportunity Assessment, 2026-2036
- Segmentation (USD million), 2026-2036,
- By Technology
- Monocrystalline Silicon (Mono-Si), Market Value (USD Million), and CAGR, 2026-2036F
- Polycrystalline Silicon (Poly-Si), Market Value (USD Million), and CAGR, 2026-2036F
- Thin-Film, Market Value (USD Million), and CAGR, 2026-2036F
- Others, Market Value (USD Million), and CAGR, 2026-2036F
- By Deployment
- Ground-mounted, Market Value (USD Million), and CAGR, 2026-2036F
- Rooftop, Market Value (USD Million), and CAGR, 2026-2036F
- By Connection Type
- In-grid, Market Value (USD Million), and CAGR, 2026-2036F
- Off-grid, Market Value (USD Million), and CAGR, 2026-2036F
- By Application
- Residential, Market Value (USD Million), and CAGR, 2026-2036F
- Commerce & Industrial (C&I), Market Value (USD Million), and CAGR, 2026-2036F
- Country Level Analysis, Value (USD Million)
- UK Market Value (USD Million) and CAGR & Y-o-Y Growth Trend, 2026-2036F
- Germany Market Value (USD Million) and CAGR & Y-o-Y Growth Trend, 2026-2036F
- France Market Value (USD Million) and CAGR & Y-o-Y Growth Trend, 2026-2036F
- Italy Market Value (USD Million) and CAGR & Y-o-Y Growth Trend, 2026-2036F
- Spain Market Value (USD Million) and CAGR & Y-o-Y Growth Trend, 2026-2036F
- Netherlands Market Value (USD Million) and CAGR & Y-o-Y Growth Trend, 2026-2036F
- Russia Market Value (USD Million) and CAGR & Y-o-Y Growth Trend, 2026-2036F
- Switzerland Market Value (USD Million) and CAGR & Y-o-Y Growth Trend, 2026-2036F
- Poland Market Value (USD Million) and CAGR & Y-o-Y Growth Trend, 2026-2036F
- Belgium Market Value (USD Million) and CAGR & Y-o-Y Growth Trend, 2026-2036F
- Rest of Europe Market Value (USD Million) and CAGR & Y-o-Y Growth Trend, 2026-2036F
- By Technology
- Overview
- Asia Pacific Market
- Overview
- Market Value (USD Million), Current and Future Projections, 2026-2036
- Increment $ Opportunity Assessment, 2026-2036
- Segmentation (USD million), 2026-2036,
- By Technology
- Monocrystalline Silicon (Mono-Si), Market Value (USD Million), and CAGR, 2026-2036F
- Polycrystalline Silicon (Poly-Si), Market Value (USD Million), and CAGR, 2026-2036F
- Thin-Film, Market Value (USD Million), and CAGR, 2026-2036F
- Others, Market Value (USD Million), and CAGR, 2026-2036F
- By Deployment
- Ground-mounted, Market Value (USD Million), and CAGR, 2026-2036F
- Rooftop, Market Value (USD Million), and CAGR, 2026-2036F
- By Connection Type
- In-grid, Market Value (USD Million), and CAGR, 2026-2036F
- Off-grid, Market Value (USD Million), and CAGR, 2026-2036F
- By Application
- Residential, Market Value (USD Million), and CAGR, 2026-2036F
- Commerce & Industrial (C&I), Market Value (USD Million), and CAGR, 2026-2036F
- Country Level Analysis, Value (USD Million)
- China Market Value (USD Million) and CAGR & Y-o-Y Growth Trend, 2026-2036F
- India Market Value (USD Million) and CAGR & Y-o-Y Growth Trend, 2026-2036F
- South Korea Market Value (USD Million) and CAGR & Y-o-Y Growth Trend, 2026-2036F
- Australia Market Value (USD Million) and CAGR & Y-o-Y Growth Trend, 2026-2036F
- Indonesia Market Value (USD Million) and CAGR & Y-o-Y Growth Trend, 2026-2036F
- Malaysia Market Value (USD Million) and CAGR & Y-o-Y Growth Trend, 2026-2036F
- Vietnam Market Value (USD Million) and CAGR & Y-o-Y Growth Trend, 2026-2036F
- Thailand Market Value (USD Million) and CAGR & Y-o-Y Growth Trend, 2026-2036F
- Singapore Market Value (USD Million) and CAGR & Y-o-Y Growth Trend, 2026-2036F
- New Zeeland Market Value (USD Million) and CAGR & Y-o-Y Growth Trend, 2026-2036F
- Rest of Asia Pacific Excluding Japan Market Value (USD Million) and CAGR & Y-o-Y Growth Trend, 2026-2036F
- By Technology
- Overview
- Latin America Market
- Overview
- Market Value (USD Million), Current and Future Projections, 2026-2036
- Increment $ Opportunity Assessment, 2026-2036
- Year-on-Year Growth Forecast (%)
- Segmentation (USD million), 2026-2036, By
- By Technology
- Monocrystalline Silicon (Mono-Si), Market Value (USD Million), and CAGR, 2026-2036F
- Polycrystalline Silicon (Poly-Si), Market Value (USD Million), and CAGR, 2026-2036F
- Thin-Film, Market Value (USD Million), and CAGR, 2026-2036F
- Others, Market Value (USD Million), and CAGR, 2026-2036F
- By Deployment
- Ground-mounted, Market Value (USD Million), and CAGR, 2026-2036F
- Rooftop, Market Value (USD Million), and CAGR, 2026-2036F
- By Connection Type
- In-grid, Market Value (USD Million), and CAGR, 2026-2036F
- Off-grid, Market Value (USD Million), and CAGR, 2026-2036F
- By Application
- Residential, Market Value (USD Million), and CAGR, 2026-2036F
- Commerce & Industrial (C&I), Market Value (USD Million), and CAGR, 2026-2036F
- Country Level Analysis, Value (USD Million)
- Brazil Market Value (USD Million) and CAGR & Y-o-Y Growth Trend, 2026-2036F
- Argentina Market Value (USD Million) and CAGR & Y-o-Y Growth Trend, 2026-2036F
- Mexico Market Value (USD Million) and CAGR & Y-o-Y Growth Trend, 2026-2036F
- Rest of Latin America Market Value (USD Million) and CAGR & Y-o-Y Growth Trend, 2026-2036F
- By Technology
- Overview
- Middle East & Africa Market
- Overview
- Market Value (USD Million), Current and Future Projections, 2026-2036
- Increment $ Opportunity Assessment, 2026-2036
- Year-on-Year Growth Forecast (%)
- Segmentation (USD million), 2026-2036, By
- By Technology
- Monocrystalline Silicon (Mono-Si), Market Value (USD Million), and CAGR, 2026-2036F
- Polycrystalline Silicon (Poly-Si), Market Value (USD Million), and CAGR, 2026-2036F
- Thin-Film, Market Value (USD Million), and CAGR, 2026-2036F
- Others, Market Value (USD Million), and CAGR, 2026-2036F
- By Deployment
- Ground-mounted, Market Value (USD Million), and CAGR, 2026-2036F
- Rooftop, Market Value (USD Million), and CAGR, 2026-2036F
- By Connection Type
- In-grid, Market Value (USD Million), and CAGR, 2026-2036F
- Off-grid, Market Value (USD Million), and CAGR, 2026-2036F
- By Application
- Residential, Market Value (USD Million), and CAGR, 2026-2036F
- Commerce & Industrial (C&I), Market Value (USD Million), and CAGR, 2026-2036F
- Country Level Analysis, Value (USD Million)
- Saudi Arabia Market Value (USD Million) and CAGR & Y-o-Y Growth Trend, 2026-2036F
- UAE Market Value (USD Million) and CAGR & Y-o-Y Growth Trend, 2026-2036F
- Israel Market Value (USD Million) and CAGR & Y-o-Y Growth Trend, 2026-2036F
- Qatar Market Value (USD Million) and CAGR & Y-o-Y Growth Trend, 2026-2036F
- Kuwait Market Value (USD Million) and CAGR & Y-o-Y Growth Trend, 2026-2036F
- Oman Market Value (USD Million) and CAGR & Y-o-Y Growth Trend, 2026-2036F
- South Africa Market Value (USD Million) and CAGR & Y-o-Y Growth Trend, 2026-2036F
- Rest of Middle East & Africa Market Value (USD Million) and CAGR & Y-o-Y Growth Trend, 2026-2036F
- By Technology
- Overview
- Global Economic Scenario
- World Economic Outlook
- About Research Nester
- Our Global Clientele
- We Serve Clients Across World
Solar Panel Market Outlook:
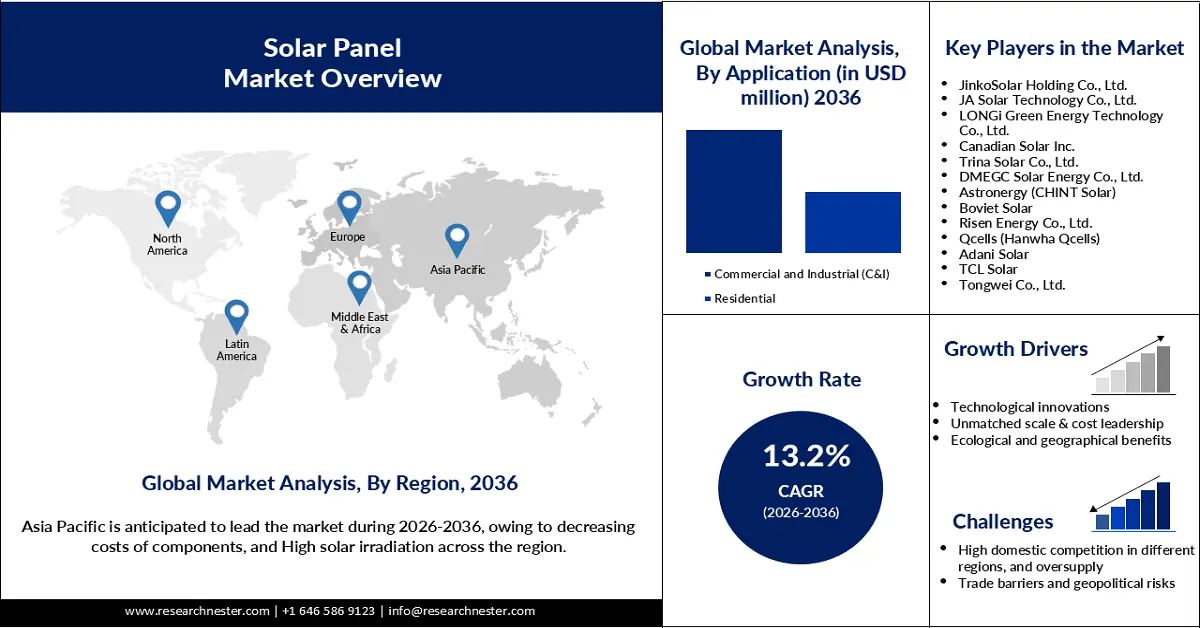
Solar Panel Market size was valued at USD 202.8 billion in 2025 and is expected to reach USD 700.1 billion by the end of 2036, registering a CAGR of 13.2% during the forecast period, i.e., 2026-2036. In 2026, the industry size of solar panel is estimated at USD 229.5 billion.
Growing demand for solar panels is expected to fuel market growth by increasing the rate of installation of the photovoltaic technology. The technology is in high demand in commercial businesses, utility companies, and households globally, due to the need for reducing energy bills, contributing to achieving net-zero emissions, and increasing the green electricity capacity. For instance, as per the report by the Solar Energy Industries Association, in the first quarter of 2025, more than 1.1 GW of residential solar was installed in the U.S. only. Power outage is a significant factor that influences the adoption of solar panels in residences.
The focus of governments to promote the installation of solar panels is expected to boost the market growth in the coming years. As reported by the International Energy Agency (IEA), solar photovoltaic (PV) adoption and capacity growth are driven by the implementation of new, ambitious policies. The Government of India announced a subsidy in February 2024 for the installation of solar panels on the roofs of residential buildings, under Muft Bijli Yojana. Up to 40% of the installation of solar panels was planned to be covered by the government through this subsidy, benefiting around 10 million households across the country.
Solar Panel Production Policy & Capacity Development 2023
|
Region/Country |
Key Highlights |
|
China |
Added 260 GW in the production capacity, adhering to the 14th Five-Year Plan for Renewable Energy |
|
European Union |
Contributed to reducing the energy crisis by accelerating the deployment of solar PV through the addition of 61 GW, an increase of 45% in relation to the previous year. The result is driven by policies, such as the REPowerEU Plan and the Green Deal Industrial Plan |
|
The U.S. |
An increase in PV addition by 70% due to the government support through funding announced under the Inflation Reduction Act |
|
India |
Installation of 12GW of solar PV, the ease of nationwide supply chain challenges, and expansion of auction volumes to translate the same into the project pipeline |
|
Brazil |
The inclusion of 15 GW solar PV capacity increase of 30% compared to the previous business year |
Source: IEA
Source: SEIA
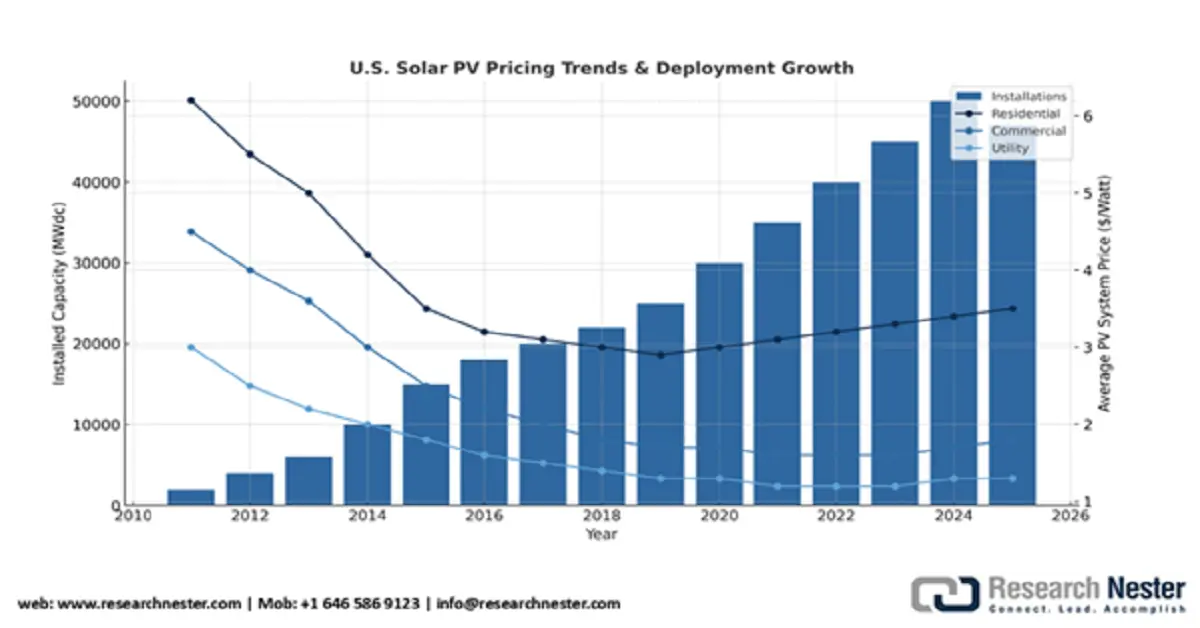
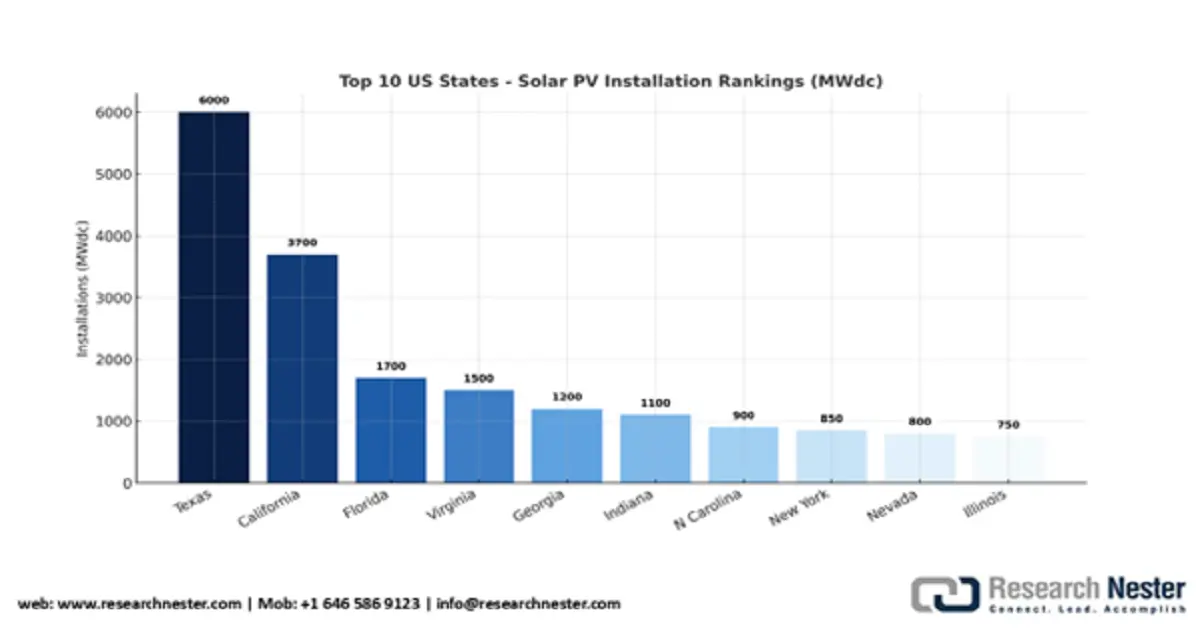
The slump in solar installation costs over the last decade has made it economically competitive compared to conventional electricity generation. An average-sized residential solar panel price in the U.S. subsided from pre-incentive USD 40,000 in 2010 to USD 26,880. Utility-scale PPA cost ranges between USD 16/MWh and USD 35/MWh. Historically, California has been dominating the solar market, whereas Texas led new installations in Q1 2025 among all other states, with 2.6 GW of new installed capacity, as per the SEIA Q3 2025 report. Moreover, 34 U.S. states and Puerto Rico collectively installed roughly 1 GW of solar, compared to mere 3 states a decade ago. With the growing potential in the solar sector, new entrants will capture a staggering share in the global market.
Key Solar Panel Market Insights Summary:
Regional Highlights:
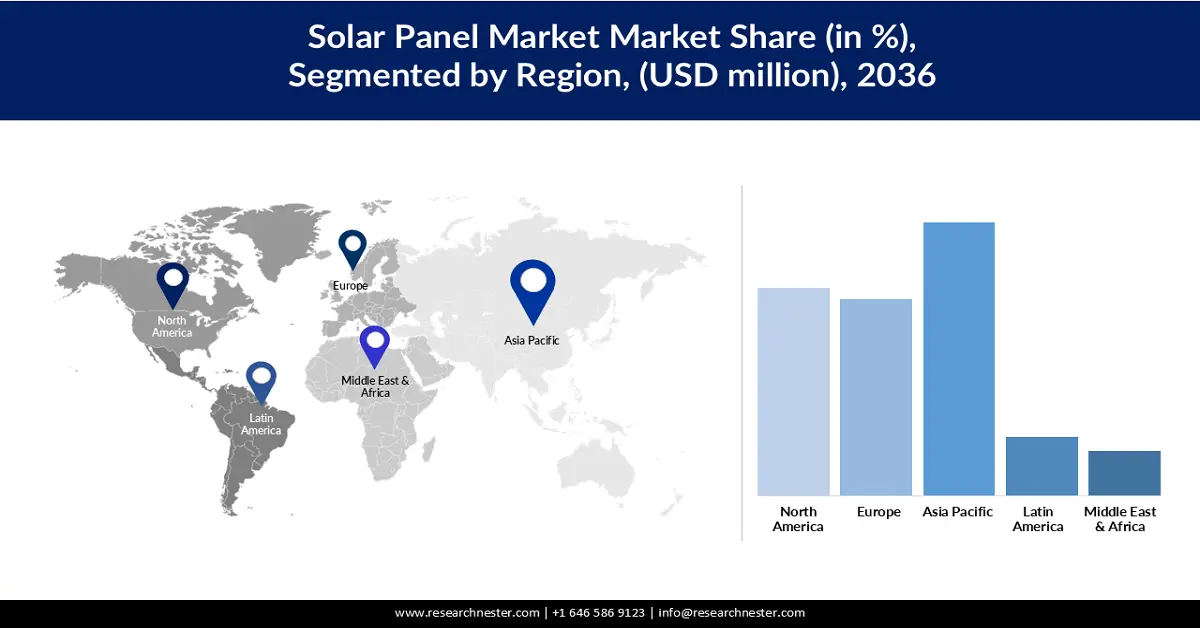
- By 2036, the Asia Pacific region is projected to secure a 37.9% share of the Solar Panel Market, stemming from declining component costs.
- The North America region is anticipated to hold a considerable share by 2036, attributed to tariff-driven module price increases.
Segment Insights:
- The thin film segment is expected to command a 51.9% share by 2036 in the Solar Panel Market, boosted by cost-effectiveness and expanding production capacity.
- The ground-mounted segment is anticipated to secure a substantial share by 2036, supported by rising global investments in renewable energy infrastructure.
Key Growth Trends:
- Technological innovations
- Unmatched scale & cost leadership
Major Challenges:
- High domestic competition in different regions, and oversupply
- Trade barriers and geopolitical risks
Key Players: JinkoSolar Holding Co., Ltd., JA Solar Technology Co., Ltd., LONGi Green Energy Technology Co., Ltd., Canadian Solar Inc., Trina Solar Co., Ltd., DMEGC Solar Energy Co., Ltd., Astronergy (CHINT Solar), Boviet Solar, Risen Energy Co., Ltd., Qcells (Hanwha Qcells), Adani Solar, TCL Solar, Tongwei Co., Ltd.
Global Solar Panel Market Forecast and Regional Outlook:
Market Size & Growth Projections:
- 2025 Market Size: USD 202.8 billion
- 2026 Market Size: USD 229.5 billion
- Projected Market Size: USD 700.1 billion by 2036
- Growth Forecasts: 13.2% CAGR (2026-2036)
Key Regional Dynamics:
- Largest Region: Asia Pacific (37.9% Share by 2036)
- Fastest Growing Region: Europe
- Dominating Countries: United States, China, Germany, Japan, India
- Emerging Countries: Brazil, South Korea, Vietnam, Saudi Arabia, Mexico
Last updated on : 29 September, 2025
Solar Panel Market - Growth Drivers and Challenges
Growth Drivers
- Technological innovations: Technological innovations, including the development of perovskite solar cells, are expected to fuel the solar panel market growth. Such innovations are replacing the use of traditional silicon panels, since perovskites absorb a wider range of sunlight, ranging from visible to near-infrared light. Organizations associated with the industry are also initiating strategic collaborations to bring innovation to solar panels. For instance, in August 2025, a leading solar technology company, Oxford PV, unveiled its collaboration with the Fraunhofer Institute for Solar Energy Systems for the development of the next-generation tandem solar panel. A record 25% conversion efficiency was achieved by the panel.
- Unmatched scale & cost leadership: Companies involved in the manufacturing of solar panels are enabled with the capability to produce photovoltaic technology in bulk. The vast production volume is increasing the scope for manufacturers to offer the technology to consumers at lower costs, since with bulk production, the cost per unit decreases. For example, in April 2024, LONGi reported that it was upgrading its HPBC 1.0 production line to N-type HPBC 2.0 technology. A 97% yield rate was observed in the cell operational lines of the photovoltaic business.
- Ecological and geographical benefits: To differentiate factors, the abundance of sunlight, which is the primary energy source in solar panels, and raw materials accessibility, required for the manufacturing of the photovoltaic technology, are influencing the emergence of resource advantage as a growth driver for the solar panel market. The adoption of silicon produced sustainably by the solar panel suppliers is likely to increase their sustainability, especially when governments are supporting the sustainable production of silicon. For instance, in November 2024, Elkem obtained funding of USD 1.8 million from the European Union for silicon production with carbon looping. Elkem Sicalo is the product being produced, contributing to eliminating CO2 emissions in the production of silicon. The geographical position of different regions imposes remarkable advantages for the solar panel market. Geographic advantages help solar panel suppliers attract end users based on distinct causes.
Challenges
- High domestic competition in different regions, and oversupply: The solar panel market is likely to face saturation and high price competition due to the engagement of a vast number of domestic players across different regions. High competition also hinders the entry of new entrepreneurs with diverse offerings. Markets like China are also likely to face issues with oversupply of solar panels due to the presence of a vast number of key players that influence the imbalance in sales in relation to production. The emergence of these challenges can even lead to market failure.
- Trade barriers and geopolitical risks: High initial investment hinders the emergence of new suppliers, in turn affecting the global trade scenario. Variations in tariffs for international trade, trade agreements across various regions, and disruptions in the supply chain are hampering the operational efficiency of businesses. The ways of receiving regulatory approvals, the need for taking suitable measures to comply with regionally set regulatory standards, and manufacturing concentration risks are increasing the complexity for industry stakeholders.
Solar Panel Market Size and Forecast:
| Report Attribute | Details |
|---|---|
|
Base Year |
2025 |
|
Forecast Year |
2026-2036 |
|
CAGR |
13.2% |
|
Base Year Market Size (2025) |
USD 202.8 billion |
|
Forecast Year Market Size (2036) |
USD 700.1 billion |
|
Regional Scope |
|
Solar Panel Market Segmentation:
Technology Segment Analysis
The thin film segment is expected to account for a share of 51.9% by the end of 2036, owing to its cost-effectiveness and adequate production. The emergence of thin film panels in the market is replacing the use of silicon through the use of rare materials, such as indium and cadmium. Companies are also investing in the production of solar panels that need indium and cadmium. For instance, in January 2024, the leading manufacturer of CdTe solar panels, First Solar, inaugurated a 3.3 GW capacity-enabled solar module manufacturing plant in Tamil Nadu, India. Around USD 700 million was invested in the project. Such an increase in the production capacity of CdTe solar panels, a thin-film solar cell, fuels the growth of the segment. The likelihood of the technology being used in space, owing to its highly efficient semiconductor materials and capability to tolerate radiation, is another factor influencing dominance.
Deployment Segment Analysis
The ground-mounted segment is anticipated to acquire a remarkable revenue share by the end of 2036, due to high demand globally, since the technology contains high scalability and capacity to generate energy. Rising investment globally for the development of renewable energy infrastructure is another factor fueling the segment growth. For instance, the FDI in India’s renewable energy sector attracted an investment of USD 19.9 billion between April 2020 and September 2024. According to the IEA, the FDI in India’s power generation capacity was USD 5 billion in 2023, almost twice the pre-coronavirus levels. The government, with an outlay of USD 2.23 billion, allocated 48,337 MW of domestic PV module production capacity as part of the PLI scheme. Such investments influence the dominance of the segment by driving utility projects at a large scale and increasing the demand for the segment.
Application Segment Analysis
By 2036, the commerce & industrial (C&I) segment is expected to hold a significant revenue share, owing to the tendency of companies to save costs, become energy independent, and contribute to achieving global sustainability goals. Investment by companies in the installation of solar panels is constant and is likely to remain the same. For instance, as reported by the Environment America in October 2024, Walmart set some targets to be achieved by 2030 with the motive of completing 10 GW of new clean energy projects. The plan encompassed an objective of adding 1 G of new clean energy on-site with the use of solar and storage. The generation of 2 Ge of community solar was also included in the plan of the retailer.
Our in-depth analysis of the solar panel market includes the following segments:
|
Segments |
Subsegments |
|
Technology |
|
|
Deployment |
|
|
Connection type |
|
|
Application |
|

Vishnu Nair
Head - Global Business DevelopmentCustomize this report to your requirements — connect with our consultant for personalized insights and options.
Solar Panel Market - Regional Analysis
Asia Pacific Market Insights
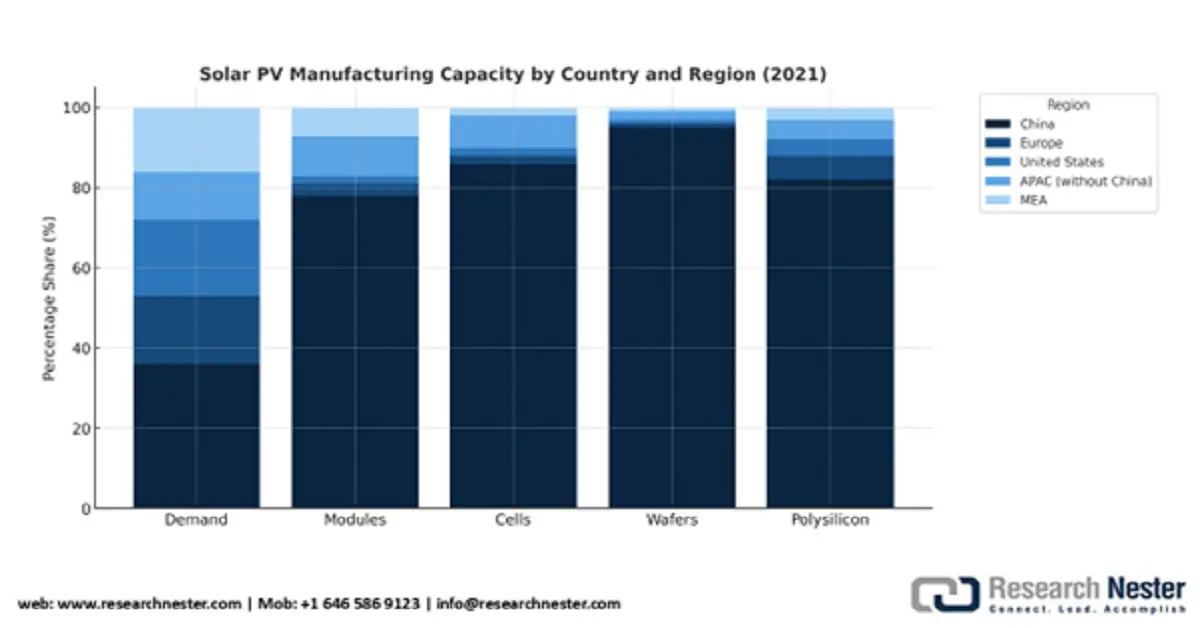
The Asia Pacific solar panel market is set to witness steady growth, acquiring a market share of 37.9% by the end of 2036, owing to decreasing costs of components. As reported by the IEA, China is the most cost-competitive location for panel production. Such costs are lower by 10%, 20%, and 35% in China compared to India, the U.S., and Europe, respectively. High solar irradiation across the region is another factor fueling the market growth by generating the scope to witness an increase in current and power out from solar panels. According to the Round Trip, India has the largest solar plant, with 2.25 GW, established in Rajasthan.
Largest Solar Plants, in 2025
|
Rank |
Name |
Country |
Capacity (GW) |
|
1 |
Bhadla Solar Park |
India |
2.25 |
|
2 |
Huanghe Hydropower Hainan Solar Park |
China |
2.2 |
|
3 |
Shakti Sthala Solar Project |
India |
2.05 |
|
4 |
Benban Solar Park |
Egypt |
1.65 |
|
5 |
Tengger Desert Solar Park |
China |
1.55 |
Source: The Roundup
Source: IEA
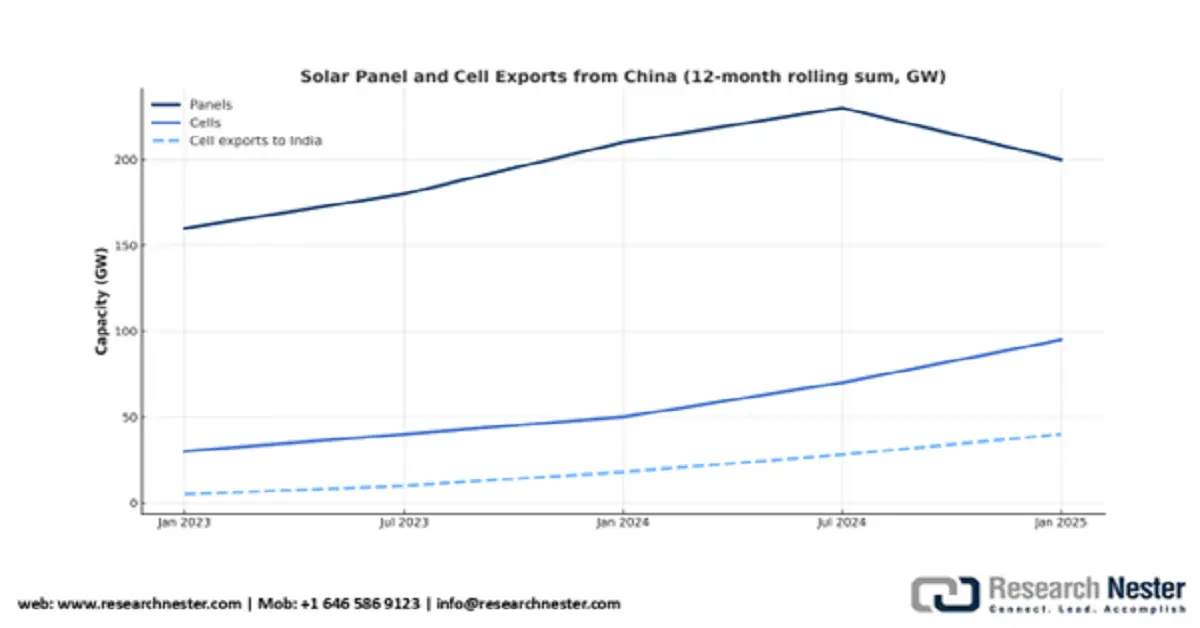
As estimated, the solar panel market in China is set to witness a rapid expansion at a CAGR of 10.33% during the forecast period, on account of the growing production and exports of solar cells. As per the report by Ember Energy, published in August 2025, exports of solar cells from China have increased by 73% in 2025, with India being the top destination. The government is also active in increasing the sustainability of the solar panel industry. For instance, in November 2024, the government issued guidelines regarding operations within the solar panel industry. China’s panel share of exported capacity in H1 2025 (January-June) was 58% of all solar products.
Countries that accounted for Three-Quarters of China’s Solar Cell Exports In The First Half Of 2025
|
Destination |
Share |
Capacity Imported |
|
India |
48% |
21.22 GW |
|
Indonesia |
17% |
7.73 GW |
|
Türkiye |
10% |
4.24 GW |
Source: EMBER
Solar product prices have dramatically declined over the last few years (dropping by 63% during the Russia-Ukraine conflict), owing to ongoing production innovations and widespread manufacturing capacity expansion. Since late 2024, prices of Chinese goods have stabilized, amid intensified government and industry efforts to maintain profitability. Furthermore, this was driven by China’s rapid solar capacity installations over H1 2025. Since August 2022, the cells and panels that were exported from China have declined by USD 0.16 and USD 0.20 per Watt (W), or cells slumping to USD 0.03/W from USD 0.19/W, and panels to USD 0.09/W from USD 0.29/W.
Solar Cell Price Reductions Leading to Falls in Panel Prices, with both Plateauing in 2025
Source: EMBER
The solar panel market in India is expected to witness robust growth at a remarkable CAGR during the forecast period, owing to massive imports of solar cells. Pollution in India caused by the use of non-renewable energy sources is another factor, boosting the demand for solar panels to be installed across households and commercial places. As per the research by the Institute of Physics in December 2022, the coal-heavy electricity system in India is the third largest worldwide and contributes to making India a country with high pollution and emission of greenhouse gases, fueling the demand for solar energy-powered electricity systems as an alternative.
India is building its local panel manufacturing sector. According to the Indian Ministry of New and Renewable Energy (MNRE), 16 GW of cell and 36 GW of panel capacity were added in 2024. Cell and panel production capacities stood at 25 GW and 68 GW in March 2025, which was over double the solar capacity installed in the previous year (32 GW), and an estimated projection of 120 GW solar panel capacity by 2030.
North America Market Insights
The North America market is poised to garner a prominent revenue share during the forecast timeline. In Q2 2025, solar panel costs after the implementation of the April 2025 10% baseline tariffs. The AD/CVD case of Cambodia, Thailand, Malaysia, and Vietnam on solar cells and modules, which commenced in April 2024 and was finalized in May 2025. This led to a surge in module price by 13% annually across the distributed generation sector. The cost averaged at USD 3.36/Wdc residential system, growing at 2% Y-O-Y, and the commercial system cost averaged at USD 1.57/Wdc, registering a CAGR of 10% during the same timeline.
U.S. dominates the North America market for solar panels. The country generated 114.7 terawatt-hours (TWh) of solar in 2021 (cumulative of residential, commercial, and community sectors). Texas has the highest number of new solar installations, followed by Florida and California. However, California leads in terms of solar energy production, with 35.95 GW in 2021.
Source: TheRoundup
Furthermore, a shift among corporations to adopt sustainable processes and solutions as part of ESG has created a favorable market scenario. 18% of overall U.S. solar is from corporate procurement (large on-site arrays and small-scale rooftop systems).
Top 25 Companies by Solar Capacity, through Q1 2024
|
Companies |
Installations |
|
Amazon |
2,930 MWdc |
|
|
1,632 MWdc |
|
Meta Platforms, Inc. |
502 MWdc |
|
WestRock |
269 MWdc |
|
Verizon |
258 MWdc |
|
McDonald's |
189 MWdc |
|
General Motors |
180 MWdc |
|
Gerdau |
102 MWdc |
|
Digital Realty |
29 MWdc |
|
Home Depot |
29MWdc |
Source: SEIA
The Canada government offers homeowners a grant or subsidy of $1.00 per watt for solar panel systems, up to $5,000 as part of the Greener Homes Initiative. According to the Energy Hub, there are about 32 residential incentive programs promoting the proliferation of solar systems. This includes 15 solar financing options, 16 solar rebates, and 1 solar tax incentive. In British Columbia, the government offers a 7% PST exemption for PV equipment under the PST Tax Exemption. Nova Scotia has a rebate of $0.30 per watt up to a maximum rebate of $3,000 on the purchase of PV systems.
Europe Market Insights
The solar panel market in Europe is poised to acquire a significant revenue share over the analysis timeline. The EU annual market is projected to reach 93.2 GW by 2027, and the capacity is estimated to reach 902 GW in 2030, resulting in the creation of 1,100,000 jobs in 2028. Several initiatives, such as Horizon Europe, NER 300 programme, LIFE, European structural and investment funds (ESIF), and European Climate Infrastructure and Environment Executive Agency (CINEA), have been initiated in Europe. The EU aims to grow the solar PV capacity to 600 GW by 2030 from 263 GW as of February 2024.
The Germany solar PV market is anticipated to witness a robust expansion during the forecast timeline, as a consequence of stringent regulations. For example, the Solar Package 1 law imposes new regulations that reduce bureaucratic barriers for rooftop PV systems, solar installations, energy storage, and grid integrations, and eliminates the need for marketing for systems up to 200 kWp. The law also removed the need for power plant certification for systems under 500 kW. Bid limits increased in newly introduced auction segments for agri-, floating, and parking lot PV. Under the law, the Federal Network Agency also launched a new public tender for a solar PV systems capacity increase of 2,266,466 kilowatts. Rising electricity prices are likely to fuel the demand for solar panels across Germany. In H1 2025, wholesale electricity prices in Germany increased by 37%.
The Solar PV Market in Spain is set to grow exponentially, taking advantage of the abundant sunlight and geographical position of the country. As reported by Red Electrica in February 2025, PV capacity in Spain surpassed wind power capacity of 32,007 MW, and reached 32,043 MW, representing 25% of the total installed energy capacity of the country. In January 2025, 9.5% of the total monthly electricity generation was through solar PV to 2,292 GWh. Rising investor interest is another factor, anticipated to increase the market accessibility of solar panels. As reported by the European Investment Bank in November 2024, it signed an investment agreement of USD 469.9 million for solar energy and onshore projects in Spain, including the establishment of new power stations, renovation of existing hybrid facilities, and powering more than 1,150,000 homes.
Key Solar Panel Market Players:
- JinkoSolar Holding Co., Ltd.
- Company Overview
- Business Strategy
- Key Product Offerings
- Financial Performance
- Key Performance Indicators
- Risk Analysis
- Recent Development
- Regional Presence
- SWOT Analysis
- JA Solar Technology Co., Ltd.
- LONGi Green Energy Technology Co., Ltd.
- Canadian Solar Inc.
- Trina Solar Co., Ltd.
- DMEGC Solar Energy Co., Ltd.
- Astronergy (CHINT Solar)
- Boviet Solar
- Risen Energy Co., Ltd.
- Qcells (Hanwha Qcells)
- Adani Solar
- TCL Solar
- Tongwei Co., Ltd.
The global market players have identified the major trends, such as an inclination toward energy sustainability and high competitiveness, to bank on the future potential. They are keen on capitalizing on such market traits and position themselves as global giants, and gain a noteworthy share.
A few of the prominent players operating in the solar panel industry include:
Recent Developments
- In July 2025, collaboratively, Qingdao Municipality, China Chemical Corporation (Sinopec), and Shandong Province unveiled China's first commercial floating offshore PV project in full seawater. The 7.5 MW facility is poised to generate power of 16.7 million kWh.
- In July 2025, Sunora Solar introduced the pioneering G12R Solar Module at the Mercom India Summit. Following the N-type TOPCon cell technology, the solar module was developed, likely to become increasingly famous with 23% efficiency and 640 WP of output capacity.
- In November 2023, Astronergy unveiled ASTRO N7s n-type TOPCon PV module products, integrated with Boron-LDSE cell innovation, and have an average efficiency of 35.7%. The products are enhancing module power and reducing the cost per unit significantly.
- Report ID: 937
- Published Date: Sep 29, 2025
- Report Format: PDF, PPT
- Explore a preview of key market trends and insights
- Review sample data tables and segment breakdowns
- Experience the quality of our visual data representations
- Evaluate our report structure and research methodology
- Get a glimpse of competitive landscape analysis
- Understand how regional forecasts are presented
- Assess the depth of company profiling and benchmarking
- Preview how actionable insights can support your strategy
Explore real data and analysis
Frequently Asked Questions (FAQ)
About this Report
Connect with our Expert

Report, 2026-2036


Copyright @ 2026 Research Nester. All Rights Reserved.
