Printed Batteries Market - Growth Drivers and Challenges
Growth Drivers
- Electric Vehicle (EV) market expansion: The rapid rise in EV adoption has created opportunities for printed batteries. Although lithium-ion is still a prevalent choice, printed batteries, especially 3D-printed solid-state and lithium-metal ones, are showcasing promising potential for electric vehicles. It allows customizable designs, in terms of shapes and sizes, which directly impacts manufacturing costs and environmental aftermath. EV deliveries surged by 48% in 2023 in the U.S. and reached 1.6 million BEV + PHEV units, as per OICA. Most EV manufacturers experienced a surge in sales between 2022 and 2023. The overall increase was calculated at 35% in this period. BYD launched 30 new models across 10 segments. This led to sales of 3 million units in 2023.
Leading Global EV Manufacturers
|
EV Manufacturer |
Plugin Vehicle Sales, Jan-Dec 2023 |
|
Tesla |
1,808,652 |
|
BYD Group |
1,570,388 |
|
SAIC |
748, 159 |
|
Volkswagen Group |
742,703 |
|
Geely-Volvo |
589,932 |
Source: OICA
U.S. Electric Car Sales
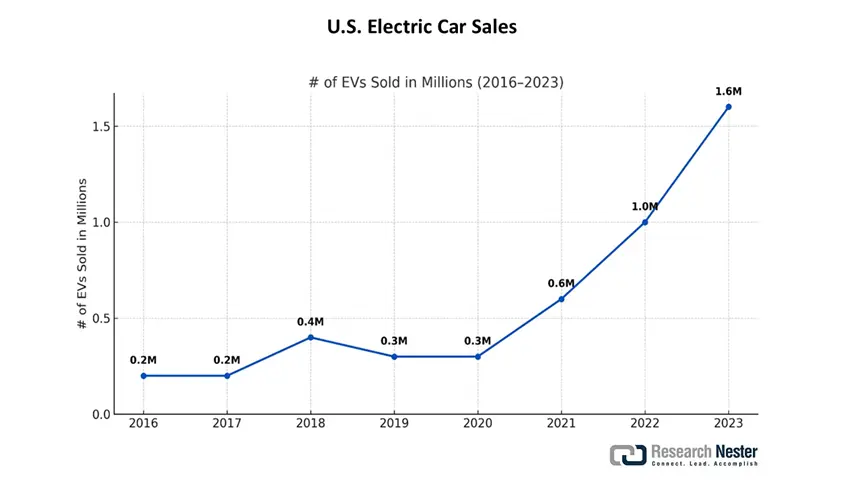
Source: OICA
- Renewable energy storage growth: Printed batteries are pivotal to facilitate renewable energy storage in solar and wind systems-based IoT devices and provide grid stability. According to the IEA, battery storage in the power industry emerged as the fastest-expanding energy technology in 2023, with deployment doubling year-on-year. The sustainable battery materials market is poised to reach USD 111 billion by 2037, owing to innovations in chemical production, including bio-based electrolytes and efficacy in terms of carbon footprint. Carbon emissions in battery production primarily arise from cathode and anode active material sourcing, mineral refining, production, and manufacturing processes. Printed batteries align with government policies around carbon emissions.
Global Installed Renewable Energy and Energy Storage Capacity by Scenario, 2022 and 2030
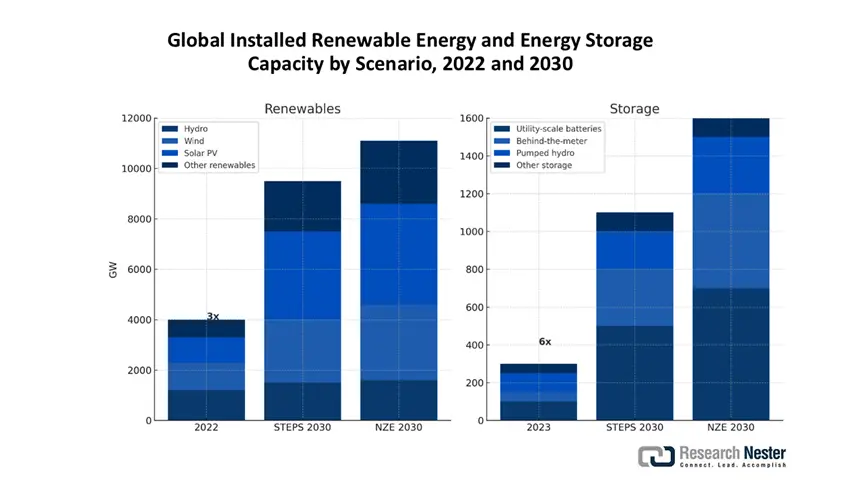
Energy storage capacity, led by battery storage, increases sixfold by 2030 in the NZE Scenario and supports the tripling of the renewables capacity goal
Source: IEA
Raw Material Supply Chain of Batteries
|
1 |
Mining |
Extraction of raw ores for battery materials |
|
2 |
Processing |
Raw material refining to form precursors of battery materials |
|
3 |
Cell component manufacturing |
Specialized battery component production: anode and cathode materials, separators, electrolytes, casings |
|
4 |
Pack production |
Development and integration of battery cells in battery packs, like sensors, electronics, and management systems |
|
5 |
Battery storage |
Storage in low-emission power systems |
|
6 |
Deployment |
Assemble and supply to end users |
|
7 |
Reuse/Recycle |
Recycling of minerals and materials for repurposing |
Geographical Distribution of the Global Battery Supply Chain
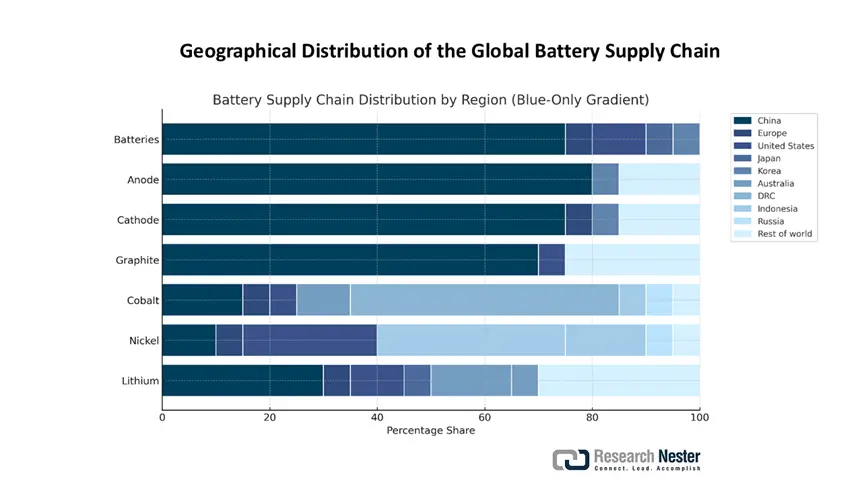
The raw material supply and extraction of battery metals are primarily concentrated in certain geographies and are susceptible to supply shocks and restrains. The IEA World Energy Outlook report suggests that Australia generates almost 45% of the total lithium, and the Democratic Republic of the Congo (DRC) contributes 65% of the world’s cobalt production. Furthermore, Indonesia supplies 55% of the total Nickel, much of which is in the form of lateritic deposits. This is then converted to intermediate chemicals such as battery-grade sulphate via the high-pressure acid leach method. Indonesia alone provides 60% of the worldwide battery-grade sulphate. Zinc offers potential advantages over lithium, ascribed to its accessibility, abundance, and affordability. Zinc concentrate is 52-83 ppm, and lithium concentrate is 22-32 ppm. Zinc price reached its highest – $4.43 per kg and dropped below $2.5 per kg in 2023, whereas lithium cost $426 per kg and slumped below $200 per kg in 2023.
The key reason for this price discrepancy lies in the supply/demand dynamics and manufacturing scales. According to a May 2024 study by NCBI, the current production of zinc is roughly 13,000 kt annually and proven reserves of 210,000 kt, which makes it the fourth most extracted element. Eight countries- China, Australia, Peru, India, the U.S., Mexico, Russia, and Bolivia contribute 77.2% of the cumulative zinc and own 78.5% of the global reserves. This approximately sums up to ~1,900,000 kt. Additionally, thin-film rechargeable zinc batteries are a sustainable and affordable alternative to lithium-ion counterparts for IoT devices and renewable energy storage.
Top Zinc Ores and Concentrates Trade Players, 2023
|
Exporter |
Export Value |
Importer |
Import Value |
|
Peru |
USD 1.73 billion |
China |
USD 3.71 billion |
|
Australia |
USD 1.45 billion |
South Korea |
USD 1.21 billion |
|
The U.S. |
USD 1.01 billion |
Spain |
USD 782 million |
Source: OEC
Global zinc mine production grew by 5% and reached 12.7 million metric tons (Mt) in 2020, and smelter manufacturing declined by 3%, valuing a gross weight of 13.4 Mt of zinc. As per the International Lead and Zinc Study Group (ILZSG), the worldwide zinc usage surged from 13.3 Mt in 2020 to 14.0 Mt in 2021, underscoring 6% CAGR. Zinc was listed by the Defense Logistics Agency Strategic Materials as a candidate for the Annual Materials Plan (AMP). The AMP ceiling disposal for zinc, in terms of quantity, was 7,250 t or 7,993 short tons for the fiscal year 2021. This suggests that the maximum quantity of zinc sold from the NDS in the fiscal year was the same quantity that remained in the stockpile. In the fiscal year 2021, the stockpile was at 7,250 t at year's end, and no zinc was disposed of.
Battery manufacturing capacity predominantly lies with China and amounts to 85% of present production capacity, marking a significant rise from 75% in 2020. Europe and the U.S. together account for 13% of the capacity. The world’s battery manufacturing capacity is projected to expand fourfold from current levels by the end of 2030, assuming all planned projects are materialized on time. This will facilitate decoupling from dependence on China, and the country's share is likely to reduce by 2030 as a result of these efforts. Furthermore, Korean companies are emerging as international investors in the assembly, distribution, and supply of batteries. They own more than 400 GWh of capacity outside Korea. Chinese and Japanese firms also own production capacity in other countries, 30 GWh of Chinese and 60 GWh of Japanese non-domestic capacity, which are much smaller volumes. In Europe, Korean companies dominate the scenario, with the LG Energy Solution plant in Poland alone contributing to half of Europe’s total battery manufacturing capacity.
Challenges
- Lack of performance reliability in adverse conditions: Printed batteries hold considerable promise for applications in flexible electronics and IoT technologies. However, several real-world obstacles have slowed their broader rollout. One major concern is the cost of production, which remains notably higher than that of standard battery options. This price gap makes it difficult for manufacturers to scale up operations or compete with established alternatives in the printed batteries market. Additionally, the limited energy storage capacity of these batteries restricts their application to low-power devices. Access to essential materials, especially conductive inks and specific substrates needed for production, is also limited, further complicating the supply chain. Moreover, these batteries often struggle to maintain stable performance in harsh conditions, such as changes in temperature and humidity, raising doubts about their long-term dependability in real-world environments.
Printed Batteries Market Size and Forecast:
|
Base Year |
2025 |
|
Forecast Year |
2026-2035 |
|
CAGR |
38.32% |
|
Base Year Market Size (2025) |
USD 330 million |
|
Forecast Year Market Size (2035) |
USD 8.46 billion |
|
Regional Scope |
|

