Power Quality Equipment Market Outlook:
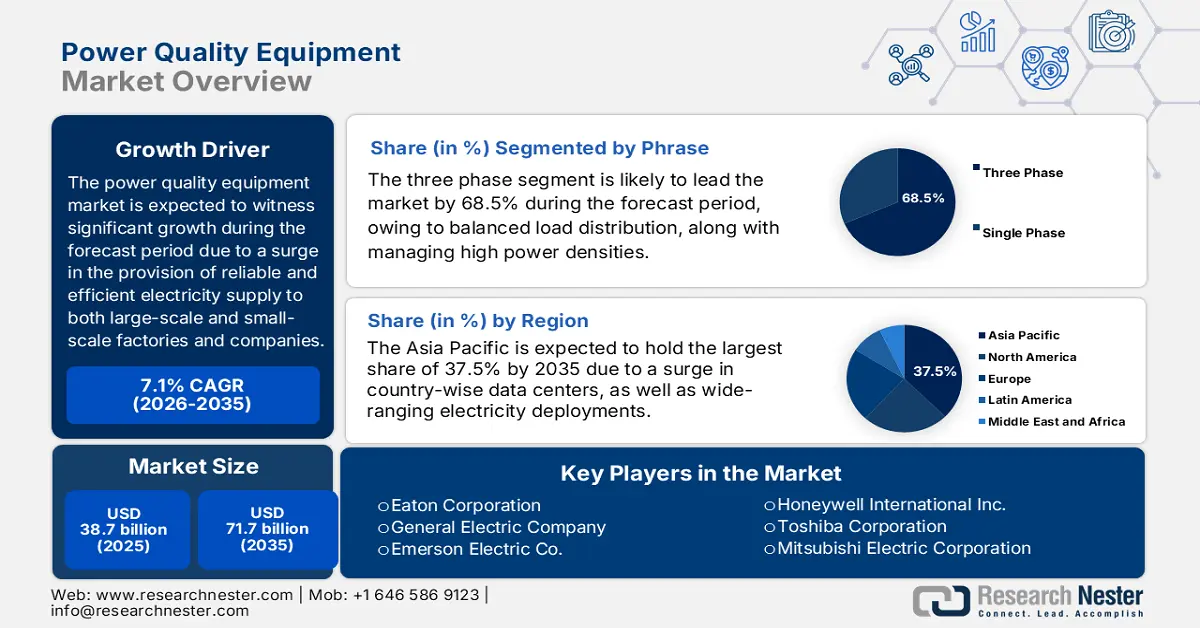
Power Quality Equipment Market size was over USD 38.7 billion in 2025 and is estimated to reach USD 71.7 billion by the end of 2035, expanding at a CAGR of 7.1% during the forecast timeline, i.e., 2026-2035. In 2026, the industry size of power quality equipment is estimated at USD 41.4 billion.
The international market significantly ensures efficient, reliable, and stable electricity supply by combating issues, including transients, harmonics, and voltage sags. With global sectors increasingly reliant on renewable energy integration, automation, and sensitive electronics, the demand for innovative power quality solutions is equally escalating. According to an article published by the IEA Organization in 2025, the presence of renewable sources for electricity generation is continuing to expand, and the worldwide capacity is projected to double by the end of 2030, denoting an upsurge by 4,600 GW. Regarding this increase, solar photovoltaic (PV) accounts for nearly 80% of the overall increase, which is followed by geothermal, bioenergy, wind, and hydropower, thereby making it suitable for bolstering the market’s growth and expansion globally.
Renewable Electricity Capacity Growth by Technology (2013-2030)
|
Renewable Capacity Type |
2013-2018 (GW) |
2019-2024 (GW) |
2025-2030 (GW) |
|
Solar PV |
438 |
1,622 |
3,546 |
|
Wind |
298 |
566 |
873 |
|
Hydropower |
205 |
138 |
154 |
|
Other |
52 |
48 |
32 |
|
Share of PV |
44% |
68% |
77% |
Source: IEA Organization
Furthermore, the integration with the Internet of Things (IoT) and smart grids, renewable energy adoption, electrification of industrial processes, expansion in data centers, and circular economy and sustainability strategies are other factors that are uplifting the power quality equipment market globally. As per a data report published by the IEA Organization in 2025, the aspect of advanced digitalized infrastructure has gained prominence in electricity grids, with almost 7% growth in investment as of 2022. The distribution industry caters to nearly 75% of overall investment, which is positively impacting the market’s growth and expansion. Besides, the Europe Commission is currently expecting almost EUR 584 billion (USD 633 billion) of investment in electricity grid by the end of 2030. Simultaneously, China has readily expanded and modernized its power grids with USD 442 billion in funding, and the U.S. declared the Grid Resilience Innovative Partnership (GRIP) Program, with USD 10.5 billion as a funding opportunity.
Key Power Quality Equipment Market Insights Summary:
Regional Insights:
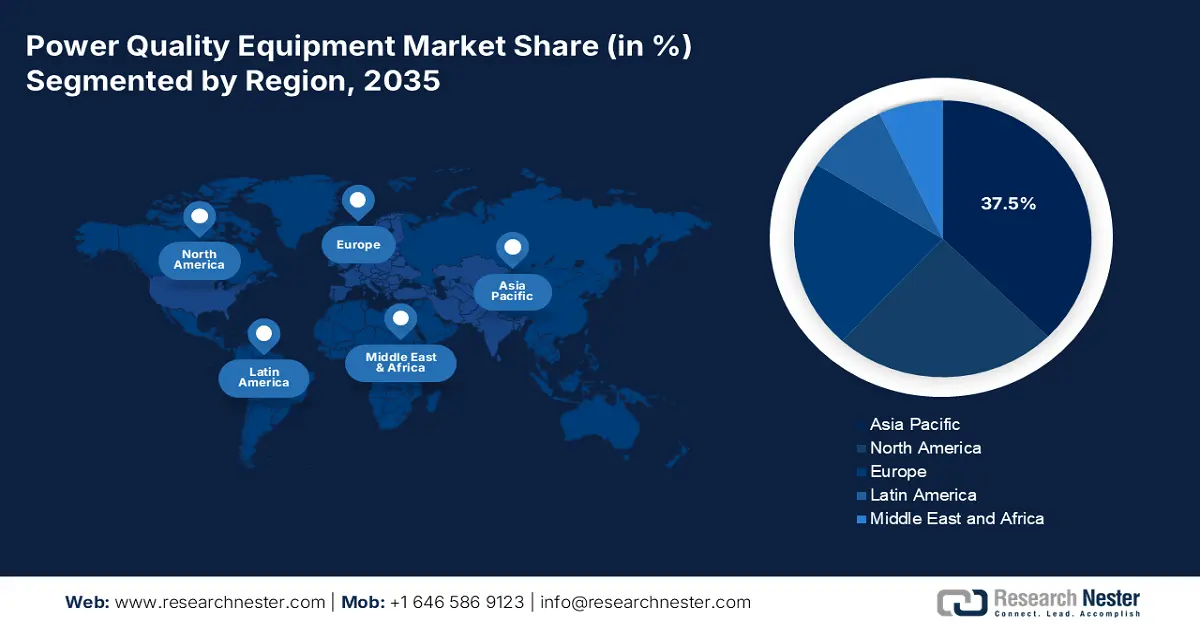
- By 2035, the Asia Pacific region is expected to secure a 37.5% share in the power quality equipment market, sustained by expanding data centers and rapid urbanization across major economies in the region.
- Europe is projected to advance at the fastest pace through 2026–2035, supported by grid digitalization, strict compliance norms, and accelerating industrial electrification.
Segment Insights:
- The three phase segment in the power quality equipment market is projected to command a 68.5% share by 2035, bolstered by its superior efficiency, balanced loads, and strong suitability for high-power industrial environments.
- The utility/primary distribution segment is anticipated to hold the second-largest share during 2026–2035, strengthened by rising requirements for stabilizing medium-voltage networks and integrating renewables.
Key Growth Trends:
- Increase in robotics and automation
- Rise in the demand for uninterrupted power supply
Major Challenges:
- Increase in initial investment expenses
- The absence of standardization and regulatory complexity
Key Players: Siemens AG (Germany), Schneider Electric SE (France), Eaton Corporation (U.S.), General Electric Company (U.S.), Emerson Electric Co. (U.S.), Honeywell International Inc. (U.S.), Toshiba Corporation (Japan), Mitsubishi Electric Corporation (Japan), Fuji Electric Co., Ltd. (Japan), Hyundai Electric & Energy Systems Co., Ltd. (South Korea), LS Electric Co., Ltd. (South Korea), Hitachi, Ltd. (Japan), Crompton Greaves Power and Industrial Solutions Limited (India), Kirloskar Electric Company Limited (India), Wilson Transformer Company (Australia), NHP Electrical Engineering Products Pty Ltd (Australia), Tenaga Nasional Berhad (Malaysia), Meiden Singapore Pte Ltd (Singapore), Hyosung Heavy Industries Corporation (South Korea).
Global Power Quality Equipment Market Forecast and Regional Outlook:
Market Size & Growth Projections:
- 2025 Market Size: USD 38.7 billion
- 2026 Market Size: USD 41.4 billion
- Projected Market Size: USD 71.7 billion by 2035
- Growth Forecasts: 7.1% CAGR (2026-2035)
Key Regional Dynamics:
- Largest Region: Asia Pacific (37.5% Share by 2035)
- Fastest Growing Region: Europe
- Dominating Countries: United States, China, Germany, Japan, South Korea
- Emerging Countries: India, Brazil, Indonesia, Vietnam, Mexico
Last updated on : 12 December, 2025
Power Quality Equipment Market - Growth Drivers and Challenges
Growth Drivers
- Increase in robotics and automation: The existence of robotics and automated production lines are extremely sensitive to harmonic and voltage sags, owing to which there is a huge demand for the power quality equipment market. Such equipment has the capability to ensure smooth operations, as well as diminish scrap and downtime. According to a data report published by the IFR in September 2024, 4,281,585 units are operating in factories across different nations, denoting an increase by 10%. In addition, yearly installations have readily exceeded, and in terms of region, 70% of overall newly integrated robots have been successfully installed in Asia, 10% in America, and 17% in Europe. Therefore, there is a huge requirement for a smooth electricity supply, due to which the market is continuously rising.
- Rise in the demand for uninterrupted power supply: The presence of critical industries, such as manufacturing, information technology, and healthcare demand continuous power, which is gradually uplifting the market internationally. For instance, as per an article published by the PIB Government in August 2025, India has successfully generated an outstanding 1,08,494 GWh of solar energy. In addition, the country’s overall solar capacity stood at 119,0 GW as of 2025, which comprises 90.9 GW from ground-based solar plants, 5.0 GW from off-grid solar installations, 3.0 GW from hybrid projects, and 19.8 GW from grid-specific rooftop systems, thereby making it suitable for proliferating the market’s exposure across different nations.
- Governmental standards and regulations: The availability of policies for mandating energy reliability and efficiency is increasingly pushing the power quality equipment market’s adoption internationally. As per an article published by the Government of Canada in August 2025, the global electricity demand is growing by almost 50%, based on which regulations in Canada are projected to diminish an estimated 181 megatons of cumulative greenhouse gas emissions between 2040 and 2050. Besides, over 80% of the country’s electricity derives from non-emitting and renewable sources, including wind, nuclear, hydro, and solar power. Moreover, a total of 58.4 TWh of electricity is generated in British Columbia, which is followed by 55.5 TWh in Alberta, thus denoting an optimistic outlook for the market’s development.
Challenges
- Increase in initial investment expenses: The presence of power quality equipment, such as UPS systems, harmonic filters, and static VAR compensators, requires generous upfront capital. Besides, for small and medium enterprises (SMEs), these expenses can be prohibitive, particularly when margins are thin. In addition, large-scale organizations and utilities tend to justify investments, owing to scale and regulatory compliance, while SMEs frequently cause delayed adoption, exposing themselves to risks of downtime and equipment damage. Therefore, this particular challenge is compounded by the fact that return on investment (ROI) is not always immediate, and benefits, such as diminished downtime, optimized efficiency, and compliance savings, accrue over time, thus causing a gap in the market’s growth.
- The absence of standardization and regulatory complexity: Standards in the power quality equipment market vary comprehensively across regions, developing compliance risks for manufacturers and end-users. For instance, IEEE standards dominate in North America, while IEC policies are increasingly prevalent in Europe and Asia. This particular fragmentation has pressured organizations to customize equipment for different markets, raising production expenses and complicating global supply chains. In addition, regulatory frameworks evolve rapidly since governments push for stringent energy efficiency and reliability mandates. Besides, manufacturers need to constantly adapt designs to meet the newest compliance requirements, which increases research and development expenses and slows product launches.
Power Quality Equipment Market Size and Forecast:
| Report Attribute | Details |
|---|---|
|
Base Year |
2025 |
|
Forecast Year |
2026-2035 |
|
CAGR |
7.1% |
|
Base Year Market Size (2025) |
USD 38.7 billion |
|
Forecast Year Market Size (2035) |
USD 71.7 billion |
|
Regional Scope |
|
Power Quality Equipment Market Segmentation:
Phase Segment Analysis
The three phase segment, which is part of the phase, is anticipated to garner the largest share of 68.5% in the market by the end of 2035. The segment’s upliftment is highly attributed to its prevalence originating from superior efficiency, balanced load distribution, and the significant ability to handle and administer high power densities, in comparison to single-phase systems. Besides, industrial and manufacturing facilities, data centers, and utility-scale operations heavily depend on three-phase architectures to successfully power motors, drives, and continuous-process equipment. In addition, voltage sags, harmonics, and transients are more pronounced in these environments, necessitating innovative mitigation solutions such as harmonic filters, static VAR compensators, and UPS systems, thereby making it suitable for uplifting the segment globally.
Installation Type Segment Analysis
Based on the installation type, the utility/primary distribution segment in the power quality equipment market is projected to account for the second-largest share during the forecast period. The segment’s growth is highly driven by the demand for stabilizing medium-voltage networks, integrating renewables, and ensuring dependable electricity supply across industrial and commercial grids. Additionally, utilities are witnessing an increase in challenges from distributed energy resources, electrification of transport, and rising peak demand, all of which have readily heightened risks of voltage sags, harmonics, and transients. Besides, power quality equipment, such as static VAR compensators, harmonic filters, and innovative monitoring systems, are significantly deployed at substations and feeders to maintain grid stability, denoting a positive impact for the market’s exposure globally.
Power Rating Segment Analysis
By the end of 2035, the >1 MVA systems sub-segment, which is part of the power rating segment, is expected to cater to the third-largest share in the market. The sub-segment’s development is highly propelled by its importance in carefully managing and handling the high apparent power of large-scale industrial infrastructures, substations, and transmission networks. This increased capacity is extremely crucial for protecting critical equipment from damage, ensuring system reliability, and managing significant power disturbances. According to a report published by the Ministry of Power in April 2024, the overall electricity generation constitutes renewable sources, catering to 1,739.0 BU against the 1,624.4 BU generated, which denotes a 7.0% growth in India between 2023 and 2024. Besides, the country is the largest synchronous grid, comprising 1,94,208 circuit km and 7,20,534 MVA of transformation capacity, thus suitable for boosting the overall segment.
Our in-depth analysis of the power quality equipment market includes the following segments:
|
Segment |
Subsegments |
|
Phase |
|
|
Installation Type |
|
|
Power Rating |
|
|
End use |
|
|
Power Issue Mitigated |
|
|
Equipment Type |
|

Vishnu Nair
Head - Global Business DevelopmentCustomize this report to your requirements — connect with our consultant for personalized insights and options.
Power Quality Equipment Market - Regional Analysis
APAC Market Insights
The Asia Pacific market is anticipated to garner the highest share of 37.5% by the end of 2035. The market’s upliftment in the region is highly attributed to growth in data centers across Southeast Asia, South Korea, Japan, India, and China, along with an increase in rapid urbanization. In addition, the comprehensive deployments of power electronics, mission-driven uptime demands in electronics and chemicals, and grid digitalization are also driving the market’s growth. According to an article published by the IEA Organization in September 2025, there has been an increase in the electricity demand in Southeast Asia by over 7% as of 2024, which is almost double the international average. Besides, with an approximate 20 TW of wind and solar potential, which is equivalent to nearly 55 times the overall region’s present power capacity is gradually strengthening.
China in the power quality equipment market is growing significantly, owing to the aspect of ongoing grid modernization, along with the outsized manufacturing, electronics, and chemical bases. As per an article published by the State Council Information Office in September 2025, the country constitutes the objective to gain an average yearly increase of more than 5% in the additional value of the chemical and petrochemical industries by the end of 2025. Besides, as per the February 2023 the State Council article, generous investment in chemical raw materials as well as product manufacturing surged to 19% year-over-year (YoY), denoting 7.4% points higher than the average level of all sectors. Additionally, this particular sector continuously improves in the trade structure, with organic chemical export reaching USD 80.7 billion, denoting a rise by 17% YoY basis, thus positively impacting the market’s growth in the country.
India in the market is also growing due to an upsurge in data center investments that have heightened power quality demands, aggressive renewable integration, as well as rapid grid expansion. According to an article published by the Ministry of Power in July 2025, POWERGRID’s transmission network spanned an estimated 1,80,239 ckm of extra high voltage (EHV) transmission line and constitutes 283 EHV, which has eventually boasted a transformation capacity of 5,64,961 MVA. Besides, the country’s government significantly holds a majority of stake, accounting for 51.3%, along with a turnover of ₹47,459 crore, ₹14,521 crore in net profit, and ₹2,90,715 crore in gross fixed assets. Furthermore, the organization consistently gained more than 99% network availability through the effective deployment of next-generation maintenance and operation techniques, thus boosting the market’s exposure.
Europe Market Insights
Europe in the power quality equipment market is expected to emerge as the fastest-growing region during the forecast period. The market’s development in the region is extremely driven by the digitalization of grids, stringent power quality compliance in process industries, and industrial electrification. According to an article published by the Europe Commission in 2024, the regional Green Deal has readily aimed to reduce emissions by almost 50% by the end of 2030, which is eventually rising to 55%, while legally catering to the 2050 neutrality objective through the domestic Climate Law. This has effectively pushed a clean shift that protects the overall population and planet and is socially fair and economically sound. Besides, this is possible through the €275 billion fund provision in clean investments, of which 42% of the fund is significantly dedicated to climate action, which is boosting the market in the region.
Germany in the power quality equipment market is gaining increased exposure due to the existence of environmental compliance that needs suitable power quality for controls, ventilation, and monitoring, stringent process safety, comprehensive deployment of power electronics, and expanded continuous-process industries. As per an article published by Fraynhofer in January 2025, the total net public electricity generation from renewable energy sources has successfully reached 62.7% as of 2024. In addition, solar power generation has also reached 72.2 terawatt hours in the same year, along with an expansion in photovoltaics, continuing to increase the federal government’s objectives. Besides, the country’s balanced and imported electricity also increased to 24.9 terawatt-hours, which is denoting an optimistic outlook for the overall market’s growth.
France in the power quality equipment market is also developing due to the electrification of industrial processes, the circular economy, and increased support by policy emphasis on efficiency. Besides, as stated in a data report published by the EIA Government in July 2025, there has been an increase in cross-border electricity deliveries by 48% as of 2024, from 70 TWh in 2023 to 103 TWh in 2024. In addition, the country’s overall electricity generation also upsurge by 45 TWh in the same year, while the total consumption remained effectively steady. Moreover, the nation’s nuclear power is considered a notable electricity source, accounting for almost 65% of the overall electricity production, and the country presently operates 57 nuclear reactors. Therefore, this increased focus on electricity, which is possible through continuous supply, is readily uplifting the market in the country as well as the overall Europe region.
2023 Electricity Export and Import in Europe-Based Countries
|
Countries |
Export (USD) |
Import (USD) |
|
France |
9.2 billion |
3.1 billion |
|
Germany |
6.2 billion |
8.1 billion |
|
Switzerland |
4.9 billion |
4 billion |
|
Austria |
3.5 billion |
2.3 billion |
|
Spain |
2.8 billion |
1.4 billion |
|
Norway |
2.7 billion |
715 million |
|
Netherlands |
2.6 billion |
2 billion |
|
Sweden |
2.6 billion |
541 million |
Source: OEC
North America Market Insights
North America market is projected to witness considerable growth by the end of the stipulated timeline. The market’s growth in the region is highly propelled by the presence of continuous-process sectors, data centers, and an increase in the penetration of automation. Besides, according to a data report published by the CISA Government in February 2023, there are 11,128 chemical manufacturing facilities in the U.S., with Texas regarded as the topmost exporter of chemicals, readily accounting for 30% of overall chemical exports. Meanwhile, 68% of chemical manufacturing infrastructure is significantly owned and also operated by small and medium enterprises, employing more than 500 people. Moreover, California, Ohio, and Pennsylvania are other states with a massive concentration of facilities, which is positively creating an impact in the market’s growth.
The market in the U.S. is gaining increasing traction, owing to the aspect of the critical infrastructure role, safety compliance, production trends, chemical industry strategies, government spending, and security and infrastructure guidance. As stated in an article published by the ASC Organization in February 2023, chemical producers in the country significantly grew by 3.9% as of 2022, while the chemical output accounted for 12% as of 2023. In addition, the chemical sector employment surged gradually, with an increase in payrolls by over 15,000 workers in 2022. As a result, chemical workers are continuing to emerge as the highest paid in the overall manufacturing industry, amounting to over USD 90,000. Moreover, the chemical industry capital expenditure also upsurged by 9%, amounting to USD 33.5 billion, thereby proliferating the market’s expansion.
The power quality equipment market in Canada is also growing due to industrial automation and modernization, the presence of energy efficiency mandates, an increase in renewable energy integration, governmental spending and sustainability programs, as well as digitalized infrastructure and data centers. As per an article published by the Government of Canada in August 2025, the country’s clean energy gross domestic product (GDP) is expected to reach USD 107 billion, which is readily driven by USD 58 billion in yearly investments by the end of 2030 and over 600,000 employment opportunities. Moreover, for the upcoming 5 years, the country’s transition to a low-carbon economy by the end of 2050 is expected to reach almost 10,000 newest job openings. In addition, the population is more focused on clean electrification, based on which 84% of households is expected to low energy expenses by the end of 2035.
Key Power Quality Equipment Market Players:
- ABB Ltd. (Switzerland)
- Company Overview
- Business Strategy
- Key Product Offerings
- Financial Performance
- Key Performance Indicators
- Risk Analysis
- Recent Development
- Regional Presence
- SWOT Analysis
- Siemens AG (Germany)
- Schneider Electric SE (France)
- Eaton Corporation (U.S.)
- General Electric Company (U.S.)
- Emerson Electric Co. (U.S.)
- Honeywell International Inc. (U.S.)
- Toshiba Corporation (Japan)
- Mitsubishi Electric Corporation (Japan)
- Fuji Electric Co., Ltd. (Japan)
- Hyundai Electric & Energy Systems Co., Ltd. (South Korea)
- LS Electric Co., Ltd. (South Korea)
- Hitachi, Ltd. (Japan)
- Crompton Greaves Power and Industrial Solutions Limited (India)
- Kirloskar Electric Company Limited (India)
- Wilson Transformer Company (Australia)
- NHP Electrical Engineering Products Pty Ltd (Australia)
- Tenaga Nasional Berhad (Malaysia)
- Meiden Singapore Pte Ltd (Singapore)
- Hyosung Heavy Industries Corporation (South Korea)
- ABB has effectively created modular marine energy storage systems, which are readily designed for hybrid and fully electric vessels. Its solutions integrate batteries with diesel, gas, or fuel cells, enabling peak shaving, emergency backup, and diminished emissions for ferries and offshore ships. The organization’s marine battery systems are comprehensively adopted in Europe’s electrification of short-sea shipping.
- Siemens AG offers marine electrification solutions that include battery integration for hybrid propulsion and auxiliary systems. The company’s focus is on decarbonization and digitalization, supporting commercial vessels, naval ships, and submarines with advanced electrical and battery technologies. Siemens’ marine battery initiatives align with Europe-driven emission reduction targets.
- Schneider Electric SE provides EcoStruxure Marine solutions by integrating battery storage to improve vessel efficiency and lifecycle management. The organization’s systems emphasize sustainability, safe operations, and reduced emissions in line with IMO regulations. Schneider’s marine battery technologies are positioned to support energy savings and compliance in global shipping.
- Eaton Corporation effectively contributes to the market through power management and energy storage integration. Its solutions focus on reliability, safety, and efficiency in hybrid-electric vessels, supporting defense and commercial applications. Eaton’s marine battery systems are designed to optimize energy use and extend operational endurance.
- General Electric Company is proactive in the battery adoption, especially for defense and large commercial vessels. Its battery initiatives emphasize lithium-ion and hybrid propulsion systems to reduce fuel consumption and emissions. GE’s marine battery technologies are aligned with global sustainability goals and naval modernization programs.
Here is a list of key players operating in the global market:
The international power quality equipment market is significantly competitive, with the presence of multinational corporations such as ABB, Siemens, Schneider Electric, Eaton, and Mitsubishi Electric readily dominating through scale, innovation, and global distribution networks. Meanwhile, tactical strategies include digitalization of power systems, integration of IoT-enabled monitoring solutions, and expansion into renewable energy and smart grid projects. Asia-based organizations, such as Crompton Greaves, LS Electric, and Toshiba, are significantly strengthening their positions through government-driven industrial programs and regional manufacturing centers. Besides, in December 2025, Mitsubishi Electric Corporation declared that it has successfully created a physics-based AI that can tend to accurately estimate equipment degradation by utilizing minimal training data. Based on this technology, the company’s Neuro-Physical AI strategy has emphasized safety and dependency in the physical world, thereby making it suitable for the market globally.
Corporate Landscape of the Power Quality Equipment Market:
Recent Developments
- In December 2025, Toshiba Corporation, Vanguard Industries Inc., and Kyowa Shipping Co., Ltd., together established a newest organization- Radiant Technologies Inc. for offering an energy sharing service that can deliver electricity to unelectrified locations.
- In December 2025, John Crane has deliberately signed a major Global Framework Agreement (GFA) with a large-scale international energy organization for focusing on optimizing equipment dependency, addressing severe risks in seal management, and standardizing performance across international operations.
- Report ID: 8315
- Published Date: Dec 12, 2025
- Report Format: PDF, PPT
- Explore a preview of key market trends and insights
- Review sample data tables and segment breakdowns
- Experience the quality of our visual data representations
- Evaluate our report structure and research methodology
- Get a glimpse of competitive landscape analysis
- Understand how regional forecasts are presented
- Assess the depth of company profiling and benchmarking
- Preview how actionable insights can support your strategy
Explore real data and analysis
Frequently Asked Questions (FAQ)
Power Quality Equipment Market Report Scope
Free Sample includes current and historical market size, growth trends, regional charts & tables, company profiles, segment-wise forecasts, and more.
Connect with our Expert


Copyright @ 2026 Research Nester. All Rights Reserved.
