Pelletized Activated Carbon Market Outlook:
Pelletized Activated Carbon Market size was over USD 5.9 billion in 2025 and is projected to reach USD 10.47 billion by 2035, witnessing around 5.9% CAGR during the forecast period i.e., between 2026-2035. In the year 2026, the industry size of pelletized activated carbon is evaluated at USD 6.21 billion.
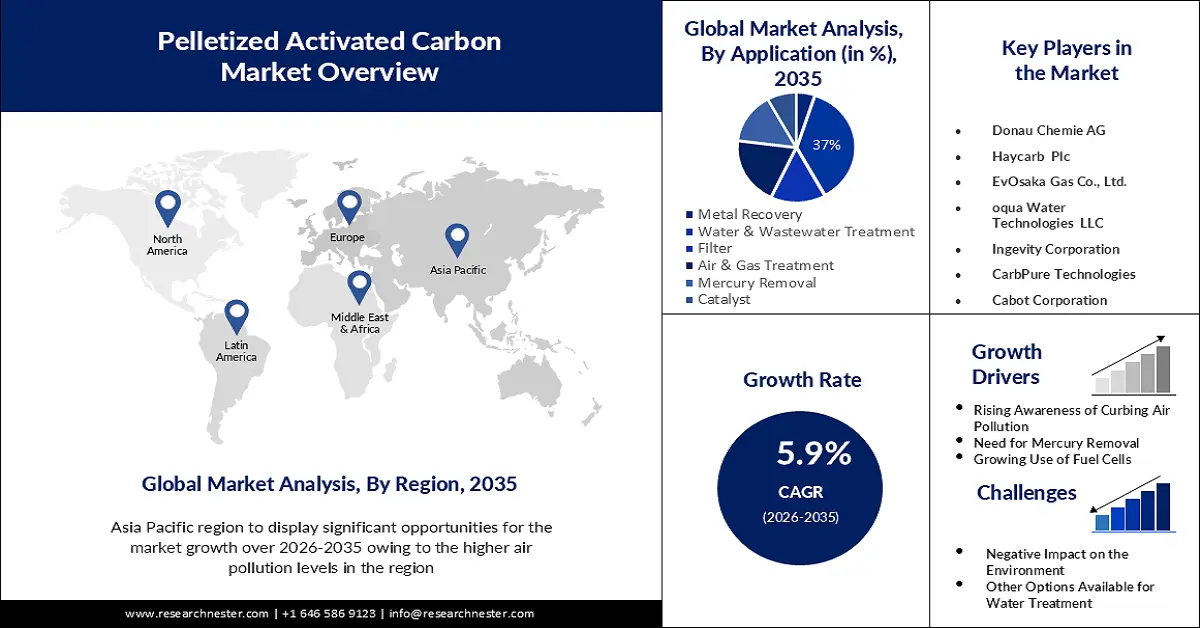
The market growth is mainly driven by growing levels of air pollution. Despite advances in some locations, global urban air pollution levels climbed by 8%, according to the World Health Organization. Low- and middle-income nations in WHO's Eastern Mediterranean and South-East Asia Regions have the greatest levels of urban air pollution, with annual mean levels frequently exceeding 5-10 times WHO standards. Pelletized activated carbon is a versatile material widely used for controlling air pollution due to its exceptional adsorption properties.
Besides this, growing initiatives from government and regulatory bodies have a positive impact on the pelletized activated carbon market. These programs often involve the installation of air purification systems and filters in industrial facilities, vehicles, and power plants. These all are usually equipped with activated carbon filters for absorbing air pollutants.
Key Pelletized Activated Carbon Market Insights Summary:
Regional Highlights:
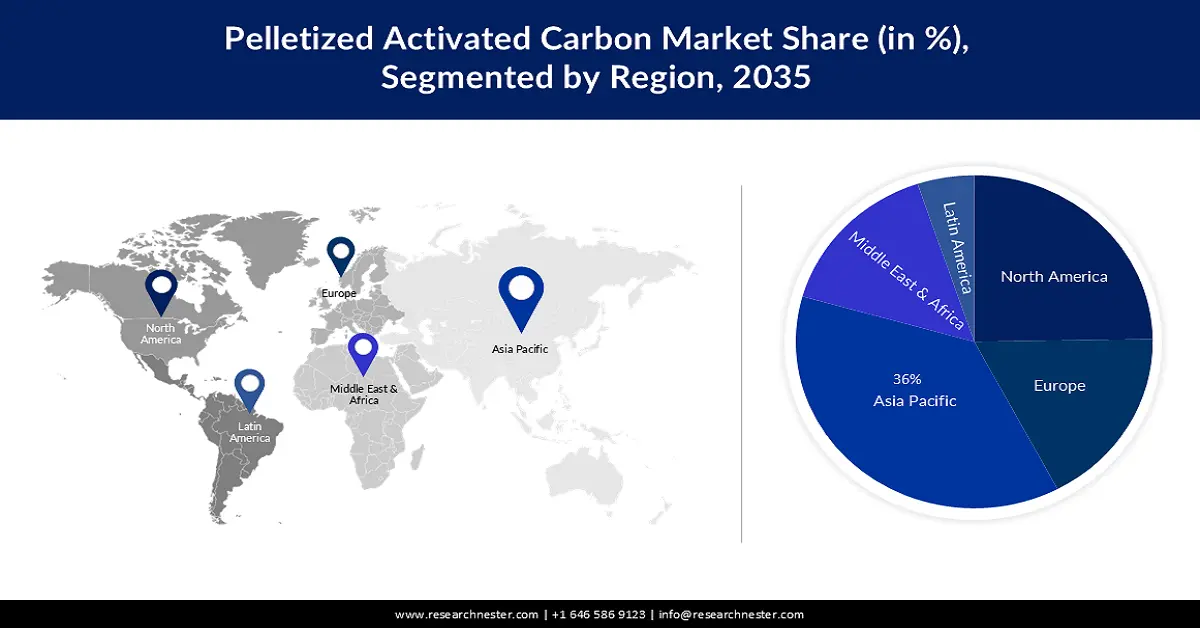
- By 2035, Asia Pacific is set to command a 36% share in the pelletized activated carbon market over 2026-2035, attributable to rising air pollution in the region and government initiatives to control air pollution.
- By 2035, North America is anticipated to secure around a 24% share, supported by escalating practices of water and wastewater treatment.
Segment Insights:
- By 2035, the water & wastewater segment in the pelletized activated carbon market is projected to capture a 37% share across 2026-2035, bolstered by shortage of fresh drinking water and the growing need for treating unhealthy water.
- By 2035, the automotive segment is expected to account for roughly a 40% share, sustained by higher emission of polluted chemicals from the transportation sectors.
Key Growth Trends:
- Increasing Expansion of Industrialization
- Growing Initiatives for Mercury Removal
Major Challenges:
- Concerns Associated with Safe Disposal and Regeneration
- Limitation in Adsorption Capacity
Key Players: Kuraray Co. Ltd., Donau Chemie AG, Haycarb Plc, Jacobi Carbons GmbH, Kureha Corporation, Osaka Gas Co., Ltd., Evoqua Water Technologies LLC, Ingevity Corporation, CarbPure Technologies, Cabot Corporation.
Global Pelletized Activated Carbon Market Forecast and Regional Outlook:
Market Size & Growth Projections:
- 2025 Market Size: USD 5.9 billion
- 2026 Market Size: USD 6.21 billion
- Projected Market Size: USD 10.47 billion by 2035
- Growth Forecasts: 5.9%
Key Regional Dynamics:
- Largest Region: Asia Pacific (36% Share by 2035)
- Fastest Growing Region: Asia Pacific
- Dominating Countries: United States, China, Germany, Japan, South Korea
- Emerging Countries: India, Brazil, Indonesia, Mexico, Turkey
Last updated on : 25 November, 2025
Pelletized Activated Carbon Market - Growth Drivers and Challenges
Growth Drivers
- Increasing Expansion of Industrialization– In 2021, global industrial output increased by 7.2%, approaching pre-pandemic levels. The worldwide manufacturing value-added proportion of total GDP grew from 16.2% in 2015 to 16.9% in 2021. Industrialization significantly contributes to the generation of air pollutants, industries such as chemical manufacturing, petroleum refining, power generation, and waste treatment facilities require effective solutions to control emissions.
- Growing Initiatives for Mercury Removal– The Clean Air Mercury Rule was based on the EPA's Clean Air Interstate Rule (CAIR) to significantly lower emissions from coal-fired power plants in the United States. The purpose of these mercury standards was to bring down utility mercury emissions from 48 tonnes per year to 15 tonnes, an improvement of roughly 70%. Pelletized activated carbon has a high surface area, porosity, and adsorption capabilities. Owing to all these properties, they attract and hold mercury onto their surface.
- Rising Use of Fuel Cell Technology– Amazon used more than 15,000 fuel cells to power 70 of its campuses as of 2022. As of January 2022, Walmart operated 10,000 fuel cell at 41 hydrogen fuel sites spread throughout distribution centers. By purifying the fuel and oxidant, the carbon pellets help enhance the efficiency and longevity of the fuel cell.
Challenges
- Concerns Associated with Safe Disposal and Regeneration- After reaching its adsorption capacity, pelletized activated carbon need to be replaced or regenerated. Proper disposal of spent carbon can be challenging, as it may contain adsorbed contaminants that need to be handled and disposed of properly to avoid environmental impact. Regeneration of spent carbon can also be a complex and energy-intensive process, requiring specialized facilities and expertise.
- Limitation in Adsorption Capacity
- Challenge from an Alternative Technology
Pelletized Activated Carbon Market Size and Forecast:
| Report Attribute | Details |
|---|---|
|
Base Year |
2025 |
|
Forecast Year |
2026-2035 |
|
CAGR |
5.9% |
|
Base Year Market Size (2025) |
USD 5.9 billion |
|
Forecast Year Market Size (2035) |
USD 10.47 billion |
|
Regional Scope |
|
Pelletized Activated Carbon Market Segmentation:
Application Segment Analysis
The water & wastewater segment is slated to account for 37% share of the global pelletized activated carbon market in 2035. Moreover, it will show tremendous growth at a significant CAGR over the projected period. Shortage of fresh drinking water and the growing need for treating unhealthy water is expected to augment the segment’s growth. In 2020, 56% of home wastewater flows were properly treated globally. Furthermore, by 2030, the global state of wastewater treatment and acceleration must reach target 6.3. Moreover, 2 billion people do not have clean drinking water at home. Around 1 1.2 billion of them lack a reliable supply of safe drinking water. Rural areas are home to eight out of ten people who continue to lack access to safe drinking water. Activated carbon can remove unpleasant odors and tastes from water caused by chemicals, chlorine, algae, or their organic matter. The carbon pellets adsorb and trap these compounds, resulting in cleaner and better-tasting water.
End User Segment Analysis
In the year 2035, the automotive segment in the pelletized activated carbon market is predicted to have a major share of roughly 40%. Higher emission of polluted chemicals from the transportation sectors is the primary driving factor for the segment’s growth. Transportation GHG emissions account for approximately 29 percent of total U.S. GHG emissions, making it the greatest contributor to air pollution. Activated carbon pellets can be integrated into the emissions control systems of automobiles. They are utilized in canister filters to trap and absorb fuel vapors emitted from the fuel tank, preventing them from being released into the atmosphere and contributing to pollution.
Our in-depth analysis of the global pelletized activated carbon market includes the following segments:
|
Type |
|
|
Application |
|
|
End User |
|

Vishnu Nair
Head - Global Business DevelopmentCustomize this report to your requirements — connect with our consultant for personalized insights and options.
Pelletized Activated Carbon Market - Regional Analysis
APAC Market Insights
Asia Pacific industry is set to dominate majority revenue share of 36% by 2035. The growth of the market can be attributed majorly to the rising air pollution in the region, followed by government initiatives to control air pollution. India is one of the most polluted countries in the world, with 21 of the world's 30 cities having the worst air pollution. The capital, New Delhi, has the worst air quality of any capital city in the world. Particulate matter (PM2.5) levels in New Delhi are nearly ten folds higher than the standards fixed by WHO. Furthermore, India has launched an aggressive National Clean Air Programme to reduce airborne particulate matter by around 30% by the end of 2024.
North American Market Insights
The pelletized activated carbon market in North America is expected to hold a significant market share of around 24% by the end of 2035. The growth of the market can be attributed to rising practices of water and wastewater treatment. More than 238 million people are served by an estimated 14,748 publicly owned treatment works (POTWs) for wastewater collection, treatment, and disposal. Moreover, California recycled more than 1.5 million acre-feet per year by 2020, with lofty targets of increasing water recycling to 2.5 million acre-feet per year by 2030.
Pelletized Activated Carbon Market Players:
- Kuraray Co. Ltd.
- Company Overview
- Business Strategy
- Key Product Offerings
- Financial Performance
- Key Performance Indicators
- Risk Analysis
- Recent Development
- Regional Presence
- SWOT Analysis
- Donau Chemie AG
- Haycarb Plc
- Jacobi Carbons GmbH
- Kureha Corporation
- Osaka Gas Co., Ltd.
- Evoqua Water Technologies LLC
- Ingevity Corporation
- CarbPure Technologies
- Cabot Corporation
Recent Developments
- Ingevity Corporation announced the expansion of its activated carbon capacity in its facility located in Zhuhai, China. The plant renovations successfully increased capacity by 15% to 20%, allowing Ingevity to meet the demands from the worldwide market for its premium, high-capacity pelletized carbon products.
- Evoqua Water Technologies announced the acquisition of industrial wastewater treatment in Texas, which was formerly controlled by Bob Johnson & Associated from Kemco Systems. This acquisition will strengthen the expansion of Evoqua’s water treatment solution in the Texas market.
- Report ID: 5093
- Published Date: Nov 25, 2025
- Report Format: PDF, PPT
- Explore a preview of key market trends and insights
- Review sample data tables and segment breakdowns
- Experience the quality of our visual data representations
- Evaluate our report structure and research methodology
- Get a glimpse of competitive landscape analysis
- Understand how regional forecasts are presented
- Assess the depth of company profiling and benchmarking
- Preview how actionable insights can support your strategy
Explore real data and analysis
Frequently Asked Questions (FAQ)
About this Report
Connect with our Expert

Report, 2026-2035


Copyright @ 2026 Research Nester. All Rights Reserved.
