Oilfield Production Chemicals Market Outlook:
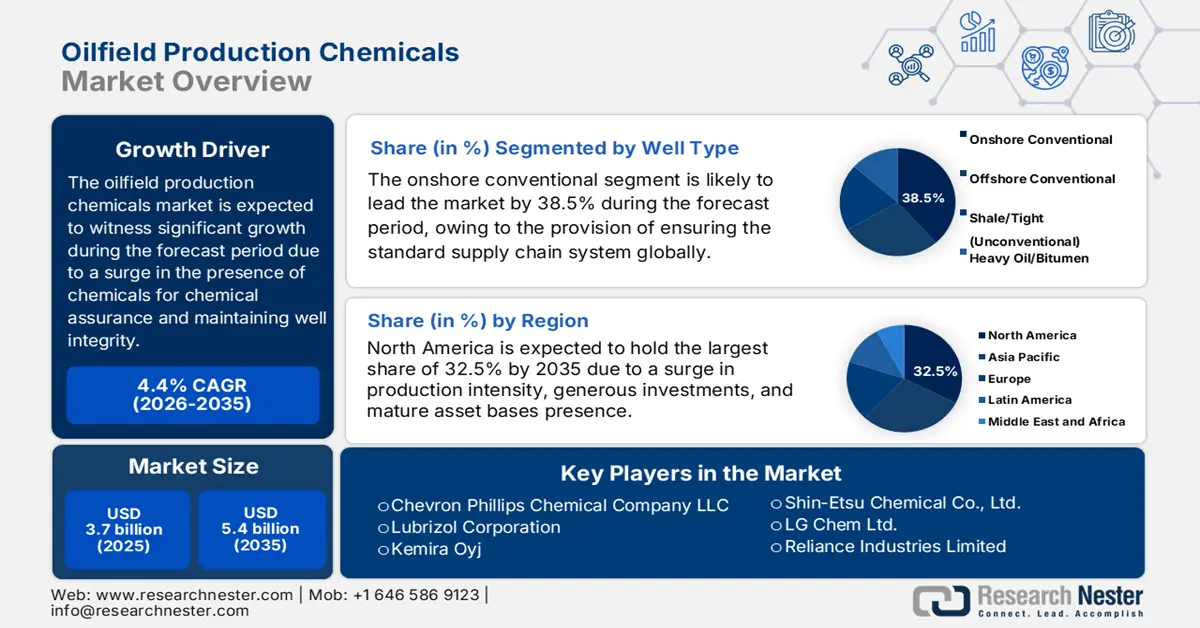
Oilfield Production Chemicals Market size was over USD 3.7 billion in 2025 and is estimated to reach USD 5.4 billion by the end of 2035, expanding at a CAGR of 4.4% during the forecast timeline, i.e., 2026-2035. In 2026, the industry size of oilfield production chemicals is evaluated at USD 3.8 billion.
The worldwide market is continuously growing, with the presence of chemicals such as biocides, scale inhibitors, demulsifiers, and corrosion inhibitors. These are extremely critical for maintaining well integrity, ensuring compliance with environmental standards, and optimizing production. Besides, according to an article published by the UPCCCE Organization in April 2024, globally, air pollution has caused more than 6.5 million deaths every year, eventually leading to climate change, acid rain, reduced visibility, impaired brain function, and chronic diseases. However, to combat this, continuous emission monitoring systems (CEMS) are successfully adopted, particularly in China, which has readily aimed to diminish major pollutant emissions by 10% to 25%. Besides, Online Continuous Emissions Monitoring Systems (OCEMS) installation based on the Central Pollution Control Board (CPCB) is also driving the market’s growth.
OCEMS Installation Status Across CPCB’s Top 8 Industrial Categories (2024)
|
Industry Type |
Overall Units Targeted |
Units Installed and Connected |
Units with Closure Directions |
|
Aluminum |
14 |
12 |
2 |
|
Cement |
394 |
301 |
93 |
|
Chloralkali |
33 |
33 |
0 |
|
Copper |
3 |
3 |
0 |
|
Distillery |
366 |
285 |
81 |
|
Dye & Dye |
122 |
96 |
26 |
|
Fertilizer |
117 |
96 |
21 |
|
Iron and Steel |
424 |
358 |
66 |
Source: UPCCCE
Furthermore, green chemistry, sustainability, digitalization and smart monitoring, enhancements in oil recovery chemicals, and regional diversification are certain factors that are also uplifting the oilfield production chemicals market growth globally. According to an article published by Cleaner Engineering and Technology in February 2022, internationally, the annual plastic manufacturing has increased by 3.5 million tons, and is projected to gradually rise by 26 billion tons by the end of 2050. Besides, the expanded utilization of plastic will readily cater to 20% of international oil consumption by the end of 2050. Moreover, the biodegradable plastics field is predicted to increase from USD 3.0 billion to USD 6.1 billion, along with a 15.1% growth rate. Likewise, the industry for plastic packaging products has successfully reached 300 million tons every year, while the biodegradable plastic constitutes a manufacturing capacity of an estimated 2.5 million tons every year, thereby fueling the market’s demand.
Key Oilfield Production Chemicals Market Insights Summary:
Regional Highlights:
- By 2035, North America is anticipated to command a 32.5% share of the market as it strengthens, supported by heightened production intensity, sustained flow-assurance investments, and a mature asset base.
- By 2035, Europe is projected to be the fastest-growing region in the oilfield production chemicals market, expanding as a result of stringent safety norms, environmental compliance requirements, and rising offshore flow-assurance needs.
Segment Insights:
- By 2035, the onshore conventional segment is projected to secure a 38.5% share in the oilfield production chemicals market as it rises, stimulated by its cost-efficient hydrocarbon accessibility and well-established operational infrastructure.
- By 2035, the production operations sub-segment is set to capture the second-largest share as it evolves, fueled by the growing application of chemicals to maintain well integrity, optimize flow, and ensure environmental compliance.
Key Growth Trends:
- Increase in the global energy demand
- A surge in technological innovation
Major Challenges:
- Environmental regulations and compliance expenses
- Increased volatility in oil prices and demand cycles
Key Players: BASF SE (Germany), Dow Inc. (U.S.), Nalco Champion, An Ecolab Company (U.S.), Solvay SA (Belgium), Clariant AG (Switzerland), Albemarle Corporation (U.S.), Ashland Global Holdings Inc. (U.S.), Croda International Plc (U.K.), Innospec Inc. (U.S.), Chevron Phillips Chemical Company LLC (U.S.), Lubrizol Corporation (U.S.), Kemira Oyj (Finland), Nouryon Chemicals Holding B.V. (Netherlands), CES Energy Solutions Corp. (Canada), Shin-Etsu Chemical Co., Ltd. (Japan), LG Chem Ltd. (South Korea), Reliance Industries Limited (India), ONGC Petro Additions Limited (OPaL) (India), Petronas Chemicals Group Berhad (Malaysia), Orica Limited (Australia).
Global Oilfield Production Chemicals Market Forecast and Regional Outlook:
Market Size & Growth Projections:
- 2025 Market Size: USD 3.7 billion
- 2026 Market Size: USD 3.8 billion
- Projected Market Size: USD 5.4 billion by 2035
- Growth Forecasts: 4.4% CAGR (2026-2035)
Key Regional Dynamics:
- Largest Region: North America (32.5% Share by 2035)
- Fastest Growing Region: Europe
- Dominating Countries: United States, China, Saudi Arabia, Canada, United Kingdom
- Emerging Countries: India, Brazil, United Arab Emirates, Norway, Australia
Last updated on : 12 December, 2025
Oilfield Production Chemicals Market - Growth Drivers and Challenges
Growth Drivers
- Increase in the global energy demand: There has been an increase in the renewable energy growth, and despite this the oil and gas have emerged as the most essential, which is readily driving the market. According to a data report published by the IEA Organization in July 2023, the process energy for oil accounts for 0.09 EJ/year as of 2022, which is projected to be 0.06 EJ/year by the end of 2022. Likewise, in the case of gas, it is 4.9 EJ/year in 2022 and 4.7 EJ/year, which is positively impacting the overall market’s demand. Besides, the direct carbon dioxide emissions from primary chemical production in the net-zero target constitutes to 255.2 mt per year in 2022 and 248.4 mt to be achieved by the end of 2030 for high-value chemicals, thereby making it suitable for boosting the market.
- A surge in technological innovation: The effective development of smart polymers and nanotechnology-driven inhibitors has readily enhanced efficiency, which is driving the oilfield production chemicals market globally. According to an article published by NLM in March 2023, the development of PMHS-dispersion Al–Mg–Si alloy nanocomposites is possible by utilizing the foot silk protein (FSP) technology, which led to a 67.2% reduction in wear volume loss as well as optimizing delamination resistance and wear resistance. Besides, the intelligent polymer shape-memory polymer (IPSMP) is a specialized polymer material, which can easily recover deformation by almost 10% to 50%, and even to 800%, thus gradually emerging as the research focus on intelligent polymer plugging materials, which is further suitable for fueling the market’s growth.
- Focus on operational efficiency: The presence of chemicals readily assists in diminishing equipment failures, corrosion expenses, and downtime, thereby increasing savings, which eventually proliferates the market. Besides, as stated in an article published by the Association for Materials Protection and Performance (AMPP) Organization in April 2022, the regulatory body, along with the Europe-based Federation of Corrosion (EFC) and the World Corrosion Organization (WCO), is effectively catering to the corrosion risk, which costs the international economy over USD 2.5 trillion every year. Meanwhile, energy infrastructure, naval fleets, and military vehicles are continuously threatened by corrosion due to which the U.S. Department of Energy has spend USD 20 billion on corrosion-based expenses.
Challenges
- Environmental regulations and compliance expenses: This is one of the most significant challenges for the oilfield production chemicals market, which has seen increasingly tightened environmental regulations across major producing regions. Besides, agencies such as the U.S. Environmental Protection Agency (EPA) and the Europe-based Chemicals Agency (ECHA) have enforced stringent rules on chemical toxicity, waste disposal, and emissions. These particular regulations demand organizations to generously invest heavily in developing eco-friendly, biodegradable formulations that meet compliance standards. While this transition effectively supports sustainability, it increases research and development expenses and reduces product commercialization. For instance, restrictions and limitations on hazardous biocides and demulsifiers force operators to redesign formulations, thus negatively impacting the market.
- Increased volatility in oil prices and demand cycles: The market is increasingly sensitive to fluctuations in international oil prices. When crude oil prices fall, exploration and production (E&P) organizations reduce drilling and enhanced oil recovery (EOR) projects, directly diminishing the need for production chemicals such as corrosion inhibitors, demulsifiers, and scale inhibitors. For instance, the majority of operators deferred chemical-intensive EOR programs, resulting to a sharp decline in chemical consumption. This volatility has developed an uncertainty for manufacturers to readily balance production capacity with unpredictable demand cycles. Moreover, geopolitical tensions, OPEC-driven decisions, and international energy transitions toward renewables further amplify market instability.
Oilfield Production Chemicals Market Size and Forecast:
| Report Attribute | Details |
|---|---|
|
Base Year |
2025 |
|
Forecast Year |
2026-2035 |
|
CAGR |
4.4% |
|
Base Year Market Size (2025) |
USD 3.7 billion |
|
Forecast Year Market Size (2035) |
USD 5.4 billion |
|
Regional Scope |
|
Oilfield Production Chemicals Market Segmentation:
Well Type Segment Analysis
The onshore conventional segment, part of the well type, is anticipated to account for the highest share of 38.5% in the market by the end of 2035. The segment’s upliftment is primarily attributed to its importance in the international energy supply since it offers low-cost, accessible, and significant hydrocarbon resources in comparison to other methods. In addition, its importance also originates from its economic visibility, operational flexibility, and established infrastructure. According to a data report published by the DGH India in May 2023, India caters to 29.2 MMT of crude oil production, along with 34.5 BCM natural gas production. Besides, the country comprises 11 hydrocarbon discoveries, with 624 drilled wells that include 111 exploratory or appraisal wells and 513 development wells, thereby making it suitable for bolstering the segment’s exposure internationally.
Application Segment Analysis
By the end of 2035, the production operations sub-segment, which is part of the application segment, is projected to cater to the second-highest share in the oilfield production chemicals market. The sub-segment’s growth is highly driven by the utilization of chemicals to significantly maintain well integrity, optimize hydrocarbon flow, and ensure compliance with environmental regulations, especially during the production phase of oil and gas extraction. Besides, the existence of chemicals such as demulsifiers, biocides, scale inhibitors, and corrosion inhibitors is deployed to address challenges, including emulsion breaking, microbial contamination, scaling, and equipment degradation. Moreover, an increase in the complexity of reservoirs, particularly unconventional resources, such as shale and heavy oil, has significantly amplified the demand for tailored chemical programs that can withstand severe operating conditions.
Corrosion Segment Analysis
Based on corrosion, the corrosion and scale inhibition segment is expected to constitute the third-highest share in the market during the forecast period. The segment’s development is extremely fueled by its importance for protecting pipelines, downhole tubulars, and surface equipment from degradation that are caused by critical reservoir conditions, including high levels of hydrogen sulfide, carbon dioxide, and saline water. On the other hand, scale inhibitors significantly prevent the deposition of mineral scales such as calcium carbonate and barium sulfate, which can readily block flowlines and reduce production efficiency. Therefore, together these chemicals safeguard infrastructure, reduce downtime, and diminish expensive maintenance interventions. Moreover, the demand for innovative formulations is increasing, especially in offshore and deep-water operations, wherein severe pressures and temperatures challenge traditional chemistries.
Our in-depth analysis of the oilfield production chemicals market includes the following segments:
|
Segment |
Subsegments |
|
Well Type |
|
|
Application |
|
|
Corrosion |
|
|
Product Type |
|
|
Lifecycle Stage |
|
|
Fluid System |
|

Vishnu Nair
Head - Global Business DevelopmentCustomize this report to your requirements — connect with our consultant for personalized insights and options.
Oilfield Production Chemicals Market - Regional Analysis
North America Market Insights
North America market is anticipated to garner the largest share of 32.5% by the end of 2035. The market’s upliftment in the region is highly driven by an increase in the production intensity in the U.S. and Canada, sustained investments in flow assurance, and the presence of mature asset bases. According to a data report published by the CISA Government in February 2023, the chemical industry in the U.S. readily converts raw materials into over 70,000 diversified products, which are crucial to modernized life and are significantly distributed these products to over 750,000 end users throughout the nation. In addition, 100,000 chemical facilities in the country range from chemical distributors to petrochemical manufacturers, utilizing, manufacturing, transporting, storing, and delivering chemicals along with an international and complicated supply chain system.
The U.S. in the oilfield production chemicals market is growing significantly, owing to an increase in production intensity, safety and compliance, along with the existence of government expenditure and programs. As per an article published by the EIA Government in December 2025, the oil production in the country, comprising crude oil and lease condensate, has averaged 13.3 million barrels per day, while the natural gas production has also averaged 128.0 billion cubic feet per day. Besides, both natural gas and oil productions have increased as of 2024, with oil production averaging 13.4 million b/d, along with natural gas production also averaging 128.8 bcf/d. Based on these productions, the chemical sector in the country readily employs 529,000 people, and this has created employment opportunities across different industries, which is proliferating the market’s growth.
Chemical Industry Growth’s Impact on the U.S. (2023)
|
Components |
Valuation |
|
Chemical Industry Worth |
USD 486 billion |
|
Growth in total GDP |
25% |
|
Goods Manufactured Utilizing Chemical Industry Products |
96% |
|
Global Chemicals Supply |
13% |
|
Job Created by Chemical Businesses |
6.8 jobs, which is 4.1 million |
|
Overall Chemical Export |
USD 125.3 billion |
|
Chemical and Related Products |
10 cents of every USD 1 of exports |
Source: CISA Government
Canada market is also growing due to a surge in non-traditional oil and gas activity, stringent environmental regulations, technological advancements in enhanced oil recovery, and governmental funding for sustainable chemical processes and clean energy. As per an article published by the Government of Canada in May 2024, of the USD 22.6 billion spent on in-house research and development by sector in the country, which is 7.5%, amounting to USD 1.7 billion for clean energy. Besides, fossil fuels made up the highest energy share at almost 32%. Meanwhile, the upsurge in spending on non-fossil fuel research and development is partially owing to increased funding from the federal government, based on which USD 138 million has been generously funded. Therefore, with such investments for research and development, the market is continuously growing in the overall country.
Europe Market Insights
Europe in the oilfield production chemicals market is projected to emerge as the fastest-growing region by the end of the stipulated period. The market’s development in the region is propelled by stringent safety and environmental standards, along with flow assurance demands in offshore basins, shaping product selection. According to an article published by the Europe Commission in 2024, the regional Green Deal strategy has aimed to reduce emissions by nearly 50% by the end of 2030, gradually rising to 55%, while legally taking into consideration the 2050 neutrality objective through the Europe Climate Law. Besides, €275 billion has been generously allocated in clean investments, while 42% of funds are readily dedicated to climate action. In addition, the Just Transition Fund has deliberately allocated almost €20 billion for investing in diverse economies, which is suitable for uplifting the market.
The UK in the market is gaining increased traction, owing to strict adherence to REACH-driven standards post-BREXIT, life-extension programs for mature North Sea assets, and anchored offshore production intensity in the UK Continental Shelf. Besides, as per an article published by the UK Government in December 2022, 99.8% of the generated load from wastewater treatment operations in England has been compliant with the Urban Waste Water Treatment Regulations. In addition, there have been 1,442 agglomerations generating over 2,000 population equivalent (PE) of wastewater. This includes 1,430 agglomerations generating 59,948,276 PE of wastewater that complies with regulations demand, while 12 agglomerations generated 98,190 PE of wastewater, not complying with regulations. Therefore, owing to all these provisions, there is a huge growth opportunity for the market in the overall country.
Norway's presence in the oilfield production chemicals market is also developing due to an increase in the adoption of innovative and REACH-based sustainable chemistries for flow integrity and assurance, the presence of strict environmental standards, and support from ongoing offshore developments. As stated in the 2024 CEFIC Organization article, the nation’s chemical and oil refining sector generated sales of NOK 175 billion, of which NOK 145 billion was attributed to exports, representing 83%. The sector readily employed 13,800 full-time equivalents and effectively generated NOK 454 billion of additional value. Besides, as per the June 2025 OECD Organization article, the country comprises a small population of 5.4 million people, and almost 80% reside in urban areas within less than 10 km from the sea. Besides, it has effectively decoupled greenhouse gas emissions, lower than 10% from previous years. Moreover, the aspect of continuous investments for creating a sustainable maritime sector is also fueling the market’s growth in the country, based on an increase in the gross domestic product.
Gross Domestic Product (GDP) Per Person Rise in Norway (2014-2024)
|
Years |
USD Per Person |
|
2014 |
66,121.8 |
|
2015 |
66,670.2 |
|
2016 |
66,851.5 |
|
2017 |
67,968.6 |
|
2018 |
68,081.2 |
|
2019 |
68,383.0 |
|
2020 |
67,113.1 |
|
2021 |
69,364.7 |
|
2022 |
71,118.4 |
|
2023 |
70,000.0 |
|
2024 |
71,455.9 |
Source: OECD
APAC Market Insights
The Asia Pacific in the oilfield production chemicals market is projected to witness considerable growth by the end of the stipulated timeline. The market’s growth in the region is highly driven by boosted oil recovery programs, a rise in flow assurance and integrity demands across offshore and onshore basins, and the presence of an intensified E&P activity. According to a data report published by Apiary in 2025, the oilfield chemicals industry in the overall region constitutes a USD 18.5 billion valuation as of 2024, which is further projected to gain USD 30.0 billion by the end of 2032 through a 6.8% growth rate. Besides, regional vendors are gradually pivoting to REACH-driven and low-toxic demulsifiers along with formulation improvement for heavy crudes and strong corrosion inhibition for increased carbon dioxide and hydrogen sulfide environments, thus denoting an optimistic outlook for the market’s growth.
China in the oilfield production chemicals market is gaining increased exposure due to specialty chemical adoption in production operations, along with persistent upstream integrity demands. As per an article published by the ITA in September 2025, the country is considered the world’s largest market for environmental technology products, continuously growing with a 12.8% yearly rate. Based on this, the country is expected to achieve a sewage treatment of more than 95%, along with a recycled water utilization rate of more than 25% across water-scarce prefecture-level cities. Besides, the City and Township Sewage Treatment and Resource Utilization Development Plan is focused on renovating and expanding 45,000 km of sewage collection networks and also increasing the sewage treatment capacity by 12 million cubic meters regularly, thus suitable for uplifting the market in the country.
India in the oilfield production chemicals market is also growing, owing to a rise in specialty chemicals, water management complexity, and upstream intensification. Besides, as per a data report published by the India Budget Government in 2024, there has been an allocation of ₹ 25 crores in revenue for new schemes pertaining to petrochemicals. Moreover, according to a data report published by the IBEF Organization in October 2025, the country is considered the sixth largest producer of chemicals, significantly contributing 7% to the domestic GDP. In addition, the petrochemicals and chemicals requirement in the country is projected to almost triple and reach USD 1 trillion by the end of 2040. Meanwhile, chemicals and allied products exports have reached USD 9,194 million, thereby creating an optimistic outlook for the overall market’s growth and expansion.

Key Oilfield Production Chemicals Market Players:
- BASF SE (Germany)
- Company Overview
- Business Strategy
- Key Product Offerings
- Financial Performance
- Key Performance Indicators
- Risk Analysis
- Recent Development
- Regional Presence
- SWOT Analysis
- Dow Inc. (U.S.)
- Nalco Champion, An Ecolab Company (U.S.)
- Solvay SA (Belgium)
- Clariant AG (Switzerland)
- Albemarle Corporation (U.S.)
- Ashland Global Holdings Inc. (U.S.)
- Croda International Plc (U.K.)
- Innospec Inc. (U.S.)
- Chevron Phillips Chemical Company LLC (U.S.)
- Lubrizol Corporation (U.S.)
- Kemira Oyj (Finland)
- Nouryon Chemicals Holding B.V. (Netherlands)
- CES Energy Solutions Corp. (Canada)
- Shin-Etsu Chemical Co., Ltd. (Japan)
- LG Chem Ltd. (South Korea)
- Reliance Industries Limited (India)
- ONGC Petro Additions Limited (OPaL) (India)
- Petronas Chemicals Group Berhad (Malaysia)
- Orica Limited (Australia)
- BASF SE is one of the leading suppliers of cathode active materials (CAM) for lithium-ion batteries, which are increasingly utilized in marine applications for hybrid and fully electric vessels. The organization’s focus on high-energy density and sustainable chemistries has readily positioned it as the notable enabler of next-generation marine battery systems.
- Dow Inc. significantly contributes to the marine battery ecosystem through innovative materials and polymers that optimize battery safety, insulation, and performance. Its advancements in sealants and electrolytes readily support the durability of lithium-ion batteries utilized in maritime propulsion.
- Nalco Champion, which is an Ecolab Company, has specialized in water treatment and chemical solutions for energy systems, and while not considered a direct marine battery manufacturer, its lifecycle chemical management expertise supports offshore and marine operations. This indirectly complements the adoption of marine batteries by ensuring cleaner and more efficient operating environments.
- Solvay SA develops specialty polymers and electrolytes that are suitable for lithium-ion and solid-state batteries, including those utilized in marine propulsion. Its increased emphasis on sustainable materials and high-performance additives has strengthened the reliability and efficiency of marine battery systems.
- Clariant AG significantly offers functional additives and specialty chemicals that have the ability to enhance battery performance, safety, and environmental compliance. In the marine battery market, its increased focus on eco-friendly formulations has aligned with the industry’s push toward sustainable electrification of vessels.
Here is a list of key players operating in the global market:
The international oilfield production chemicals market is extremely competitive and readily dominated by multinational organizations with robust regional footprints. Notable players, including Clariant, Dow, and BASF, have leveraged advancements in sustainable formulations to effectively comply with tightened environmental policies. Likewise, Asia-based organizations, such as Petronas Chemicals, LG Chem, and Reliance, are effectively making expansions in capacity to meet a rising demand in emerging economies. Besides, in December 2025, ExxonMobil successfully raised its 2030 plan by increasing cash flow and earnings, which reflects a robust contribution from innovative assets, a profitable business mix, and low operational expenses. These are all driven by the organization’s outstanding set of suitable competitive benefits and multi-year transformation, which is suitable for fueling the oilfield production chemicals market globally.
Corporate Landscape of the Oilfield Production Chemicals Market:
Recent Developments
- In December 2025, Deepak Nitrite Ltd declared that its Deepak Chem Tech Ltd, which is a wholly-owned subsidiary, has begun with manufacturing operations at its very own nitric acid plant in Gujarat, amounting to an overall capital spending of an estimated ₹515 crore.
- In September 2024, HUAWEI significantly launched its newest joint innovation, along with an artificial intelligence (AI) application in gas and oil upstream, with the objective to boost the industry’s overall quality with intelligence.
- In August 2024, Chevron Corporation declared that it has commenced oil and natural gas production from the Anchor project in the deep-water U.S. Gulf of Mexico, effectively marking the effective delivery of high-pressure technology.
- Report ID: 8311
- Published Date: Dec 12, 2025
- Report Format: PDF, PPT
- Explore a preview of key market trends and insights
- Review sample data tables and segment breakdowns
- Experience the quality of our visual data representations
- Evaluate our report structure and research methodology
- Get a glimpse of competitive landscape analysis
- Understand how regional forecasts are presented
- Assess the depth of company profiling and benchmarking
- Preview how actionable insights can support your strategy
Explore real data and analysis
Frequently Asked Questions (FAQ)
Free Sample includes current and historical market size, growth trends, regional charts & tables, company profiles, segment-wise forecasts, and more.
Connect with our Expert


Copyright @ 2026 Research Nester. All Rights Reserved.
