Moisture Meter Market Outlook:
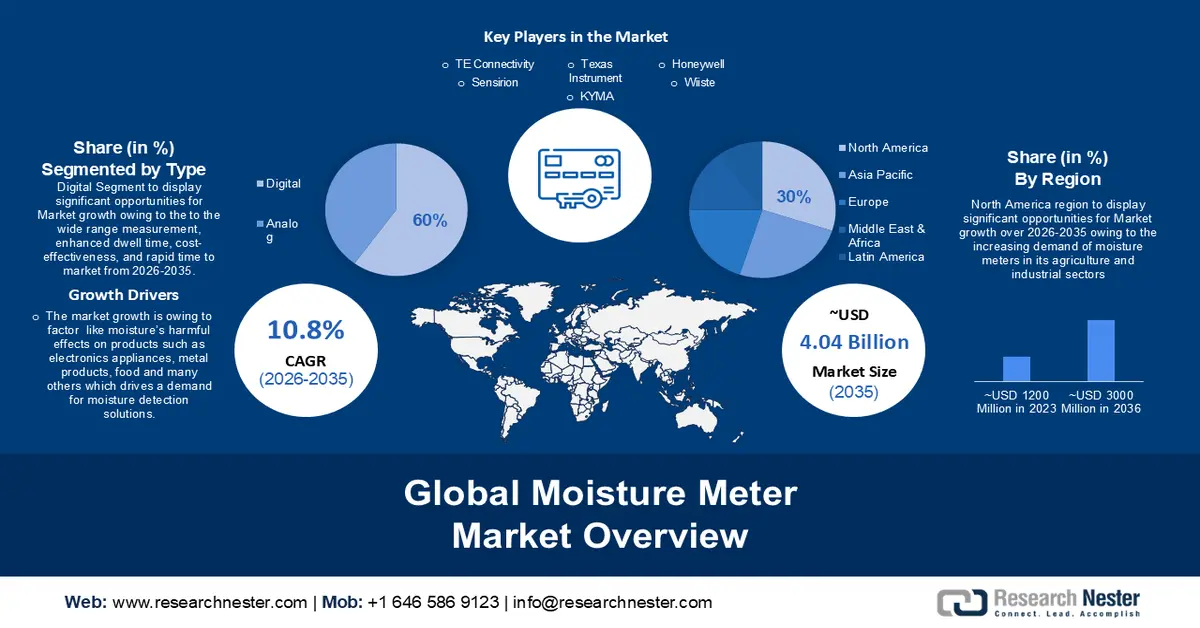
Moisture Meter Market size was valued at USD 1.45 billion in 2025 and is expected to reach USD 4.04 billion by 2035, registering around 10.8% CAGR during the forecast period i.e., between 2026-2035. In the year 2026, the industry size of moisture meter is evaluated at USD 1.59 billion.
The market growth is owing to factors like moisture’s harmful effects on products such as electronics appliances, metal products, food, and many others which drives a demand for moisture detection solutions. Excess moisture leads to structural issues, mold growth, and product degradation. Sectors like food and pharmaceuticals prioritize maintaining optimal moisture levels. Infrastructure maintenance benefits from early moisture detection to prevent metal corrosion and mold build up. For instance, mold spoilage losses in Western Europe cost more than 210 USD per year in the bread industry, and food-related to fungal spoilage in Australia has been reported to be more than 10 million USD per year. To prevent such losses and to maintain strict regulations moisture meter becomes a essential tool.
In addition to these, other factors that are believed to fuel the market growth of moisture meter market include incresing awareness of emerging stringent reguations and quality standards mandated by regulatory bodies and industry association. The trend is particularly evident in sectors such as food and beverages, pharmacuticals and electronics where sringent precision and rigrous quality control measures and imperative.
Key Moisture Meter Market Insights Summary:
Regional Highlights:
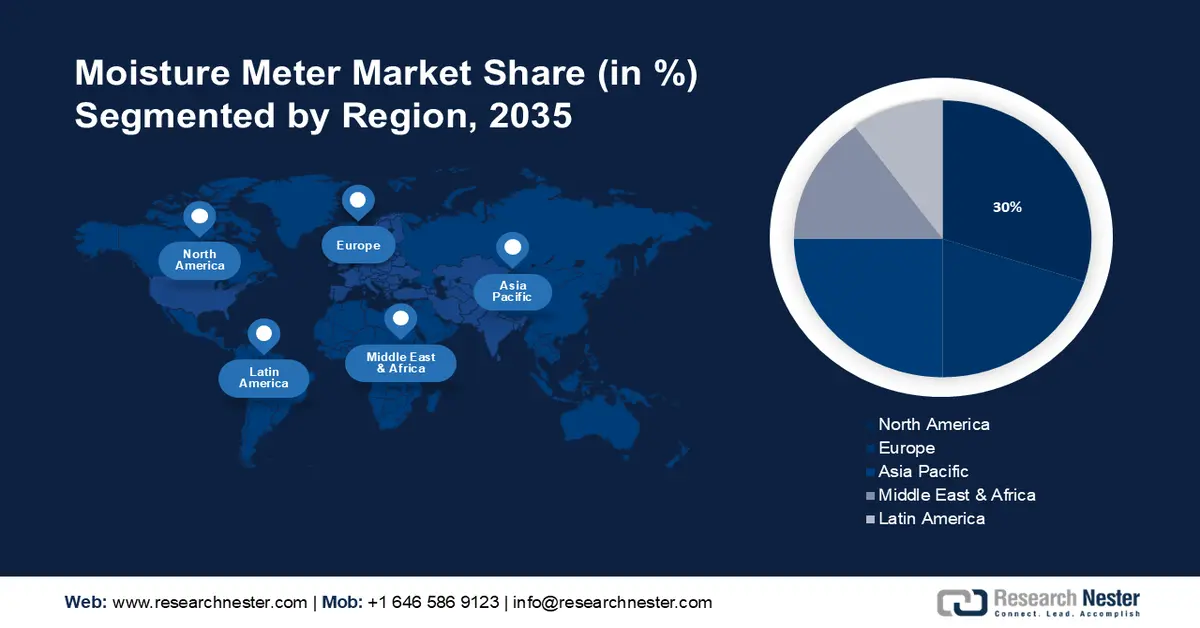
- North America is anticipated to account for 30% share by 2035, impelled by strict environmental regulations, government support, and rising adoption of precise farming and air quality monitoring systems.
- Asia Pacific market is projected to hold a 25% share by 2035, owing to the rapid modernization of agriculture and growing industrial and technological adoption in countries like China, Japan, and India.
Segment Insights:
- The digital segment is projected to account for 60% share by 2035, driven by the numerous benefits including wide range measurement, enhanced dwell time, cost-effectiveness, and rapid time to market.
- The industrial segment is expected to hold a 32% share by 2035, owing to escalating demand for cooling system monitoring within the food and beverages industry.
Key Growth Trends:
- Rising Demand in Agricultural Sector
- Increasing Concerns Regarding Environmental Degradation
Major Challenges:
- Price Fluctuations to Prevent Growth
Key Players: Honeywell International Inc., TE Connectivity, ensirion, STMicroelectronics N.V., Texas Instrument Incoperated, Amphenol Advanced Sensor, Bosch Sensortec GmbH.
Global Moisture Meter Market Forecast and Regional Outlook:
Market Size & Growth Projections:
- 2025 Market Size: USD 1.45 billion
- 2026 Market Size: USD 1.59 billion
- Projected Market Size: USD 4.04 billion by 2035
- Growth Forecasts: 10.8%
Key Regional Dynamics:
- Largest Region: North America (30% Share by 2035)
- Fastest Growing Region: Asia Pacific
- Dominating Countries: United States, China, Japan, Germany, United Kingdom
- Emerging Countries: India, Brazil, South Korea, Mexico, Australia
Last updated on : 28 November, 2025
Moisture Meter Market - Growth Drivers and Challenges
Growth Drivers
- Rising Demand in Agricultural Sector- According to the World Bank, the agriculture sector is crucial to economic growth and holds around 4% of the global GDP. Hence to ensure good quality crops, the rising advancements of wireless moisture meters and remote moisture sensors have been revolutionizing the monitoring of variables impacting crop quality. By providing real-time, actionable insights, these sensors empower farmers to enhance yields and minimize the time spent on watering trips. Furthermore, the trend towards industrial automation and the advent of Industry 4.0 has led to the integration of moisture meters in different industries such as food and beverages, healthcare, and textiles, among others.
- Increasing Concerns Regarding Environmental Degradation-Amid environmental concerns, the necessity for monitoring and regulating humidity levels in both indoor and outdoor settings surged, driving the demand for moisture meters across diverse sectors such as weather monitoring, HVAC system, greenhouses, and indoor air quality control. Additionally, the increasing awareness regarding environmental degradation is anticipated to drive the moisture meter market for environmental sensors, particularly in applications such as air purification systems and affordable air quality monitoring devices. Furthermore, continuous environmental monitoring becomes vital given the water bodies getting polluted from climate change and human action.
- The Growing Development in Moisture Meter Technology-Recently the use of Microelectromechanical System (MEMS) technology has been on the rise, and because of that, there is a growing demand for moisture meters which are based on MEMS technology. Meters with MEMS technology have more functionality and complexity, faster processing speed, lower power consumption, and reduced size. Thus, making it more favored for different industries. Furthermore, the addition of wireless technology to the moisture meter has increased its usability as it has become more cost-efficient and easier to use as compared to its counterpart. For instance, due to the adoption of wireless meters there has been a demand for moisture meters in greenhouse farming for climate monitoring.
Challenges
- Price Fluctuations to Prevent Growth- Price fluctuations and supply shortages in key components and raw materials significantly hinder moisture meter market growth. Additionally, substantial maintenance and operational expenses pose significant challenges. Moreover, the expense of moisture meter technology contributes to higher overall market prices, further complicating growth prospects.
- It has been found that sensors lack quick response times, which is crucial for maintenance.
- Limited accuracy and complexity of installation regulations.
Moisture Meter Market Size and Forecast:
| Report Attribute | Details |
|---|---|
|
Base Year |
2025 |
|
Forecast Year |
2026-2035 |
|
CAGR |
10.8% |
|
Base Year Market Size (2025) |
USD 1.45 billion |
|
Forecast Year Market Size (2035) |
USD 4.04 billion |
|
Regional Scope |
|
Moisture Meter Market Segmentation:
Type Segment Analysis
The digital segment is predicted to account for 60% share of the global moisture meter market by 2035. The segment growth can be attributed to the numerous benefits it offers, including wide range measurement, enhanced dwell time, cost-effectiveness, and rapid time to market. These advantages drive electronic manufacturers to adopt sensors with digital output in smart home appliances, thereby enhancing their reliability and durability and further propelling industry growth. According to different surveys, over 688 million home appliances were sold in 2020, hence moisture meter manufacturers are prioritizing the integration of digital interfaces into their sensor offering to meet the high demand from various environmental monitoring application.
End-User Segment Analysis
The industrial segment is predicted to account for 32% share of the global moisture meter market by 2035. The segment growth is fueled by escalating demand for cooling system and monitoring within the food and beverages industry. Moisture meters play a vital role in managing elevated moisture levels, which pose a risk to food quality. As the need for high-quality food products capable of extended preservation grows, manufacturers are prompted to develop customized sensors tailored to consumer preferences, enhancing their competitive position in the market.
Our in-depth analysis of the global market includes the following segments:
|
Product |
|
|
Type |
|
|
End-User |
|

Vishnu Nair
Head - Global Business DevelopmentCustomize this report to your requirements — connect with our consultant for personalized insights and options.
Moisture Meter Market - Regional Analysis
North American Market Insights
North America industry is anticipated to account for largest revenue share of 30% by 2035. The market growth in the region is driven by strict environmental regulations to keep products like food, pharmaceuticals, and electric appliances safe from mold and dampness, government support, and initiatives promoting modern agriculture. Furthermore, the farm owners, both small and large-scale have started to adopt precise farming practices to improve agricultural efficiency and acquire better harvest. Additionally, the rise in the adoption of air quality monitoring systems and rising demand for moisture meters in domestic applications such as air conditioners in offices and thermostats in homes are driving the growth of the market in the region. To give a reference, 1 out of 8 houses in the USA use a smart thermostat with a central air conditioning unit. These factors are impelling growth in the market.
APAC Market Insights
The Asia Pacific moisture meter market is estimated to be the second largest, registering a share of about 25% by the end of 2035. The market’s expansion can be attributed majorly to the rapid pace of modernization of agriculture. With its expanding economy and advancements in technological sector, Asia pacific emerges as a leading market for moisture meter. Significant market expansion is anticipated in key nations such as China, Japan, and India throughout the projection period. As China and Japan, renowned for their excellent technical infrastructure these nations are to exhibit a substantial demand for moisture meter in industries like medical, manufacturing, automobile and many more. Moreover, agriculture sector also accounts for the growth of the moisture meter market in the region, as India and China have a huge amount of arable land, for instance in India agriculture sector alone contributes 17.5% of its total GDP and adoption of modern farming techniques in these countries offers a great scope for the growth of the moisture meter market
Moisture Meter Market Players:
- Honeywell International Inc.
- Company Overview
- Business Strategy
- Key Product Offerings
- Financial Performance
- Key Performance Indicators
- Risk Analysis
- Recent Development
- Regional Presence
- SWOT Analysis.
- TE Connectivity.
- Sensirion.
- STMicroelectronics N.V.
- Texas Instrument Incoperated.
- Amphenol Advanced Sensor.
- Bosch Sensortec GmbH.
- KYMA
- Wiiste
- Metravi Instruments pvt ltd
Recent Developments
- South Korea KYMA, a comprehensive environmental measurement solutions company, launched portable moisture meter KHK-21. KHK-21, a portable automatic moisture meter, compiles with the revised air pollution process test standards. It also uses KYMA’s domestically patented technology to complete the entire measurement process from preheating to measurement in around 5 minutes. Additionally, KHK-21 is a portable, battery-powered device that can operate for nearly a week on a single charge. KHK-21 is gaining attention as a simple and innovative measuring device because it does not require additional heating, cooling, optical, or chemical devices due to its capacitive sensor measurement approach.
- one of the largest manufacturers & distributor of electrical & electronic test and measurement instrument in India launched the HT-12 Temperature and Humidity Meter with External Probe its large LCD display for digital temperature & humidity, with alarm clock, min & max temperature & humidity reading, comfort level indication and option to measure indoor temperature and humidity as well as outdoor temperature simultaneously. Temperature range: -10°C ~ 50°C, Humidity range: 20% ~ 95%RH.
- Report ID: 5858
- Published Date: Nov 28, 2025
- Report Format: PDF, PPT
- Explore a preview of key market trends and insights
- Review sample data tables and segment breakdowns
- Experience the quality of our visual data representations
- Evaluate our report structure and research methodology
- Get a glimpse of competitive landscape analysis
- Understand how regional forecasts are presented
- Assess the depth of company profiling and benchmarking
- Preview how actionable insights can support your strategy
Explore real data and analysis
Frequently Asked Questions (FAQ)
About this Report
Connect with our Expert


Copyright @ 2026 Research Nester. All Rights Reserved.
