LNG Carrier Market Outlook:
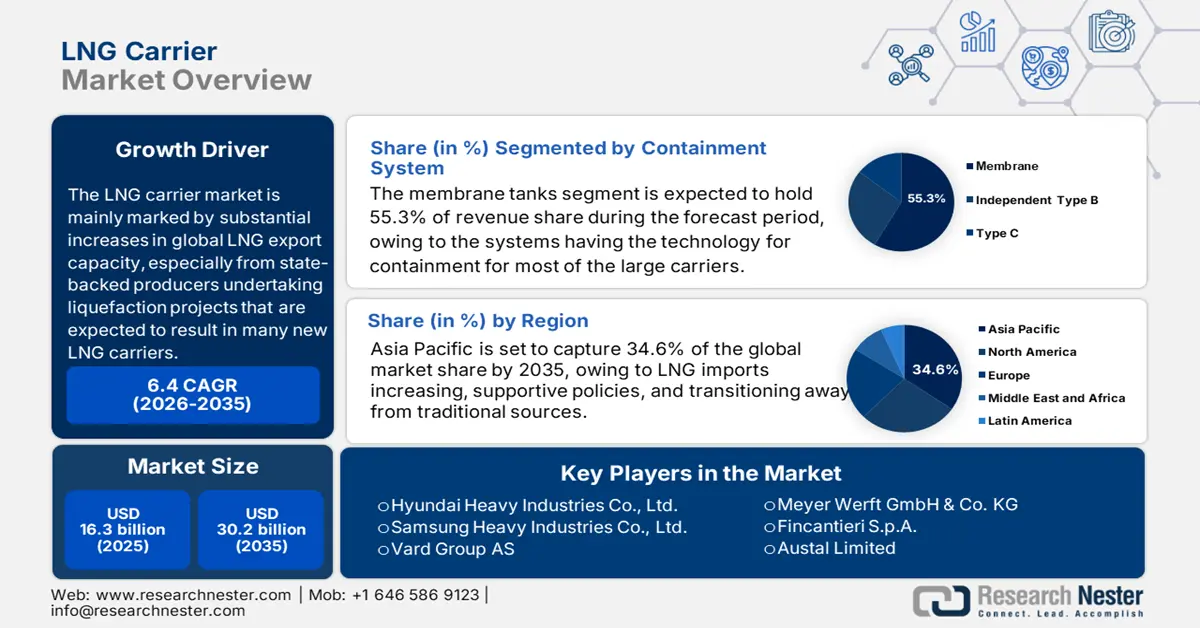
LNG Carrier Market size was estimated at USD 16.3 billion in 2025 and is expected to surpass USD 30.2 billion by the end of 2035, rising at a CAGR of 6.4% during the forecast period, i.e., 2026-2035. In 2026, the industry size of LNG carrier is estimated at USD 17.4 billion.

According to research, the LNG carrier market is primarily characterized by substantial increases in global LNG export capacity, particularly from state-backed producers undertaking liquefaction projects that are expected to result in numerous new LNG carriers. QatarEnergy's transformative North Field East/South (NFE/NFS) project aims to boost LNG production from 77 million tons (Mt) to 142 MTPA by 2030. These LNG development plans involve orders for at least 36 new LNG carriers from HD Hyundai and China Shipbuilding, with dozens more anticipated, representing several billion dollars in investment. Additionally, Venture Global secured USD 15.1 billion in financing in July 2025 for its CP2 plant in the U.S., which will develop 29 Mtpa of LNG, increasing the nation's overall export capacity in the forthcoming years-again creating demand for new LNG carriers.
From a supply chain perspective, steel and cryogenic containment systems are procured globally. However, approximately two-thirds of new LNG carriers are built in South Korea, while around one-third are produced in Japanese and Chinese shipyards. Further supplier growth is driven by accelerated logistics and the export of raw materials. The U.S. Federal Energy Regulatory Commission (FERC) and the Department of Energy (DOE) fully support initiatives like the McNeese State University LNG Center of Excellence to promote research, development, and training to improve the safety and operations of offshore LNG maritime systems.
Key LNG Carrier Market Insights Summary:
Regional Highlights:
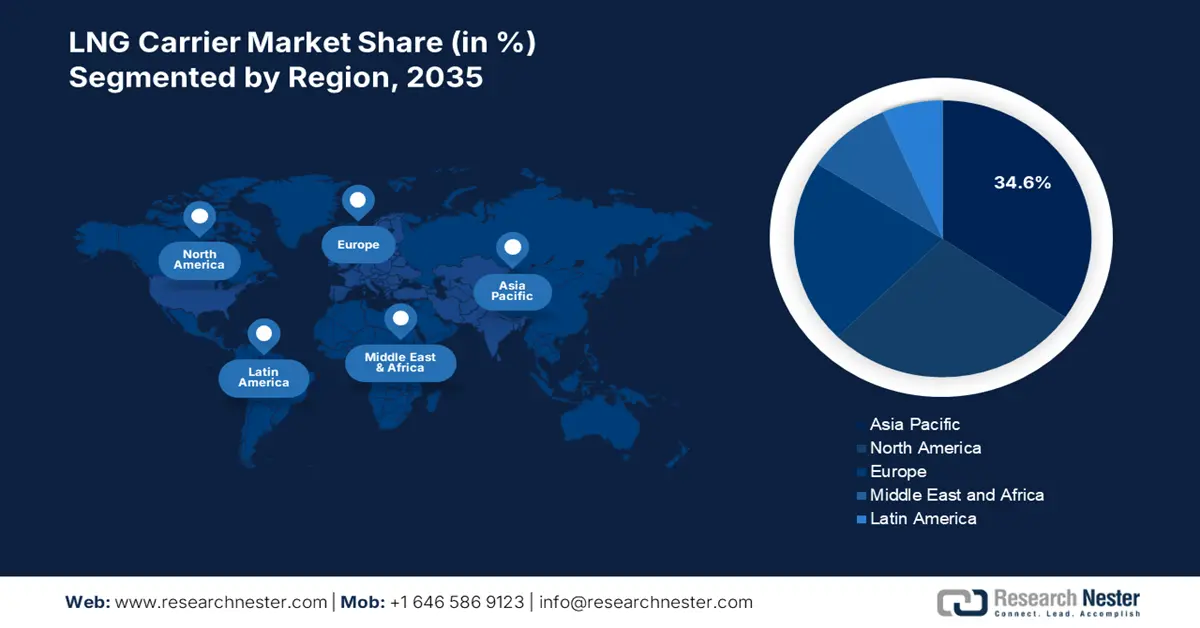
- By 2035, the Asia Pacific LNG carrier market is projected to hold 34.6% share, impelled by rising LNG imports, supportive policies, and the transition toward decarbonized energy sources.
- The North American market is anticipated to capture 27.9% share by 2035, driven by rapid liquefaction infrastructure expansion, growing exports, and demand for floating storage and regasification units (FSRUs).
Segment Insights:
- The membrane segment is projected to account for 55.3% share of the LNG carrier market by 2035, propelled by the adoption of membrane containment systems enabling larger vessel capacities, enhanced safety, and greater efficiency.
- The dual-fuel propulsion segment is anticipated to hold a 40% share by 2035, driven by the capability to burn both LNG and traditional marine fuels, supporting compliance with future IMO emission regulations.
Key Growth Trends:
- Expansion of liquefaction and export infrastructure
- Fleet modernization and eco-friendly vessels
Major Challenges:
- Volatile LNG prices and trade uncertainty
- Skilled labour shortage and safety concerns
Key Players: Hyundai Heavy Industries Co., Ltd., Samsung Heavy Industries Co., Ltd., Daewoo Shipbuilding & Marine Engineering, China State Shipbuilding Corporation (CSSC), Hudong-Zhonghua Shipbuilding Group, Meyer Werft GmbH & Co. KG, Fincantieri S.p.A., Austal Limited, Keppel Offshore & Marine Ltd, Cochin Shipyard Limited, Malaysia Marine and Heavy Engineering Bhd, General Dynamics NASSCO, Philly Shipyard ASA, Chantiers de l'Atlantique, Vard Group AS.
Global LNG Carrier Market Forecast and Regional Outlook:
Market Size & Growth Projections:
- 2025 Market Size: USD 16.3 billion
- 2026 Market Size: USD 17.4 billion
- Projected Market Size: USD 30.2 billion by 2035
- Growth Forecasts: 6.4% CAGR (2026-2035)
Key Regional Dynamics:
- Largest Region: Asia Pacific (34.6% Share by 2035)
- Fastest Growing Region: North America
- Dominating Countries: United States, South Korea, China, Japan, Qatar
- Emerging Countries: India, Brazil, Australia, United Arab Emirates, Russia
Last updated on : 22 August, 2025
LNG Carrier Market - Growth Drivers and Challenges
Growth Drivers
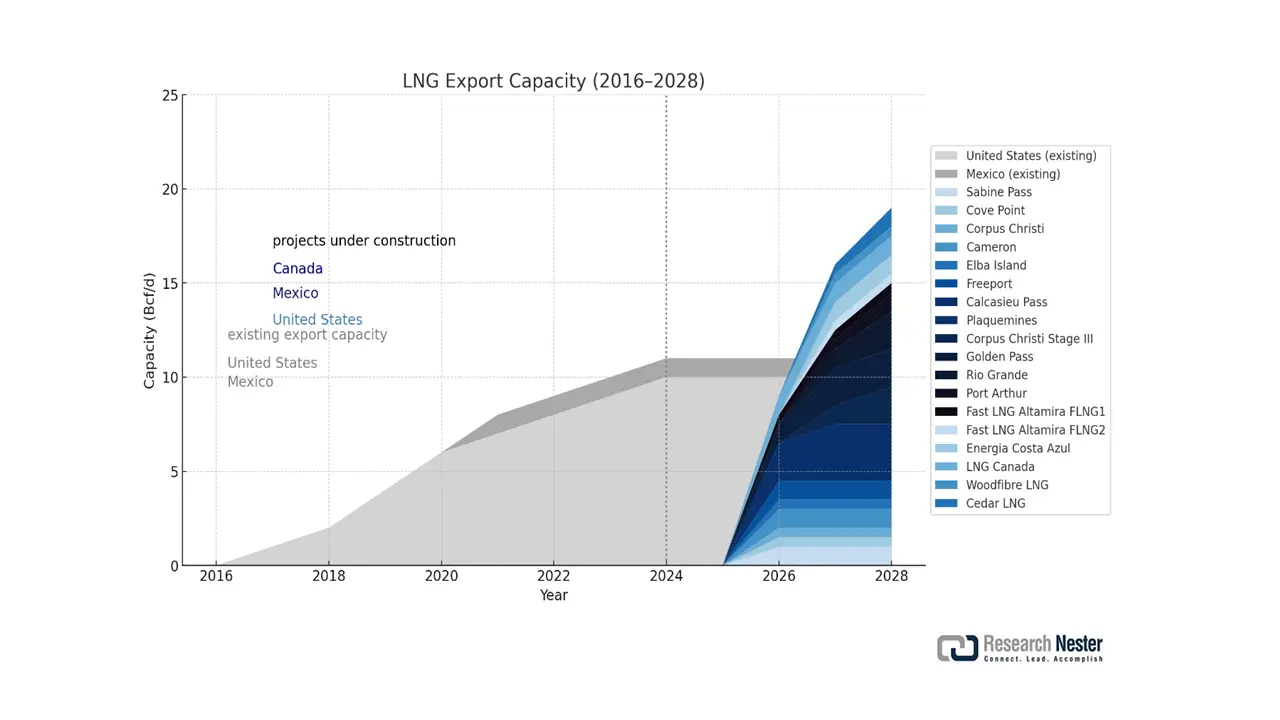
- Expansion of liquefaction and export infrastructure: Global investments in liquefaction terminals have created considerable growth in demand for LNG carriers.North America’s liquefied natural gas outbound trade capacity is set to double between 2023 and 2028, reaching 24.4 Bcf/d in 2028 from 11.4 billion cubic feet per day (Bcf/d) in 2023 (considering present-day operations and future projects). EIA estimates that LNG export will expand by 9.7 Bcf/d in the U.S. and 2.5 Bcf/d in Canada.
North America’s LNG Export Capacity, by 2028

Source: EIA
As per an April 2025 report by the EIA, Canada’s three LNG export projects have a cumulative capacity of 2.5 Bcf/d and are under development in British Columbia. Woodfibre LNG (export of 0.3 Bcf/d) plans to start trading in 2027. Similarly, a FLNG project-Cedar LNG (capacity approximately 0.4 Bcf/d), announced a final investment in June 2024 and is anticipated to initiate exports in 2028. The natural gas utilized for these projects is estimated to be supplied from western Canada. Moreover, the Canada Energy Regulator (CER) has sanctioned four export projects, comprising LNG Canada expansion, with a proposed export capacity of 4.1 Bcf/d.
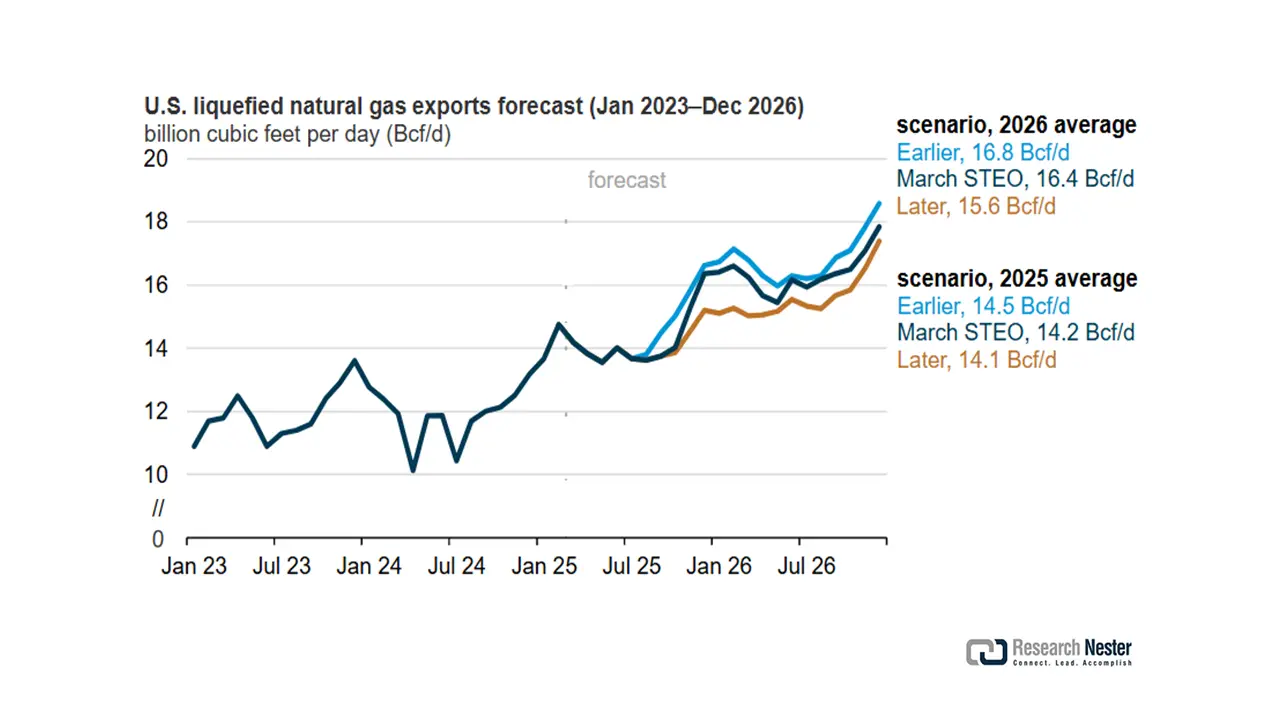
U.S. exports of liquefied natural gas were identified as the largest end user of natural gas in the Short-Term Energy Outlook (STEO) report published in March 2025. LNG gross exports are projected to grow by 15% and cross 16.4 Bcf/d by the end of 2026. The start-up timing of Golden Pass LNG and Plaquemines LNG Phase 2 (including 18 midscale trains), both new LNG export firms, can directly impact forecast predictions as these facilities contribute 19% of incremental LNG export capacity in the country during 2025-2026.
The U.S. LNG exports have snowballed every year since 2016, grossing 11.9 Bcf/d in 2024 from 0.5 Bcf/d in 2016, thereby making the U.S. the largest LNG exporter globally in 2024, globally. The rising international demand for LNG and the buildout of export infrastructure are aiding the market propagation. It is anticipated that U.S. LNG exports will witness a staggering growth owing to the three new facilities: Corpus Christi LNG Stage 3, Plaquemines LNG (Phases 1 and 2), and Golden Pass LNG. A cumulative export of 5.3 Bcf/d or 6.3 Bcf/d peak capacity is expected from these facilities and will boost U.S. LNG exports by 50% once fully operartional (likely to commence by the end of 2026).
U.S. LNG Export Forecast, through 2026
 Source: EIA
New liquidity terminals being developed in Mexico, Africa (Mozambique, Nigeria), and Australia will also contribute to increasing LNG volumes. This rapid growth of export facilities will require a larger LNG carrier fleet to successfully manage exporting gas across continents.
- Fleet modernization and eco-friendly vessels: With the new decarbonization norms implemented by IMO 2023, LNG carriers will continue their transition to dual-fuel engines and energy-efficient designs. There is an increasing demand for ME-GA and X-DF engines to alleviate methane slip and carbon emissions. LNG carriers with increased boil-off gas recovery are the favored choice for increasing numbers within the fleet. Shipowners are investing in upgrading and replacing their vessels environmentally, and a new modernization wave has been adopted across the global LNG fleet.
- Rise of floating LNG infrastructure (FLNG/FSRU): With the expansion of floating LNG units and Floating Storage Regasification Units (FSRUs) supporting LNG as a shipping requirement, demand for LNG shipping is increasing. Facilities like FLNG in Cameroon and Mozambique are transforming LNG production offshore and demanding very specialized logistical support for LNG shipping. In step, offshore facilities typically utilize shuttle LNG carriers, which create steady, localized demand and promote the diversification of fleets and investment in specialized LNG ships.
Challenges
- Volatile LNG prices and trade uncertainty: Market fluctuations in LNG prices impact carrier utilization, profitability, and trading patterns. The volatility also creates route inefficiencies, increasing idle time and difficulties in chartering. Geopolitical challenges, notably Russia-Ukraine, also disrupted shipping lanes and LNG flow into Europe. Uncertainty over long-term LNG contracts disincentivizes investments by shipping companies in new vessels, which increases operational uncertainty.
- Skilled labour shortage and safety concerns: Operating LNG carriers is a highly skilled task. There is, however, a significant shortage of qualified marine engineers and LNG handling specialists in the global labour pool. Safety training is of utmost importance in the transport of LNG. The non-availability of crew may defer scheduled deliveries, which increases insurance timelines, premiums, and the possible non-competence of regulatory requirements, which limits the ability to ramp up market supply.
LNG Carrier Market Size and Forecast:
| Report Attribute | Details |
|---|---|
|
Base Year |
2025 |
|
Forecast Year |
2026-2035 |
|
CAGR |
6.4% |
|
Base Year Market Size (2025) |
USD 16.3 billion |
|
Forecast Year Market Size (2035) |
USD 30.2 billion |
|
Regional Scope |
|
LNG Carrier Market Segmentation:
Containment System Segment Analysis
The membrane segment is predicted to gain the largest LNG carrier market share of 55.3% during the projected period by 2035. The membrane containment system is a fundamental driver of growth in the LNG carrier market by enabling larger vessel capacities, enhanced safety, and greater efficiency. Its compact design maximizes cargo space within the hull, allowing for increased transport volumes and economies of scale. The proven reliability of membrane technologies, such as GTT’s NO96 and Mark-III systems, reduces operational risks associated with cryogenic leakage and boil-off, bolstering confidence among operators, insurers, and charterers. This technological edge supports compliance with stringent international safety and emissions standards, making membrane systems the preferred choice for modern LNG carrier newbuilds. As demand for flexible and cost-effective LNG transportation rises, the adoption of membrane containment propels market expansion through innovation and scalability.
Propulsion Type Segment Analysis
The dual‑fuel propulsion segment is anticipated to constitute significant growth by 2035, with 40% LNG carrier market share, mainly due to the capability of on-board burning of LNG and land-based traditional marine fuels to meet future IMO contaminant emission rules. As the decarbonization and the need to mitigate greenhouse gases become more pressing, dual fuel capacity will continue to take LNG carrier market share from steam turbines or diesel propulsion.
Vessel Size Segment Analysis
The large‑scale carriers’ segment is anticipated to constitute the most significant growth by 2034, with 45.2% LNG carrier market share, mainly due to superior solubility and blending capabilities in beverages and food, and dairy products. The liquid nature allows for uniform sweetness to be spread across the product, which enhances the consumer experience. Furthermore, HSH syrup, as a sugar replacement, continues to gain space in the food industry as a qualified low-calorie option, with end users becoming more attracted to healthier substitutes.
Our in-depth analysis of the global LNG carrier market includes the following segments:
|
Segment |
Sub Segments |
|
Vessel Size |
|
|
Containment System |
|
|
Propulsion Type |
|
|
Application |
|

Vishnu Nair
Head - Global Business DevelopmentCustomize this report to your requirements — connect with our consultant for personalized insights and options.
LNG Carrier Market - Regional Analysis
Asia Pacific Market Insights
By 2035, the Asia Pacific LNG carrier market is expected to hold 34.6% of the market share due to LNG imports increasing, supportive policies, and transitioning away from traditional sources of energy to more decarbonized sources of energy. Rising industrial developments and Imports from coastal countries are causing investments in LNG carriers. Over the last few years, the Asia Pacific has accounted for a massive percentage of the global orders for LNG shipbuilding, with South Korea, China, and Japan leading the charge. New fleet strategies and regional LNG infrastructure expansion will only contribute positively to long-term carrier acquisitions.
China’s LNG carrier market, to experience significant increases in demand for gas, as well as new domestic experiences for shipbuilding. China’s LNG imports are expected to reach above 131 million metric tons by 2030 as policies from the government continue to focus on transitioning away from cleaner fuel alternatives. Hudong-Zhonghua Shipbuilding Group and COSCO Shipping have become the leading producers of LNG vessels in the world. China's dual-carbon objectives are being added by expanding coastal terminals to utility fleet acquisition strategies. Chinese yards are more recently closing the technology gap with South Korea, thereby adding value-added solutions for both domestic and international LNG shipping.
North America Market Insights
The North American LNG carrier market is expected to hold 27.9% of the market share during the forecast period. Accelerated growth is attributed to rapid liquefaction infrastructure expansion, growing exports, and documented demand for floating storage and regasification units (FSRUs). The region is one of the fastest-growing segments around the world, attributed to advancements in dual-fuel engines and retrofits, among other things. The environment is also being influenced by shale reserves, Gulf Coast terminals, and continuing connectivity with Asia for the trans-Pacific basin and Europe for transatlantic operations.
The U.S. LNG carrier market dominates North America’s LNG carrier activity, requiring additional new vessel tonnage, with researchers estimating perhaps as many as an additional 401 ships will be needed to support the rising export capacity. The U.S., ranked as the global leader in LNG exports since 2023, is projected to further increase its market presence. Data from the Short-Term Energy Outlook (November 2024) indicates that U.S. LNG exports will average 13.7 Bcf/d during the upcoming winter season. This 8% year-over-year increase, equivalent to 1.0 Bcf/d, is directly attributable to the commissioning of new liquefaction projects. Fleet growth continues while minimizing contracted ships in the Atlantic basin. Consequently, decade-low charter rates have balanced spot LNG prices.
Europe Market Insights
The European LNG carrier market is expected to hold 21.6% of the market share due to fleet delivery numbers and contract awards growing around 6% per year. Dual-fuel and membrane tank vessel investments are increasing within EU shipyards because of diversified import terminals. South Korea and China will account for much of the new contracts for European owners. Many of the LNG carrier deliveries also feature biofuel-compatible propulsion systems and boil-off gas reliquefication technology.

Key LNG Carrier Market Players:
- Hyundai Heavy Industries Co., Ltd.
- Company Overview
- Business Strategy
- Key Product Offerings
- Financial Performance
- Key Performance Indicators
- Risk Analysis
- Recent Development
- Regional Presence
- SWOT Analysis
- Samsung Heavy Industries Co., Ltd.
- Daewoo Shipbuilding & Marine Engineering
- China State Shipbuilding Corporation (CSSC)
- Hudong-Zhonghua Shipbuilding Group
- Meyer Werft GmbH & Co. KG
- Fincantieri S.p.A.
- Austal Limited
- Keppel Offshore & Marine Ltd
- Cochin Shipyard Limited
- Malaysia Marine and Heavy Engineering Bhd
- General Dynamics NASSCO
- Philly Shipyard ASA
- Chantiers de l'Atlantique
- Vard Group AS
South Korean and Chinese manufacturers presently dominate the LNG carrier market, with Hyundai Heavy Industries, Samsung Heavy Industries, and Daewoo Shipbuilding leveraging superior shipbuilding capacity and integrated gas containment technologies. European shipbuilders, including Meyer Werft and Fincantieri, compete in specialized segments concentrated on innovation and modular design in ships. Strategic moves by major players include enhanced investment in dual-fuel propulsion systems, digital twin implementation, and fleet decarbonization. US, Indian, and Malaysian shipbuilders are also increasingly winning contracts regionally with government backing and partnerships with energy-evolving majors. Global builders are also focusing on R&D partnerships and expanded capacity to meet the increased demand for LNG transport.
Some of the key players operating in the LNG carrier market are listed below:
Recent Developments
- In June 2025, Versalis (Eni) inaugurated its “Hoop” demonstration facility to chemically recycle mixed plastic waste into food- and pharmaceutical-grade feedstock. This supports Eni’s efforts to advance towards plastics circularity with its €201 million project, and offset portions of the €3.1 billion loss in petrochemical products. It sets a precedent in Europe for industrial scaling of circular-feedstock technologies in the chemical industry.
- Report ID: 3825
- Published Date: Aug 22, 2025
- Report Format: PDF, PPT
- Explore a preview of key market trends and insights
- Review sample data tables and segment breakdowns
- Experience the quality of our visual data representations
- Evaluate our report structure and research methodology
- Get a glimpse of competitive landscape analysis
- Understand how regional forecasts are presented
- Assess the depth of company profiling and benchmarking
- Preview how actionable insights can support your strategy
Explore real data and analysis
Frequently Asked Questions (FAQ)
LNG Carrier Market Report Scope
Free Sample includes current and historical market size, growth trends, regional charts & tables, company profiles, segment-wise forecasts, and more.
Connect with our Expert
Copyright @ 2026 Research Nester. All Rights Reserved.


