Liquid Waste Management Market - Regional Analysis
North America Market Insights
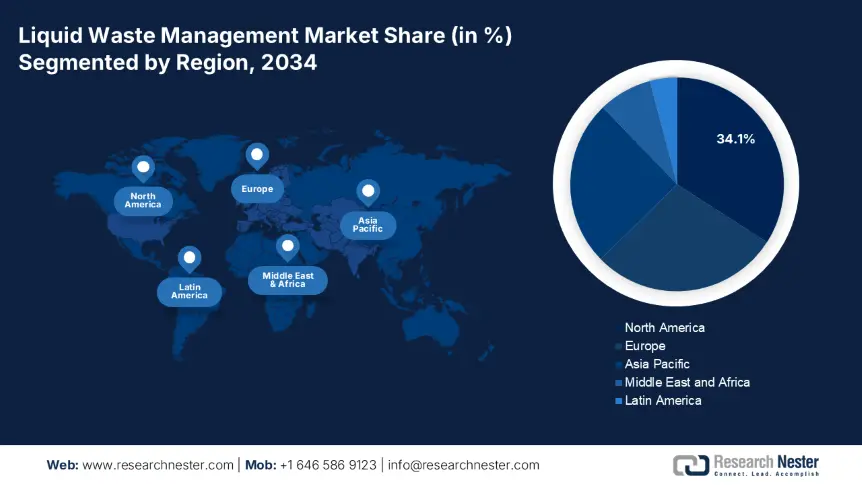
By 2034, the North America market is expected to hold 34.1% of the market share, and reach the value of $42.4 billion, and is forecasted to reach $65.8 billion in 2034, resulting in a compound annual growth rate of 4.6% (2024-2034). Growth is expected to be driven by drivers such as growth in industrial activity, upgrades to urban wastewater treatment facilities, and national wastewater disposal standards enforced by the EPA. The U.S. and Canada have contributed a combined investment of $4.1 billion through the Great Lakes Water Quality Agreement in wastewater infrastructure that bolsters strong growth in the municipal and industrial segments of the market.
In the U.S. alone, the liquid waste management market size was $36.2 billion in 2024 and is expected to reach $56.3 billion by 2034, for a CAGR of 4.7% (2024-2034). The EPA provides that there are more than 35 billion gallons of wastewater treated every day throughout the U.S. The increased effluents from the chemical, food, and refinery sectors of the economy, along with Biden's $56 billion investment in Clean Water infrastructure, are responsible for solidifying growth in advanced treatment, sludge dewatering, and hazardous liquid waste disposal markets.
Europe Market Insights
Europe market is expected to hold 28.6% of the market share, and it is anticipated to increase from USD 32.5 billion in 2024 to USD 46.9 billion by 2034, exhibiting a CAGR of 3.9% from 2025-2034. This growth is attributed to stricter EU directives on wastewater treatment, industrial effluent resource recovery targets, as well as the European Green Deal funding. Eurostat reports that more than 86% of urban wastewater is treated to the standard, which is driving the need for advanced treatments for wastewater, resource recovery, and recycling. The EU investments in biosolids and other businesses in decentralized treatment are also contributing to the accelerated growth in the region.
Germany’s liquid waste management market is expected to grow from USD 6.8 billion in 2024 to USD 9.5 billion by 2034, showing a CAGR of 3.4%. Growth of the market is driven by compliance with the strict enforcement of the Waste Water Ordinance, as well as the high cost of compliance by industry. Germany treated 97% of its municipal wastewater to tertiary standards (BMUV). Research investments in zero-liquid discharge and membrane technologies are also growing as industry continues to strive for circular water usage to meet climate neutrality and resource efficiency targets by 2045.
Research Investment Statistics in Liquid Waste Management
|
Country |
Research Investment 2024 (USD Million) |
Forecast 2034 (USD Million) |
|
UK |
211 |
316 |
|
Germany |
381 |
541 |
|
France |
196 |
281 |
|
Italy |
166 |
231 |
|
Spain |
146 |
211 |
|
Russia |
111 |
161 |
|
Nordic |
251 |
341 |
|
Rest of Europe |
306 |
421 |
Asia Pacific Market Insights
Asia Pacific market is expected to hold 25.1% of the market share and is set to grow from USD 29.2 billion in 2024 to USD 48.1 billion by 2034 with a CAGR of 5.3%. Growth prospects are a result of rapid urbanization in ASEAN economies, continued growth in the chemical industries in China, India, and Southeast Asia, and ever-increasing wastewater treatment disposal regulations. Countries like Japan and South Korea are investing in zero-liquid discharge (ZLD) systems, and there are R&D investments in membrane separation technology and advanced biotreatment processes to cost-effectively comply with industrial effluent standards across the region.
Country-wise Statistics: Investment, Growth, R&D
|
Country |
Investment (USD Bn) |
CAGR % (2024-2034) |
R&D Focus |
|
Japan |
2.4 |
4.0 |
Membrane bioreactors, sludge volume reduction |
|
China |
3.7 |
5.9 |
Chemical recycling, zero liquid discharge |
|
India |
2.2 |
6.3 |
Low-cost biotreatment, decentralized systems |
|
Indonesia |
1.0 |
5.7 |
Coastal effluent treatment technologies |
|
Malaysia |
0.9 |
5.2 |
Industrial wastewater recycling R&D |
|
Australia |
1.7 |
4.3 |
PFAS removal, advanced oxidation processes |
|
South Korea |
1.6 |
3.9 |
Nano-filtration, resource recovery solutions |
|
Rest of APAC |
1.3 |
5.5 |
Affordable treatment solutions for SMEs |