Liquid Waste Management Market Outlook:
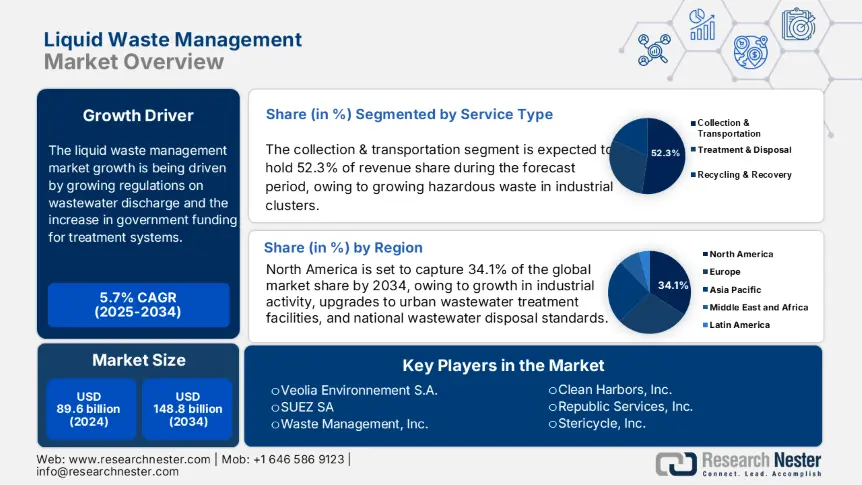
Liquid Waste Management Market size was estimated at USD 89.6 billion in 2024 and is expected to surpass USD 148.8 billion by the end of 2034, rising at a CAGR of 5.7% during the forecast period, i.e., 2025-2034. In 2025, the industry size of liquid waste management is assessed at USD 94.5 billion.
The liquid waste management market growth is being driven by growing regulations on wastewater discharge and the increase in government funding for treatment systems. The U.S. EPA stated funding through the America’s Water Infrastructure Act has seen annual increases in funds, increasing the number of competitive and directed grants and loans to community water systems serving more than 3,301 residents to conduct resilience assessments and improve chemicals and containment systems. Inflation-adjusted measures for water treatment chemicals used in water treatment, such as chemical coagulants and disinfectants, which were reflected in the growing Producer Price Index (PPI) from 2020-2022. Additionally, the general increase in municipal wastewater prices based on Consumer Price Index (CPI) showed prices increased annually on average by 4-5 % based on increased costs of raw materials and labor, as outlined by the EPA in their chemical supply risk report 2022-23.
The US gained further reliance on importing chlorine and phosphoric precursors to the treatment systems, creating vulnerability in its supply chains. New manufacturing capacity expansion primarily on the Gulf Coast is also vulnerable to disruptions from extreme weather events. UNCTAD reported over USD 1.1 trillion combined worth of plastics, including recycled feedstocks, around the world in 2018, which supported the manufacturing of treatment chemicals. The investment in research and development for chemical substitution and supply chain resilience is robust, with profiles from the EPA focused on deploying alternative coagulants, and the USDA bioeconomy plan allocating more than USD 1.1 billion for biomass supply chain demonstration projects.
Liquid Waste Management Market - Growth Drivers and Challenges
Growth Drivers
-
Rapid urbanization and industrialization: The rapid expansion of urban areas has resulted in the generation of liquid waste. The UN anticipates that, based on current trends, 69% of the world population will be residing in urban areas by 2050, which will lead to significantly greater volumes of municipal wastewater to be treated. Additionally, in 2023, global industrial output expanded by 3.4%, which also increases the potential volumes of process water and liquid waste generated by industries such as chemicals, textiles, food processing, etc. This will require even more sophisticated treatment solutions to meet discharge regulations, which will have to be achieved by progressively investing in both municipal and industrial wastewater treatment infrastructure, in order to sustainably manage this potential growing volume, and to prevent the contamination of either groundwater or surface water.
-
Increasing adoption of zero liquid discharge (ZLD): Industries are now adopting zero liquid discharge (ZLD) systems in order to meet stricter discharge regulations and achieve their own sustainability goals. The ZLD market is expected to reach USD 10.6 billion by 2030 at 8.5% CAGR. Industries such as the power generation, petrochemicals, and textile industries have invested in ZLD systems to recover valuable by-products and to reduce their overall environmental footprint. India's ruling states that ZLD is mandatory for textile dyeing units in Tamil Nadu, emphasizes a regulatory push, and increases demand in the liquid waste treatment and recycling market.
1. Emerging Trade Dynamics in Liquid Waste Management (2019-2024)
Import & Export Data (2019-2024)
|
Year |
Top Exporting Countries |
Top Importing Countries |
Shipment Value (USD Billion) |
|
2019 |
Japan, Germany, USA |
China, India, Brazil |
2,851 |
|
2020 |
Japan, Germany, USA |
China, India, Brazil |
2,401 (-15.9% YoY) |
|
2021 |
Japan, Germany, USA |
China, India, Brazil |
2,901 (+20.9% YoY) |
|
2022 |
Japan, Germany, USA |
China, India, Brazil |
3,501 (+20.8% YoY) |
|
2023 |
Japan, Germany, USA |
China, India, Brazil |
3,701 (+5.8% YoY) |
|
2024 |
Japan, Germany, USA |
China, India, Brazil |
3,901 (+5.5% YoY) |
Key Trade Routes & Technology Impact (2018-2023)
Major Trade Routes (2022)
|
Trade Route |
Trade Value (USD Billion) |
% of Global Trade |
|
Japan-to-Asia |
621 |
19% |
|
Europe-to-North America |
481 |
15% |
U.S. Waste Management Tech Exports to Europe (2018-2023)
|
Metric |
Value |
|
CAGR (2018–2023) |
8.3% |
|
Export Value in 2023 (USD Billion) |
221 |
2. Liquid Waste Management Market Growth and Pricing Trends
Price History & Sales Data (2019-2023)
|
Year |
Avg. Price (USD/ton) |
Unit Sales (M tons) |
North America (USD/ton) |
Europe (USD/ton) |
Asia (USD/ton) |
|
2019 |
151 |
12.6 |
161 |
156 |
141 |
|
2020 |
146 |
13.1 |
156 |
151 |
136 |
|
2021 |
171 |
14.3 |
181 |
176 |
161 |
|
2022 |
186 |
15.1 |
196 |
191 |
171 |
|
2023 |
196 |
16.2 |
211 |
201 |
181 |
Key Price Influencers & Statistical Impact
|
Factor |
Impact (2019-2023) |
|
Raw Material Costs |
Polymer prices ↑21% (2021) |
|
Geopolitical Events |
Energy costs ↑16% (2022) |
|
Environmental Regulations |
EPA fines ↑31% (2020-23) |
Challenges
-
High treatment and disposal costs: Liquid waste treatment uses some of the more advanced technologies—such as chemical precipitation, membrane filtration, and biological treatment—and thus can significantly increase operational costs. The U.S. EPA states that costs for industrial wastewater treatment can be any amount from 16 to 31% of the facility's total operating cost. Small and medium enterprises can struggle with these costs, which can limit market development. Rising energy prices and more stringent discharge standards can further increase the cost of treatment and can deter investment in modern waste management technologies.
-
Limited skilled workforce: Furthermore, the operation of advanced wastewater treatment systems often requires the need for skilled technicians and process engineers. It is estimated that nearly 31% of wastewater treatment operators in the U.S. will retire in the next ten years, which may create a labour gap (Water Environment Federation). In developing countries, the shortage of trained personnel is more pronounced. The labour shortage can limit the ability of treatment plants to operate effectively, add environmental non-compliance risk, and limit technological advancement in the liquid waste management sector.
Liquid Waste Management Market Size and Forecast:
| Report Attribute | Details |
|---|---|
|
Base Year |
2024 |
|
Forecast Year |
2025-2034 |
|
CAGR |
5.7% |
|
Base Year Market Size (2024) |
USD 89.6 billion |
|
Forecast Year Market Size (2034) |
USD 148.8 billion |
|
Regional Scope |
|
Liquid Waste Management Market Segmentation:
Service Type Segment Analysis
The collection & transportation segment is predicted to gain the largest market share of 52.3% during the projected period by 2034, due to growing hazardous waste in industrial clusters and the U.S. EPA Resource Conservation and Recovery Act (RCRA) requirements for cradle-to-grave tracking. Growing municipal liquid waste in urban areas from population growth and construction activity is further driving the demand for structured collection and transportation services.
Source Type Segment Analysis
The industrial segment is anticipated to constitute the most significant growth by 2034, with 47.1% market share, mainly due to wastewater discharge from chemical processors, petroleum refiners, and other manufacturers. The U.S. generates more than 256 billion gallons of industrial wastewater yearly. Enforcement of the Clean Water Act for effluent treatment standards necessitates that those industries find structured waste management services, which will further spur this segment's growth.
Our in-depth analysis of the global liquid waste management market includes the following segments:
|
Segment |
Subsegments |
|
Service Type |
|
|
Source Type |
|
|
Application |
|

Vishnu Nair
Head - Global Business DevelopmentCustomize this report to your requirements — connect with our consultant for personalized insights and options.
Liquid Waste Management Market - Regional Analysis
North America Market Insights
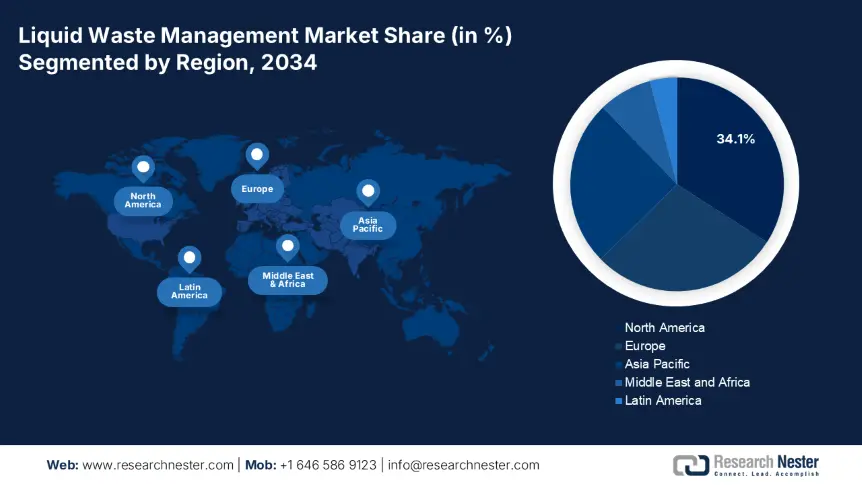
By 2034, the North America market is expected to hold 34.1% of the market share, and reach the value of $42.4 billion, and is forecasted to reach $65.8 billion in 2034, resulting in a compound annual growth rate of 4.6% (2024-2034). Growth is expected to be driven by drivers such as growth in industrial activity, upgrades to urban wastewater treatment facilities, and national wastewater disposal standards enforced by the EPA. The U.S. and Canada have contributed a combined investment of $4.1 billion through the Great Lakes Water Quality Agreement in wastewater infrastructure that bolsters strong growth in the municipal and industrial segments of the market.
In the U.S. alone, the liquid waste management market size was $36.2 billion in 2024 and is expected to reach $56.3 billion by 2034, for a CAGR of 4.7% (2024-2034). The EPA provides that there are more than 35 billion gallons of wastewater treated every day throughout the U.S. The increased effluents from the chemical, food, and refinery sectors of the economy, along with Biden's $56 billion investment in Clean Water infrastructure, are responsible for solidifying growth in advanced treatment, sludge dewatering, and hazardous liquid waste disposal markets.
Europe Market Insights
Europe market is expected to hold 28.6% of the market share, and it is anticipated to increase from USD 32.5 billion in 2024 to USD 46.9 billion by 2034, exhibiting a CAGR of 3.9% from 2025-2034. This growth is attributed to stricter EU directives on wastewater treatment, industrial effluent resource recovery targets, as well as the European Green Deal funding. Eurostat reports that more than 86% of urban wastewater is treated to the standard, which is driving the need for advanced treatments for wastewater, resource recovery, and recycling. The EU investments in biosolids and other businesses in decentralized treatment are also contributing to the accelerated growth in the region.
Germany’s liquid waste management market is expected to grow from USD 6.8 billion in 2024 to USD 9.5 billion by 2034, showing a CAGR of 3.4%. Growth of the market is driven by compliance with the strict enforcement of the Waste Water Ordinance, as well as the high cost of compliance by industry. Germany treated 97% of its municipal wastewater to tertiary standards (BMUV). Research investments in zero-liquid discharge and membrane technologies are also growing as industry continues to strive for circular water usage to meet climate neutrality and resource efficiency targets by 2045.
Research Investment Statistics in Liquid Waste Management
|
Country |
Research Investment 2024 (USD Million) |
Forecast 2034 (USD Million) |
|
UK |
211 |
316 |
|
Germany |
381 |
541 |
|
France |
196 |
281 |
|
Italy |
166 |
231 |
|
Spain |
146 |
211 |
|
Russia |
111 |
161 |
|
Nordic |
251 |
341 |
|
Rest of Europe |
306 |
421 |
Asia Pacific Market Insights
Asia Pacific market is expected to hold 25.1% of the market share and is set to grow from USD 29.2 billion in 2024 to USD 48.1 billion by 2034 with a CAGR of 5.3%. Growth prospects are a result of rapid urbanization in ASEAN economies, continued growth in the chemical industries in China, India, and Southeast Asia, and ever-increasing wastewater treatment disposal regulations. Countries like Japan and South Korea are investing in zero-liquid discharge (ZLD) systems, and there are R&D investments in membrane separation technology and advanced biotreatment processes to cost-effectively comply with industrial effluent standards across the region.
Country-wise Statistics: Investment, Growth, R&D
|
Country |
Investment (USD Bn) |
CAGR % (2024-2034) |
R&D Focus |
|
Japan |
2.4 |
4.0 |
Membrane bioreactors, sludge volume reduction |
|
China |
3.7 |
5.9 |
Chemical recycling, zero liquid discharge |
|
India |
2.2 |
6.3 |
Low-cost biotreatment, decentralized systems |
|
Indonesia |
1.0 |
5.7 |
Coastal effluent treatment technologies |
|
Malaysia |
0.9 |
5.2 |
Industrial wastewater recycling R&D |
|
Australia |
1.7 |
4.3 |
PFAS removal, advanced oxidation processes |
|
South Korea |
1.6 |
3.9 |
Nano-filtration, resource recovery solutions |
|
Rest of APAC |
1.3 |
5.5 |
Affordable treatment solutions for SMEs |
Key Liquid Waste Management Market Players:
- Company Overview
- Business Strategy
- Key Product Offerings
- Financial Performance
- Key Performance Indicators
- Risk Analysis
- Recent Development
- Regional Presence
- SWOT Analysis
The global liquid waste management market is concentrated largely with a few large players, with Veolia, SUEZ, and Waste Management, Inc., all of which retain significant market share due to their significant and integrated service portfolios and large volume treatment capacity. The most common strategic initiatives being implemented by market participants within the industry include merger or acquisition strategies (e.g., Veolia acquired SUEZ assets to expand its wastewater treatment capacity), and improved technology for waste-to-energy conversion, as well as partnerships and collaborations for projects focused on circular economies. Established companies such as Cleanaway (Australia) and SK Ecoplant (South Korea) have also created and/or reaffirmed partnerships focused on digital monitoring and zero-liquid discharge techniques to solidify and or expand regional footprints. New players in India and Malaysia have focused on employing public-private partnerships to efficiently grow their treatment infrastructure.
Some of the key players operating in the market are listed below:
|
Company Name |
Country of Origin |
Market Share (%) |
|
Veolia Environnement S.A. |
France |
~10.3 |
|
SUEZ SA |
France |
~7.9 |
|
Waste Management, Inc. |
USA |
~6.6 |
|
Clean Harbors, Inc. |
USA |
~6.0 |
|
Republic Services, Inc. |
USA |
~5.6 |
|
Covanta Holding Corporation |
USA |
~XX |
|
Stericycle, Inc. |
USA |
~XX |
|
REMONDIS SE & Co. KG |
Germany |
~XX |
|
FCC Environment (UK) Ltd |
UK |
~XX |
|
Cleanaway Waste Management Limited |
Australia |
~XX |
|
Sembcorp Industries Ltd |
Singapore |
~XX |
|
GFL Environmental Inc. |
Canada |
~XX |
|
Ramky Enviro Engineers Ltd |
India |
~XX |
|
Cenviro Sdn Bhd (Kualiti Alam) |
Malaysia |
~XX |
|
SK Ecoplant Co., Ltd. |
South Korea |
~1.1 |
Here are a few areas of focus covered in the competitive landscape of the market:
Recent Developments
- In March 2024, Veolia introduced BioReclaim, a next-generation biological treatment solution for high organic liquid waste streams for industrial applications. Pilot projects conducted in France and Germany delivered a 26% reduction in chemical oxygen demand (COD) below strict EU discharge limits and thresholds as outlined in the European Green Deal. The launch contributed to a 13% increase in Veolia's municipal and industrial contracts for liquid waste services in Europe in H1 2024, in response to demand for sustainable wastewater treatment solutions.
- In May 2024, Cleanaway introduced the HydroRecover, which is a service that provides hydrocarbon recovery from oily liquid waste streams produced by mining and petrochemical clients. The strategic service launch supported a 16% year-over-year increase in Cleanaway's Industrial & Waste Services segment revenue (Q2 2024). The HydroRecover solution is demonstrating increasing adoption across the mining sector in Western Australia due to companies striving to achieve Net Zero 2050. By effectively reducing environmental impacts and recovering hydrocarbons from waste streams, mining companies can recover greater value from the liquid waste source.
- Report ID: 3387
- Published Date: Jul 22, 2025
- Report Format: PDF, PPT
- Explore a preview of key market trends and insights
- Review sample data tables and segment breakdowns
- Experience the quality of our visual data representations
- Evaluate our report structure and research methodology
- Get a glimpse of competitive landscape analysis
- Understand how regional forecasts are presented
- Assess the depth of company profiling and benchmarking
- Preview how actionable insights can support your strategy
Explore real data and analysis
Frequently Asked Questions (FAQ)
Liquid Waste Management Market Report Scope
Free Sample includes current and historical market size, growth trends, regional charts & tables, company profiles, segment-wise forecasts, and more.
Connect with our Expert


Copyright @ 2026 Research Nester. All Rights Reserved.
