Industrial Silica Sand Market - Growth Drivers and Challenges
Growth Drivers
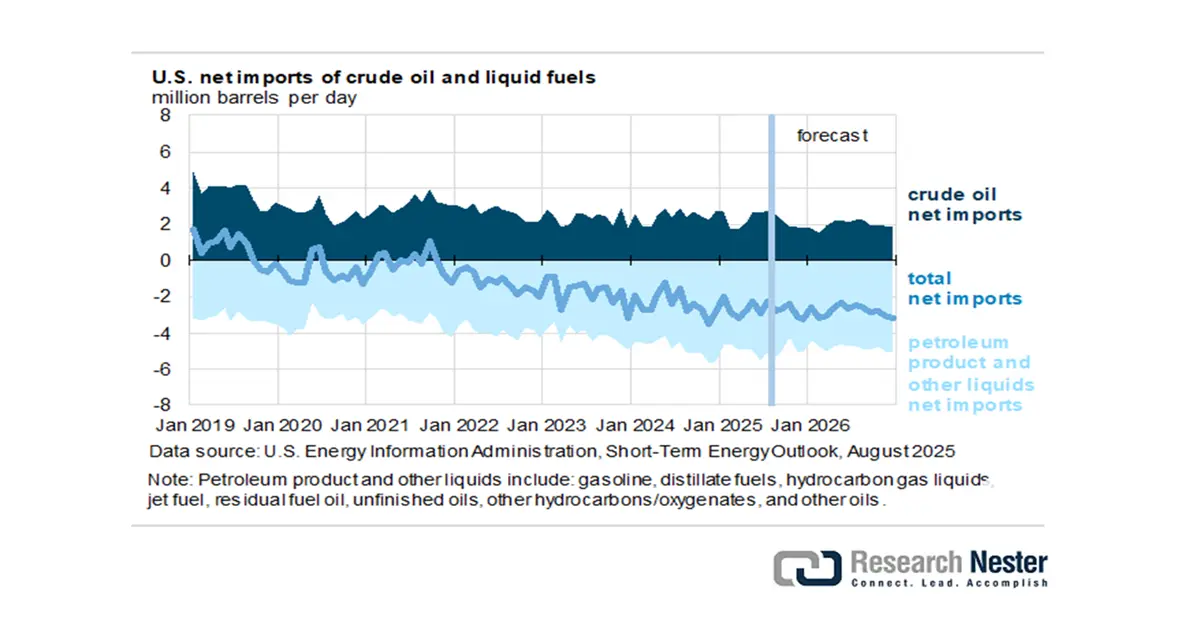
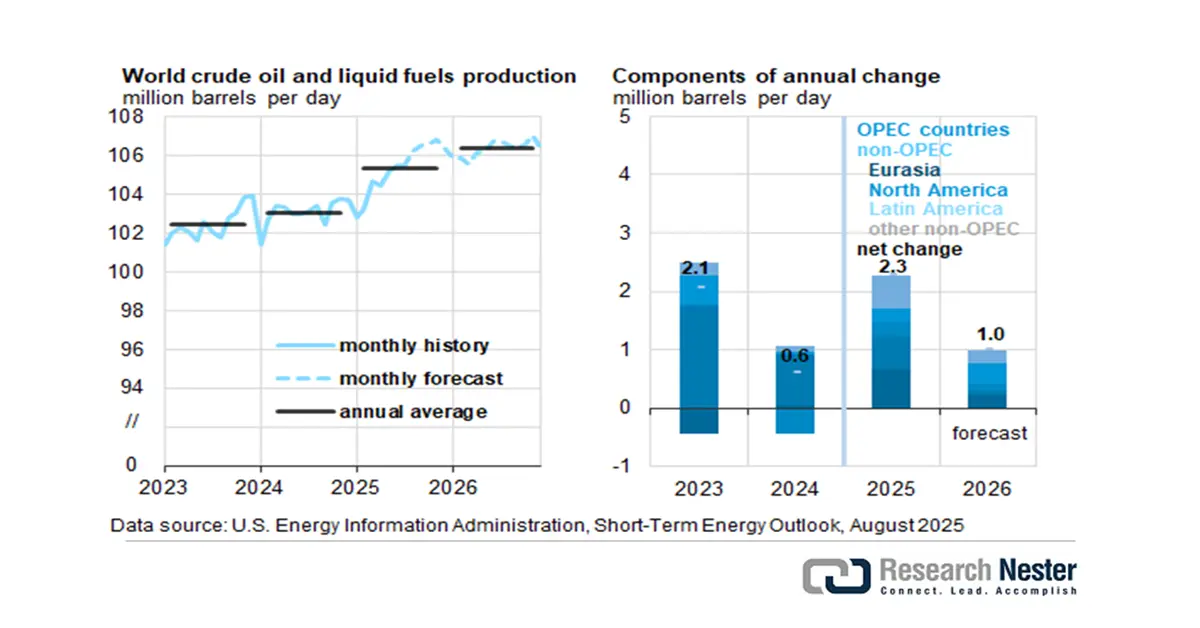
- High demand from oil & gas industry: Frac sand is widely used as a proppant during hydraulic fracturing of underground fissures in shale formations. Industrial silica allows the easy flow of oil and natural gas. The EIA noted an increase in the U.S. crude oil production at 13.6 million b/d in December 2025. However, with the slump in crude oil prices, U.S. producers are expected to accelerate the decline in drilling and will reach 13.1 million b/d by Q4 2026. The worldwide liquid fuels production grew to reach 2.0 million b/d on average in the second half of 2025, as compared with the first half. OPEC is set to contribute 50% of this increase. Non-OPEC manufacturers led by the U.S., Norway, Brazil, Canada, and Guyana render the other half.
U.S. Energy Information Administration, Short-Term Energy Outlook, August 2025
Source: EIA
At the same time, the world’s liquid fuels demand was up by 1.6 million b/d from the Q1 and Q2 of 2025. The inventory builds surpassed 1 million b/d for a sustained period of 1998, 2015, and 2020; crude oil prices decreased by 25% to 50%.
Oil Prices and Production, through 2026
|
Notable Forecast Changes |
2025 |
2026 |
|
Brent crude oil spot price (dollars per barrel) |
$67 |
$51 |
|
Previous forecast |
$69 |
$58 |
|
Percentage change |
-2.4% |
-12.0% |
|
Global oil inventory change (million barrels per day) |
1.6 |
1.4 |
|
Previous forecast |
1.1 |
1.1 |
|
Change |
0.6 |
0.3 |
|
OPEC+ crude oil production (million barrels per day) |
43.7 |
44.2 |
|
Previous forecast |
43.2 |
43.8 |
|
Percentage change |
1.0% |
0.9% |
|
U.S. crude oil production(million barrels per day) |
13.4 |
13.3 |
|
Previous forecast |
13.4 |
13.4 |
|
Percentage change |
0.3% |
-0.7% |
|
U.S. crude oil inventories (million barrels) |
433 |
448 |
|
Previous forecast |
405 |
400 |
|
Percentage change |
6.9% |
11.9% |
Source: EIA
Between 2020 and 2024, the U.S. crude oil and lease condensate production rose by 1.9 million barrels per day (b/d). Texas and New Mexico contribute to 93% of the production and the remaining producing areas in federal waters or offshore state, increased by just 130,000 b/d. Midland and Martin in Texas were responsible for 21% or 0.40 million b/d of the total crude oil produced in the U.S. Andrews, Howard, Glasscock, Loving, Ward, and Reagan—six other counties in Texas—grew by 0.36 million b/d.
Source: EIA
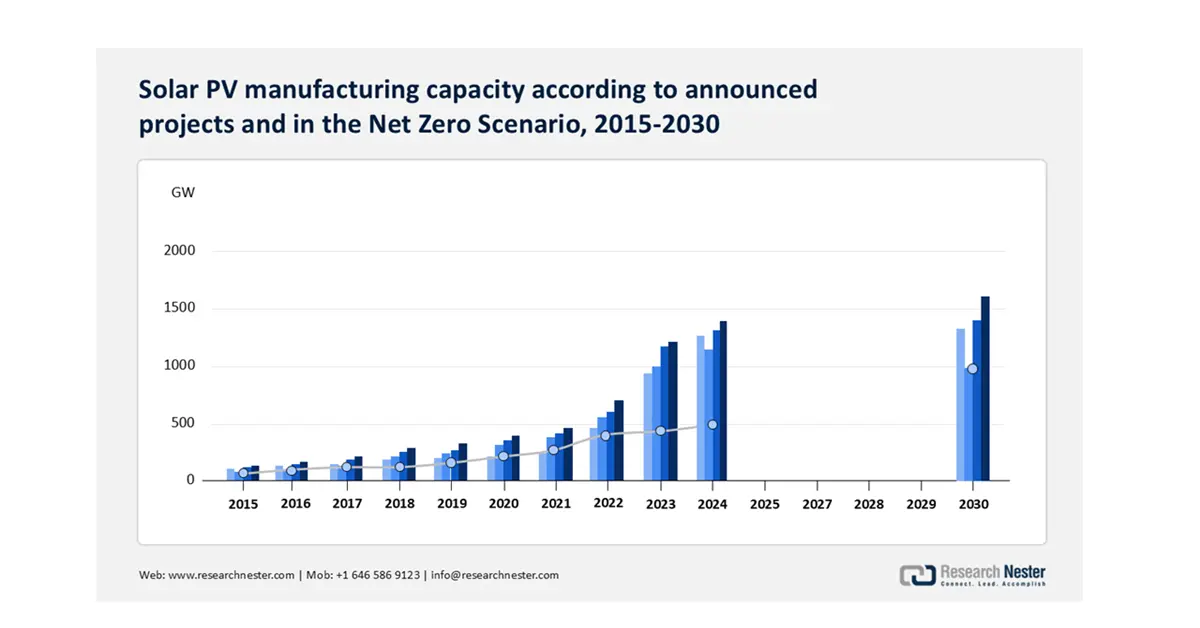
- Expansion in glass manufacturing: As silica sand is the main raw material used in the glass manufacturing process, there is a considerable demand for it. Global glass production is expected to reach over 210 million tonnes in 2022, according to the International Energy Agency (IEA). Urbanization and the growth of the building and packaging industries will continue to fuel demand for flat and container glass. The coming demand for silica is also driven by solar glass. The Solar Energy Industries Association (SEIA) predicts that solar installations with grow by 3% between 2028 and 2030, which implies more silica sand will be consumed to manufacture low-iron solar glass.
Source: IEA
Additionally, incentives for onshore production of critical items are aiding market growth. This impact is observed in solar components and modules manufacturing, via the 48C Advanced Energy Projects tax credit, granting USD 71 million to advance R&D and demonstration projects and USD 7 billion in solar deployment. Furthermore, First Solar in 2024 inaugurated its USD 1.1 billion solar PV module facility in Lawrence County, Alabama. This strategic initiative is anticipated to generate about 800 new jobs. First Solar, with the company's three operating facilities in Ohio and the new factory in Alabama, will vertically integrate its PV capacity. Favorable solar manufacturing has peaked the overall glass trade scenario.
Glass & Glassware Importers & Exporters, 2023
|
Country |
Import Value |
Export Value |
|
The U.S. |
USD 9.18 billion |
USD 6.44 billion |
|
China |
USD 6.93 billion |
USD 21.3 billion |
Challenges
- Volatile raw material prices: Market volatility due to varying costs of energy and transportation has produced prices for silica sand that point to fluctuation. For example, silica sand prices in the U.S. rose from USD 36 per ton in 2020 to more than USD 56 per ton in 2022, according to Statista, as a result of increases in freight rates and fuel prices. The market volatility affects profitability and long-term supply relationships, especially in segments like glass production, foundry, and hydraulic fracturing, where planning production and pricing is based on being able to nail down input costs.
- Health hazards and workplace liabilities: Respirable crystalline silica is a serious occupational risk. According to the CDC, U.S. workers are exposed to silica every year at work, which provides employers with potential claims and fines based on the demographics of employees who are exposed. OSHA also funded in operating silica-related penalties during the 2018-2023 reporting period. Companies can use dust suppression, personal protective equipment (PPE), and medical surveillance, each of which increases operating costs for employers. Also, the concept of strict liability makes the industry unattractive for new employers.
Industrial Silica Sand Market Size and Forecast:
|
Base Year |
2025 |
|
Forecast Year |
2026-2035 |
|
CAGR |
5.7% |
|
Base Year Market Size (2025) |
USD 17 billion |
|
Forecast Year Market Size (2035) |
USD 29.6 billion |
|
Regional Scope |
|

