Industrial Silica Sand Market Outlook:
Industrial Silica Sand Market size was estimated at USD 17 billion in 2025 and is expected to surpass USD 29.6 billion by the end of 2035, rising at a CAGR of 5.7% during the forecast period, i.e., 2026-2035. In 2026, the industry size of industrial silica sand is assessed at USD 17.9 billion.
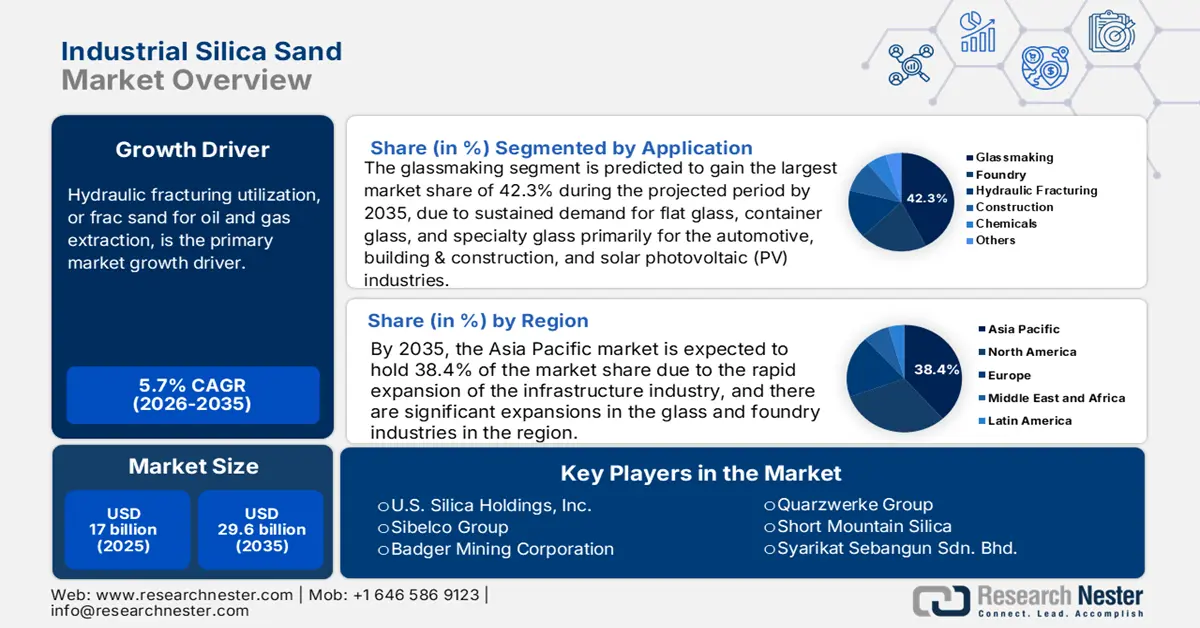
Hydraulic fracturing utilization, or frac sand for oil and gas extraction, is the primary market growth driver. U.S. Geological Survey reported that frac sand led the way for a 11% increase in total industrial sand demand - 120 MM tons in 2023 - due to greater sand per well consumption and increased shale production. U.S. exports of industrial sandstone, including frac sand, increased by 18% in 2023 to approximately 7.5 MM tons, making the total national tonnage net exports, while demonstrating the world's reliance on the quality and processing sophistication of U.S. sand.
In 2023, U.S. industrial sand and gravel production reached 130 million tons and was valued at USD 7.0 billion. 106 companies produced industrial sand and gravel across 33 States and the top States were Texas, Illinois, Wisconsin, Louisiana, Missouri, Oklahoma, Arkansas, California, Michigan, and Iowa. The cumulation yield generated from these States was 89% of the overall domestic sales and use. Moreover, roughly 81% of the U.S. tonnage was utilized as hydraulic-fracturing sand and cementing sand, whereas 8% was used as glassmaking sand. Foundry sand, filtration sand, whole grain fillers, and recreational sand ascribed to 7% of the utilized quantity. Other miscellaneous uses included chemicals, abrasives, roofing granules, ceramics, filtration gravel, silicon and ferrosilicon fillers, traction, and metallurgical flux, which held a 2% combined share, and another 2% were other unspecified applications. The raw materials supply is based on high-purity quartz reserves largely from hard rock mining operations, with U.S. quartz production remained steady at 200 kto between 2022 and 2023, according to the USGS 2024 report.
Industrial Sand & Gravel Salient Statistics (Data in Thousand Metric Tons)
|
Key Attributes: Industrial Sand containing 95% or more silica and <= 0.6% iron oxide |
2019 |
2020 |
2021 |
2022 |
2023 |
|
Sold or used |
108,000 |
75,800 |
91,200 |
114,000 |
130,000 |
|
Imports |
389 |
417 |
350 |
338 |
290 |
|
Exports |
5,590 |
4,070 |
5,400 |
6,350 |
7,500 |
|
Consumption |
103,000 |
72,100 |
86,200 |
108,000 |
120,000 |
|
Price, dollars/ metric ton |
46.00 |
29.50 |
40.80 |
45.30 |
54.00 |
|
Employment, quarry & mill |
7,500 |
4,500 |
5,300 |
6,000 |
6,100 |
Source: USGS
Key Industrial Silica Sand Market Insights Summary:
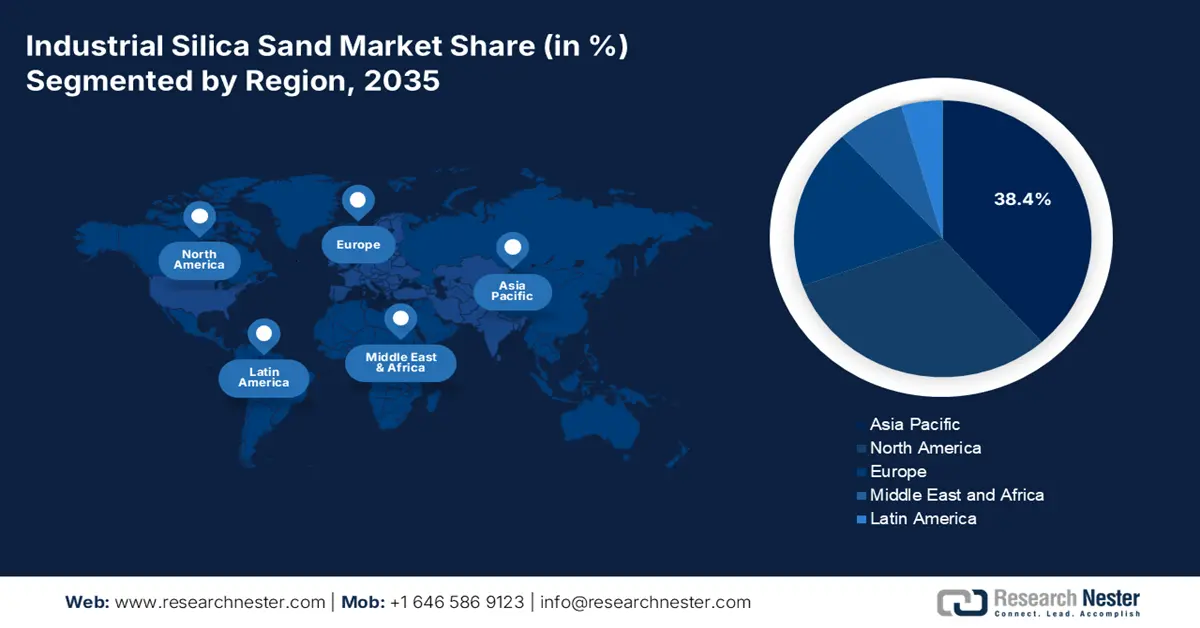
Regional Insights:
- By 2035, the Asia Pacific Industrial Silica Sand Market is projected to command 38.4% share, supported by rapid infrastructure expansion and growing glass and foundry capacity across China, India, Japan, and Southeast Asia.
- North America is expected to secure a 31.1% market share during 2026–2035, fueled by demand from glass manufacturing, hydraulic fracturing, and foundry applications.
Segment Insights:
- The glassmaking segment of the Industrial Silica Sand Market is projected to secure a 42.3% share by 2035, propelled by sustained demand for flat glass, container glass, and specialty glass across automotive, construction, and solar PV industries.
- The construction segment is anticipated to account for 34.3% share by 2035, underpinned by strong infrastructure spending, urban development, and rising adoption of green building materials.
Key Growth Trends:
- High demand from oil & gas industry
- Expansion in glass manufacturing
Major Challenges:
- Volatile raw material prices
- Health hazards and workplace liabilities
Key Players: U.S. Silica Holdings, Inc., Sibelco Group, Fairmount Santrol (now Covia Holdings Corp.), Toyota Tsusho Corporation, Badger Mining Corporation, Australian Silica Quartz Group Ltd, Quarzwerke Group, Short Mountain Silica, European Industrial Minerals Ltd, Syarikat Sebangun Sdn. Bhd., VRX Silica Limited, Premier Silica LLC, JFE Mineral Co., Ltd., Mitsubishi Corporation, Tochu Corporation
Global Industrial Silica Sand Market Forecast and Regional Outlook:
Market Size & Growth Projections:
- 2025 Market Size: USD 17 billion
- 2026 Market Size: USD 17.9 billion
- Projected Market Size: USD 29.6 billion by 2035
- Growth Forecasts: 5.7% CAGR (2026-2035)
Key Regional Dynamics:
- Largest Region: Asia Pacific (38.4% Share by 2035)
- Fastest Growing Region: Asia Pacific
- Dominating Countries: United States, China, Germany, Japan, India
- Emerging Countries: Vietnam, Indonesia, Brazil, Mexico, United Arab Emirates
Last updated on : 7 October, 2025
Industrial Silica Sand Market - Growth Drivers and Challenges
Growth Drivers
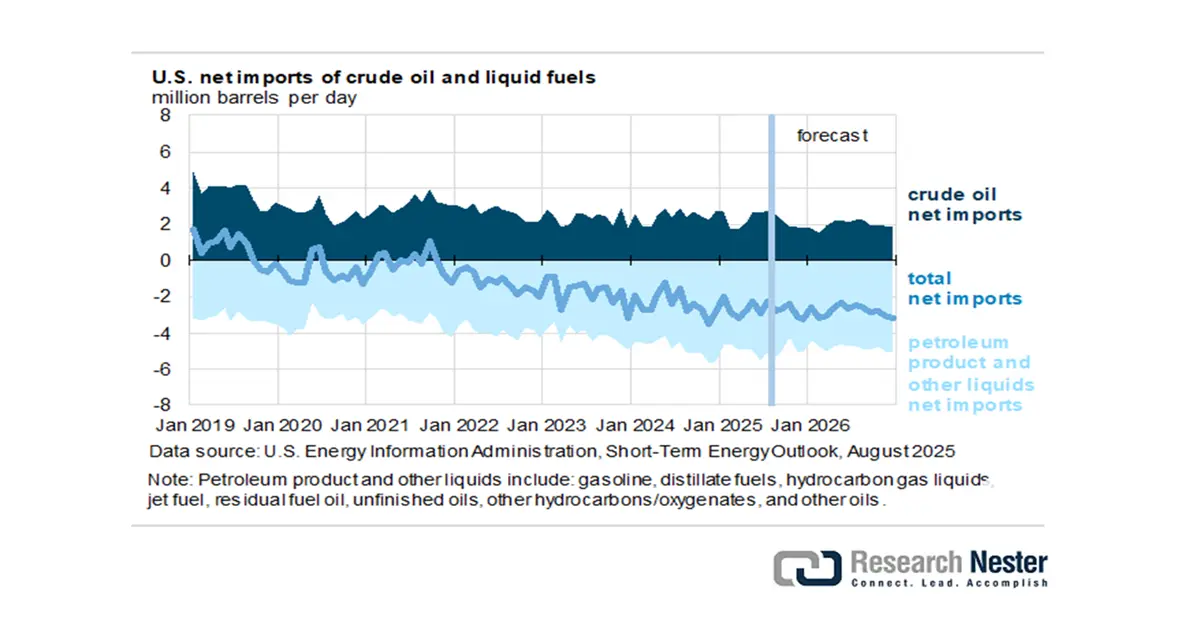
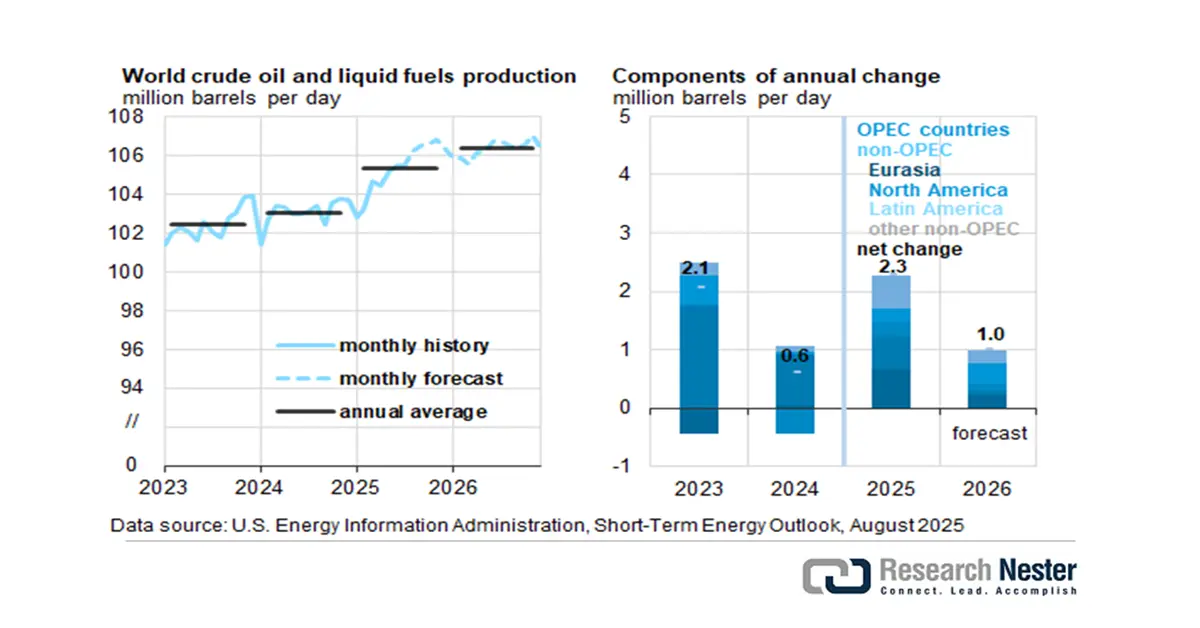
- High demand from oil & gas industry: Frac sand is widely used as a proppant during hydraulic fracturing of underground fissures in shale formations. Industrial silica allows the easy flow of oil and natural gas. The EIA noted an increase in the U.S. crude oil production at 13.6 million b/d in December 2025. However, with the slump in crude oil prices, U.S. producers are expected to accelerate the decline in drilling and will reach 13.1 million b/d by Q4 2026. The worldwide liquid fuels production grew to reach 2.0 million b/d on average in the second half of 2025, as compared with the first half. OPEC is set to contribute 50% of this increase. Non-OPEC manufacturers led by the U.S., Norway, Brazil, Canada, and Guyana render the other half.
U.S. Energy Information Administration, Short-Term Energy Outlook, August 2025
Source: EIA
At the same time, the world’s liquid fuels demand was up by 1.6 million b/d from the Q1 and Q2 of 2025. The inventory builds surpassed 1 million b/d for a sustained period of 1998, 2015, and 2020; crude oil prices decreased by 25% to 50%.
Oil Prices and Production, through 2026
|
Notable Forecast Changes |
2025 |
2026 |
|
Brent crude oil spot price (dollars per barrel) |
$67 |
$51 |
|
Previous forecast |
$69 |
$58 |
|
Percentage change |
-2.4% |
-12.0% |
|
Global oil inventory change (million barrels per day) |
1.6 |
1.4 |
|
Previous forecast |
1.1 |
1.1 |
|
Change |
0.6 |
0.3 |
|
OPEC+ crude oil production (million barrels per day) |
43.7 |
44.2 |
|
Previous forecast |
43.2 |
43.8 |
|
Percentage change |
1.0% |
0.9% |
|
U.S. crude oil production(million barrels per day) |
13.4 |
13.3 |
|
Previous forecast |
13.4 |
13.4 |
|
Percentage change |
0.3% |
-0.7% |
|
U.S. crude oil inventories (million barrels) |
433 |
448 |
|
Previous forecast |
405 |
400 |
|
Percentage change |
6.9% |
11.9% |
Source: EIA
Between 2020 and 2024, the U.S. crude oil and lease condensate production rose by 1.9 million barrels per day (b/d). Texas and New Mexico contribute to 93% of the production and the remaining producing areas in federal waters or offshore state, increased by just 130,000 b/d. Midland and Martin in Texas were responsible for 21% or 0.40 million b/d of the total crude oil produced in the U.S. Andrews, Howard, Glasscock, Loving, Ward, and Reagan—six other counties in Texas—grew by 0.36 million b/d.
Source: EIA
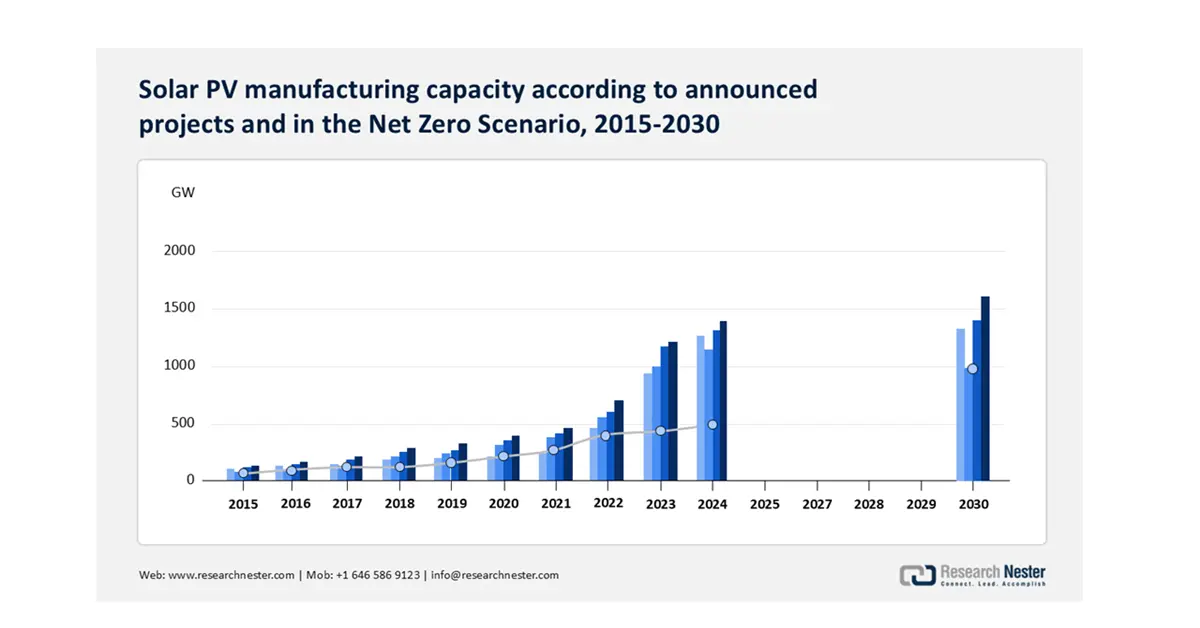
- Expansion in glass manufacturing: As silica sand is the main raw material used in the glass manufacturing process, there is a considerable demand for it. Global glass production is expected to reach over 210 million tonnes in 2022, according to the International Energy Agency (IEA). Urbanization and the growth of the building and packaging industries will continue to fuel demand for flat and container glass. The coming demand for silica is also driven by solar glass. The Solar Energy Industries Association (SEIA) predicts that solar installations with grow by 3% between 2028 and 2030, which implies more silica sand will be consumed to manufacture low-iron solar glass.
Source: IEA
Additionally, incentives for onshore production of critical items are aiding market growth. This impact is observed in solar components and modules manufacturing, via the 48C Advanced Energy Projects tax credit, granting USD 71 million to advance R&D and demonstration projects and USD 7 billion in solar deployment. Furthermore, First Solar in 2024 inaugurated its USD 1.1 billion solar PV module facility in Lawrence County, Alabama. This strategic initiative is anticipated to generate about 800 new jobs. First Solar, with the company's three operating facilities in Ohio and the new factory in Alabama, will vertically integrate its PV capacity. Favorable solar manufacturing has peaked the overall glass trade scenario.
Glass & Glassware Importers & Exporters, 2023
|
Country |
Import Value |
Export Value |
|
The U.S. |
USD 9.18 billion |
USD 6.44 billion |
|
China |
USD 6.93 billion |
USD 21.3 billion |
Challenges
- Volatile raw material prices: Market volatility due to varying costs of energy and transportation has produced prices for silica sand that point to fluctuation. For example, silica sand prices in the U.S. rose from USD 36 per ton in 2020 to more than USD 56 per ton in 2022, according to Statista, as a result of increases in freight rates and fuel prices. The market volatility affects profitability and long-term supply relationships, especially in segments like glass production, foundry, and hydraulic fracturing, where planning production and pricing is based on being able to nail down input costs.
- Health hazards and workplace liabilities: Respirable crystalline silica is a serious occupational risk. According to the CDC, U.S. workers are exposed to silica every year at work, which provides employers with potential claims and fines based on the demographics of employees who are exposed. OSHA also funded in operating silica-related penalties during the 2018-2023 reporting period. Companies can use dust suppression, personal protective equipment (PPE), and medical surveillance, each of which increases operating costs for employers. Also, the concept of strict liability makes the industry unattractive for new employers.
Industrial Silica Sand Market Size and Forecast:
| Report Attribute | Details |
|---|---|
|
Base Year |
2025 |
|
Forecast Year |
2026-2035 |
|
CAGR |
5.7% |
|
Base Year Market Size (2025) |
USD 17 billion |
|
Forecast Year Market Size (2035) |
USD 29.6 billion |
|
Regional Scope |
|
Industrial Silica Sand Market Segmentation:
Application Segment Analysis
The glassmaking segment is predicted to gain the largest industrial silica sand market share of 42.3% during the projected period by 2035, due to sustained demand for flat glass, container glass, and specialty glass primarily for the automotive, building & construction, and solar photovoltaic (PV) industries. The USGS noted that glassmaking consumes high-purity silica sand. The International Energy Agency (IEA) has indicated that solar PV installations are experiencing substantial growth worldwide. Photovoltaic glass modules will require substantial high-grade silica sand inputs for solar glass. Growth in glassmaking as a subsection of building & construction will be supported by further demand in Asia-Pacific, the Middle East, and ongoing construction glass demand driven by urbanization.
End Use Segment Analysis
The construction segment is anticipated to constitute the most significant growth by 2035, with 34.3% market share, mainly due to strong infrastructure spending and urban development, as well as green building materials, which are supporting construction demand. For instance, the U.S. Department of Transportation (USDOT) expects increasing demand for concrete, cement, and specialty construction materials that are produced and use silica sand. Furthermore, OECD reports expect global infrastructure investment to exceed USD 94 trillion by 2040, which is favorable for sand-based concrete and mortars.
Our in-depth analysis of the industrial silica sand market includes the following segments:
| Segment | Subsegment |
|
Application |
|
|
Product Type |
|
|
End use |
|

Vishnu Nair
Head - Global Business DevelopmentCustomize this report to your requirements — connect with our consultant for personalized insights and options.
Industrial Silica Sand Market - Regional Analysis
Asia Pacific Market Insights
By 2035, the Asia Pacific market is expected to hold 38.4% of the market share due to the rapid expansion of the infrastructure industry, and there are significant expansions in the glass and foundry industries in the region. The required silica sand is driven by Chinese demand, followed by India and Japan. The increased manufacturing of electronics and solar PV in Southeast Asia also enhances consumption. Sustained construction government spending in ASEAN nations will also elevate longer-term demand.
China dominates the market with a massive consumption of industrial silica sand, dominated by usage in glass, solar panels, and foundries. China's dominant position in photovoltaic manufacturing and flat glass manufacturing is the driving force for high silica sand demand. China is among the top three exporters of glass globally, owing to its high production capacity. According to a 2023 USITC report, new projects in the country were estimated to add 655,000 metric tons of annual new silicon metal capacity in Xinjiang and Inner Mongolia in 2022.
Silicon Metal: Quantity Of Exports from China, By Destination and Period (Quantity in short tons)
|
Destination Market |
2017 |
2018 |
2019 |
2020 |
2021 |
2022 |
|
Japan |
208,538 |
221,296 |
181,465 |
169,068 |
206,231 |
160,945 |
|
South Korea |
164,728 |
148,065 |
128,121 |
89,171 |
98,556 |
91,215 |
|
United Arab Emirates |
55,926 |
61,505 |
51,915 |
31,667 |
64,657 |
67,272 |
|
India |
57,260 |
64,592 |
57,144 |
56,093 |
65,993 |
65,722 |
|
Thailand |
72,887 |
52,767 |
55,147 |
63,236 |
78,028 |
54,345 |
|
Malaysia |
35,496 |
40,326 |
42,788 |
48,446 |
60,906 |
42,980 |
|
Netherlands |
37,284 |
34,720 |
30,186 |
25,012 |
39,767 |
40,945 |
|
Mexico |
35,184 |
34,893 |
30,113 |
25,447 |
25,778 |
28,230 |
|
Bahrain |
13,320 |
18,760 |
18,858 |
11,622 |
24,259 |
25,143 |
|
Qatar |
25,512 |
21,482 |
17,678 |
18,814 |
22,991 |
20,029 |
|
All other markets |
217,543 |
200,361 |
152,139 |
141,111 |
170,201 |
120,798 |
Source: USITC
India's industrial silica sand market is forecasted to hold a staggering revenue share during the analysis timeline. The strong construction sector growth is a significant driver, as would be the continuing expansion of glass production and the growth of the ceramics industry. Additionally, the government of India is introducing significant initiatives such as the PMAY scheme (Housing for All), and subsequent infrastructure corridors will elevate the consumption of silica sand. With India's focus on ramping up solar PV manufacturing, the consumption of high-purity silica sand will further increase.
North America Market Insights
North America industrial silica sand market is expected to hold 31.1% of the market share during 2026-2035. The glass manufacturing, hydraulic fracturing, and foundry industries drive demand for engineered quartz, glass, and hydraulic fracturing sands. The United States of America accounted for most regional production, with steady imports to Canada for glass and construction applications.
The industrial silica sand market in the U.S. is driven by the strong shale gas exploration, especially through hydraulic fracturing, glass production, and demand in solar PV glass. The domestic production in 2023 was primarily concentrated in Illinois, Texas, and Wisconsin, thus, driving the market. Frac sand, as it is still required for the lease of new shale gas developments, is the main sub-segment. The steady construction demand in the US energy and foundry sectors has also propelled solid growth.
The industrial silica sand market in Canada was estimated to grow due to a robust growth in glass manufacturing, construction, and oil sands processing. Fairly steady imports assist domestic production, especially when sourcing high-purity sand needed for float glass and chemical applications, with imports to Canada primarily from Ontario and Alberta. The Canadian market is projected to grow at a stable CAGR over the assessed timeline, resulting from Canada’s significant planned infrastructure investments and its emerging clean energy glass applications.
Europe Market Insights
The European market is expected to hold 18.7% of the market share due to major contributors to ethanol production being construction, glass production, and the foundry industries. The construction and demand from the automotive and electronics sectors drove demand in Germany and the UK. Consumption and production patterns traced through Member States are influenced by greater use of renewable energy, glass panels, increasing available capital, and new workplace silica dust laws under the EU OSH framework.
In 2025, Germany's market led in value due to quality production glass, the manufacture of solar photovoltaic panels, the use of foundry sand in automotive casting, and because Germany produced more than 10 million tonnes of silica sand in 2024. The silica sand deal has long contributed to process innovation in manufacturing in the automotive industry, and is driving demand for premium silica sand for manufacturing excellence.
Key Industrial Silica Sand Market Players:
- U.S. Silica Holdings, Inc.
- Company Overview
- Business Strategy
- Key Product Offerings
- Financial Performance
- Key Performance Indicators
- Risk Analysis
- Recent Development
- Regional Presence
- SWOT Analysis
- Sibelco Group
- Fairmount Santrol (now Covia Holdings Corp.)
- Toyota Tsusho Corporation
- Badger Mining Corporation
- Australian Silica Quartz Group Ltd
- Quarzwerke Group
- Short Mountain Silica
- European Industrial Minerals Ltd
- Syarikat Sebangun Sdn. Bhd.
- VRX Silica Limited
- Premier Silica LLC
- JFE Mineral Co., Ltd.
- Mitsubishi Corporation
- Tochu Corporation
The global industrial silica sand market is heavily consolidated, dominated by companies like U.S. Silica Holdings, Sibelco, and Covia Holdings, all of whom have strategic acquisitions, existing integrated supply chains, and substantial technological innovation. Similarly, Japanese companies - Toyota Tsusho, Mitsubishi Corporation, Tochu Corporation, etc. - focus on supplying high-purity silica, a critical component of the rapidly advancing electronics and automotive supply chains. Importantly, Australian companies are investing significantly in expanding their silica reserves to meet Asia Pacific demand, while Malaysian businesses are focused predominantly on an export-oriented mode of production. Major strategies for maintaining and growing the international industrial silica market include, capacity expansions, joint ventures for specialty silica grades of silica, and vertically integrating businesses to have access to raw materials and ensure cost and ultimately competitive advantages during an era of increased environmental regulation.
Some of the key players operating in the market are listed below:
Recent Developments
- In June 2024, Sibelco, a Belgian company, launched SibelClean Ultra-Pure Silica, a >99.9% SiO₂ sand that primarily targets semiconductor and solar PV glass markets. The EU Chips Act has rapidly boosted demand, but in Q2 2024, Sibelco reported a 7% YoY growth in contracts, primarily from demand in German and Dutch solar producers.
- Report ID: 3397
- Published Date: Oct 07, 2025
- Report Format: PDF, PPT
- Explore a preview of key market trends and insights
- Review sample data tables and segment breakdowns
- Experience the quality of our visual data representations
- Evaluate our report structure and research methodology
- Get a glimpse of competitive landscape analysis
- Understand how regional forecasts are presented
- Assess the depth of company profiling and benchmarking
- Preview how actionable insights can support your strategy
Explore real data and analysis
Frequently Asked Questions (FAQ)
About this Report
Connect with our Expert

Report, 2026-2035


Copyright @ 2026 Research Nester. All Rights Reserved.
