Industrial Distribution Market Outlook:
Industrial Distribution Market size was valued at USD 8.57 trillion in 2025 and is set to exceed USD 13.83 trillion by 2035, registering over 4.9% CAGR during the forecast period i.e., between 2026-2035. In the year 2026, the industry size of industrial distribution is estimated at USD 8.95 trillion.
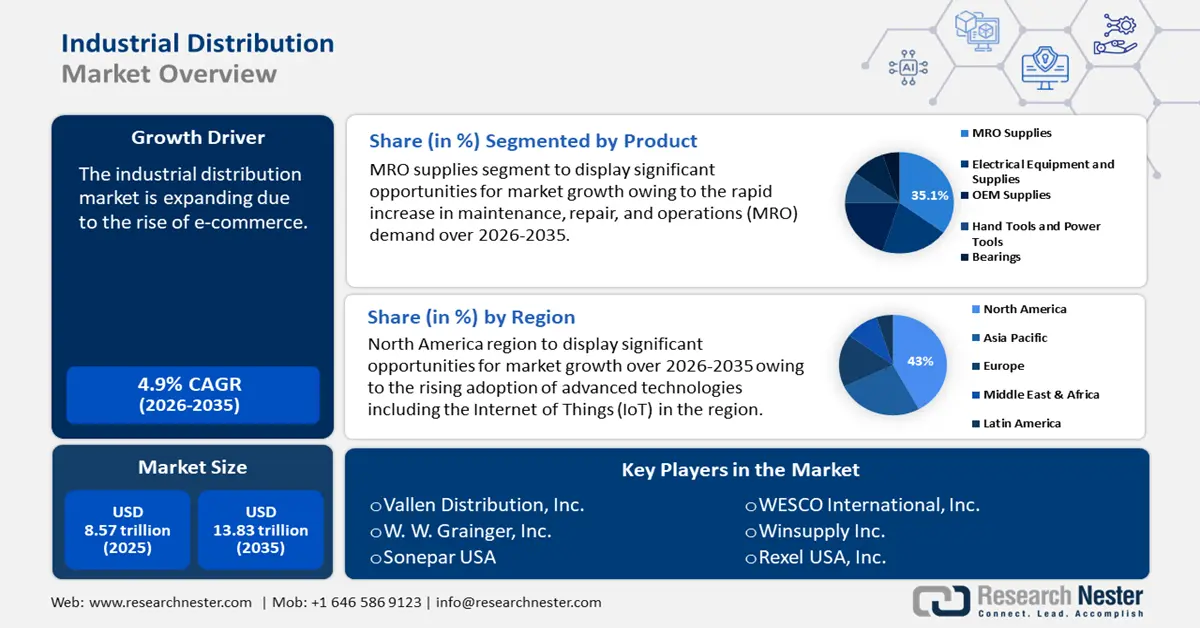
The growth of e-commerce is a major driver of the industrial distribution market. As online retail expands, there is a surging need for efficient and scalable distribution systems to handle increased order volumes, manage inventory, and ensure timely deliverables. Global retail e-commerce sales reached a total of USD 5.8 trillion in 2023. This number is expected to expand by 39% over the next few years, surpassing USD 8 trillion by 2027.
Additionally, as businesses expand their operations across borders, they require more sophisticated distribution networks to manage international supply chains efficiently. This includes handling cross-border logistics, complying with varying regulatory standards, and optimizing global inventory management. The need for reliable, scalable, and flexible distribution solutions to support global trade and supply chain complexities fuels growth in the industrial distribution market.
Key Industrial Distribution Market Market Insights Summary:
Regional Highlights:
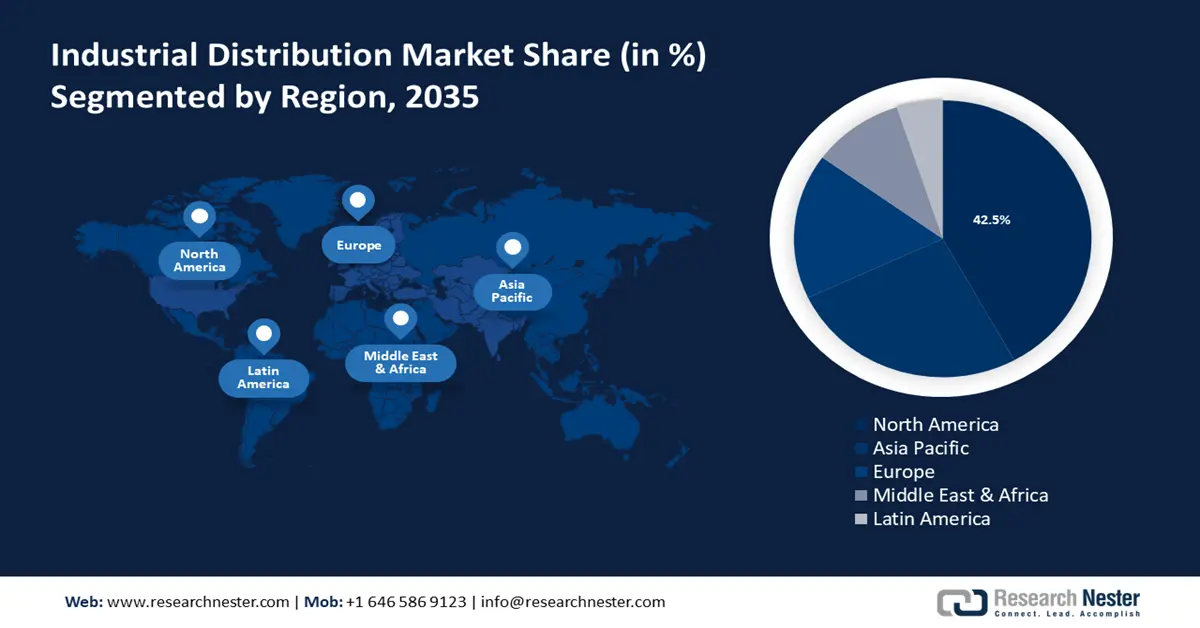
- The North America industrial distribution market will account for 43% share by 2035, driven by rising adoption of IoT across major industries.
- The Asia Pacific market will register significant growth during the forecast timeline, driven by rapid urbanization and industrialization across developing nations.
Segment Insights:
- The mro supplies segment in the industrial distribution market is projected to see significant growth till 2035, driven by the rapid increase in maintenance, repair, and operations demand.
- The offline segment in the industrial distribution market is anticipated to witness substantial growth till 2035, attributed to the increasing number of small and medium-sized enterprises globally.
Key Growth Trends:
- Artificial Intelligence (AI) driven innovation
- Growing importance of supply chain optimization
Major Challenges:
- Operational disruptions
- Varying regulations
Key Players: Vallen Distribution, Inc., W. W. Grainger, Inc., Sonepar USA, Air Liquide, WESCO International, Inc., Winsupply Inc., Rexel USA, Inc.
Global Industrial Distribution Market Market Forecast and Regional Outlook:
Market Size & Growth Projections:
- 2025 Market Size: USD 8.57 trillion
- 2026 Market Size: USD 8.95 trillion
- Projected Market Size: USD 13.83 trillion by 2035
- Growth Forecasts: 4.9% CAGR (2026-2035)
Key Regional Dynamics:
- Largest Region: North America (43% Share by 2035)
- Fastest Growing Region: Asia Pacific
- Dominating Countries: United States, China, Germany, Japan, United Kingdom
- Emerging Countries: China, India, Brazil, Mexico, Thailand
Last updated on : 18 September, 2025
Industrial Distribution Market Growth Drivers and Challenges:
Growth Drivers
- Artificial Intelligence (AI) driven innovation: AI algorithms analyze vast amounts of data to forecast demand, optimize inventory levels, and streamline supply chain operations. This helps in reducing excess inventory and minimizing stockouts. Moreover, AI helps in predicting equipment failures and scheduling maintenance proactively, reducing downtime and improving operational efficiency. AI-driven smart inventory management systems improve the operations of transportation companies. AI can help maintain ideal stock levels, eliminate surplus inventory, and reduce stockouts by evaluating inventory levels, demand trends, and supply chain dynamics. AI-powered inventory management can lower inventory expenditures by up to 15% while improving service levels by up to 35%.
- Growing importance of supply chain optimization: Supply chain optimization, which aims to increase productivity, reduce expenses, and accelerate product delivery, gives businesses a competitive edge in the manufacturing and industrial distribution of goods. For instance, companies with efficient supply networks experience over 12% reduction in expenses associated with the supply chain, and around 48% decrease in inventory compared to those who don't prioritize supply chain efficiency.
- Surging emphasis on sustainability: Logistics companies throughout the world are prioritizing carbon emissions reduction, which has resulted in the broad adoption of novel technologies such as renewable energy and green logistics, which combine managerial approaches with technology to create a more sustainable supply chain. Green logistics demand is expected to be over USD 50 billion by 2025, accounting for roughly 2% of total logistics spending, and is estimated to reach USD 350 billion by 2030.
Challenges
- Operational disruptions: Interruptions in supply chains due to travel restrictions during the COVID-19 pandemic, geopolitical tensions, and supply shortages have led to delays in production and delivery schedules, affecting the efficiency of distribution networks and causing delays in getting products to market. However, the industrial distribution market is recovering from the pandemic setback and is set to showcase promising growth opportunities in the future.
- Varying regulations: Several laws and rules governing several areas, including trade, transportation, environmental protection, and product safety, apply to industrial distribution, and in compliance with these rules, industrial distributors are required to uphold strict standards of quality and safety throughout their operations. The complexity of regulations affecting the industrial distribution sector will only increase, which may take a lot of work and resources to keep up with these changes, and also frequently takes attention away from essential business operations.
Industrial Distribution Market Size and Forecast:
| Report Attribute | Details |
|---|---|
|
Base Year |
2025 |
|
Forecast Period |
2026-2035 |
|
CAGR |
4.9% |
|
Base Year Market Size (2025) |
USD 8.57 trillion |
|
Forecast Year Market Size (2035) |
USD 13.83 trillion |
|
Regional Scope |
|
Industrial Distribution Market Segmentation:
Product Segment Analysis
The MRO supplies segment is expected to garner the highest share of 35.1% in the industrial distribution market on account of the rapid increase in maintenance, repair, and operations (MRO) demand. For instance, the global need for MRO is projected to rise from USD 68 billion in 2021 to over USD 115 billion by 2031. As industries expand and modernize, the demand for MRO supplies grows to support new and existing machinery. Furthermore, companies are increasingly adopting preventive maintenance practices to avoid costly breakdowns, leading to higher consumption of MRO supplies.
Application Segment Analysis
The offline segment in the industrial distribution market is estimated to gather substantial CAGR by the end of 2035. The segment expansion is due to the increasing number of small businesses across the globe. Particularly, in 2021, there were projected to be around 332 million small and medium-sized business enterprises (SMEs) globally. Significant growth in the offline industrial distribution market can be witnessed due to the presence of many smaller enterprises. This provides a sensible, cost-effective means to connect with other organizations, and is considered the most effective strategy to outsource supply chain management or assist in lowering a customer's total cost or ownership.
Our in-depth analysis of the industrial distribution market includes the following segments:
|
Product |
|
|
Application |
|
|
Industry Type |
|

Vishnu Nair
Head - Global Business DevelopmentCustomize this report to your requirements — connect with our consultant for personalized insights and options.
Industrial Distribution Market Regional Analysis:
North America Market Insights
North America industry is estimated to dominate majority revenue share of 43% by 2035. The growth in the region is credited to the rising adoption of advanced technologies including the Internet of Things (IoT). Manufacturing, healthcare, energy, transportation, and retail sectors in North America utilize IoT analytics to optimize inventory levels and increase supply chain effectiveness. Almost 55% of businesses in North America employ IoT technology for business-related activities.
The U.S. has tremendous growth potential in the logistics industry due to its established logistics infrastructure and improved industrialization, which are expected to drive market expansion. Business logistics expenses in the United States reached a new high of USD 2 trillion in 2022, accounting for over 9% of the country's GDP.
The market in Canada will be led by surging investments by the government to fortify the nation's supply networks. In April 2022, the Ontario government announced an investment of over USD 5 million in the Ontario Automotive Modernization Program, to enhance competitiveness and support the province's auto-parts supply chain.
APAC Market Insights
Asia Pacific region is likely to observe significant growth till 2035, owing to rapid urbanization, and industrialization. Asia is set to undergo a period of unprecedented urbanization, which might increase demand for industrial distribution by driving up city-based consumption of goods and services. According to the World Bank, with an average yearly urbanization rate of 3%, East Asia and the Pacific are the regions that are urbanizing the fastest in the world.
Japan is expected to lead the world in automation, robotics utilization, and integrating artificial intelligence into everyday life in several industries including food, medicines, and logistics. This may drive the market demand for industrial distribution.
Similarly, China has quickly emerged as the world leader in automation and aspires to be the global leader in robotics once it achieves self-sufficiency in the sector. Moreover, large-scale infrastructure projects, such as transportation networks and urban development, are driving the need for industrial products and services.
South Korea has a highly developed manufacturing sector, including industries such as electronics, automotive, and shipbuilding, which drives demand for industrial products and services. The market in the country is robust and expanding, supported by its advanced manufacturing capabilities, technological advancements, and strategic infrastructure investments.
Industrial Distribution Market Players:
- Stellar Industries, Inc.
- Company Overview
- Business Strategy
- Key Product Offerings
- Financial Performance
- Key Performance Indicators
- Risk Analysis
- Recent Development
- Regional Presence
- SWOT Analysis
- Vallen Distribution, Inc.
- W. W. Grainger, Inc.
- Sonepar USA
- Air Liquide
- WESCO International, Inc.
- Winsupply Inc.
- Rexel USA, Inc.
The competitive landscape of the industrial distribution market is characterized by the dynamic interaction of several factors that influence market positioning and strategy. Key considerations include an increased emphasis on technical advancements like automation and data analytics, which improve operational efficiency and inventory management.
Recent Developments
- In July 2024, Stellar Industries, Inc. announced the acquisition of Eagan, Minnesota-based personal protection equipment distributor to expand their product, and geographical reach and increase knowledge in the safety goods sector.
- In July 2024, Vallen Distribution, Inc. a global leader in optimized indirect industrial supply chain solutions acquired Eastland Engineering Supply from MML Growth Capital Partners Ireland to be in a position to invest in cutting-edge solutions that promote success for clients and suppliers globally, as well as to deliver top-tier supply chain services and offerings to the market.
- Report ID: 6365
- Published Date: Sep 18, 2025
- Report Format: PDF, PPT
- Explore a preview of key market trends and insights
- Review sample data tables and segment breakdowns
- Experience the quality of our visual data representations
- Evaluate our report structure and research methodology
- Get a glimpse of competitive landscape analysis
- Understand how regional forecasts are presented
- Assess the depth of company profiling and benchmarking
- Preview how actionable insights can support your strategy
Explore real data and analysis
Frequently Asked Questions (FAQ)
Free Sample includes current and historical market size, growth trends, regional charts & tables, company profiles, segment-wise forecasts, and more.
Connect with our Expert


Copyright @ 2026 Research Nester. All Rights Reserved.
