Incremental Encoders Market Outlook:
Incremental Encoders Market size was over USD 4.23 billion in 2025 and is poised to exceed USD 10.87 billion by 2035, growing at over 9.9% CAGR during the forecast period i.e., between 2026-2035. In the year 2026, the industry size of incremental encoders is estimated at USD 4.61 billion.
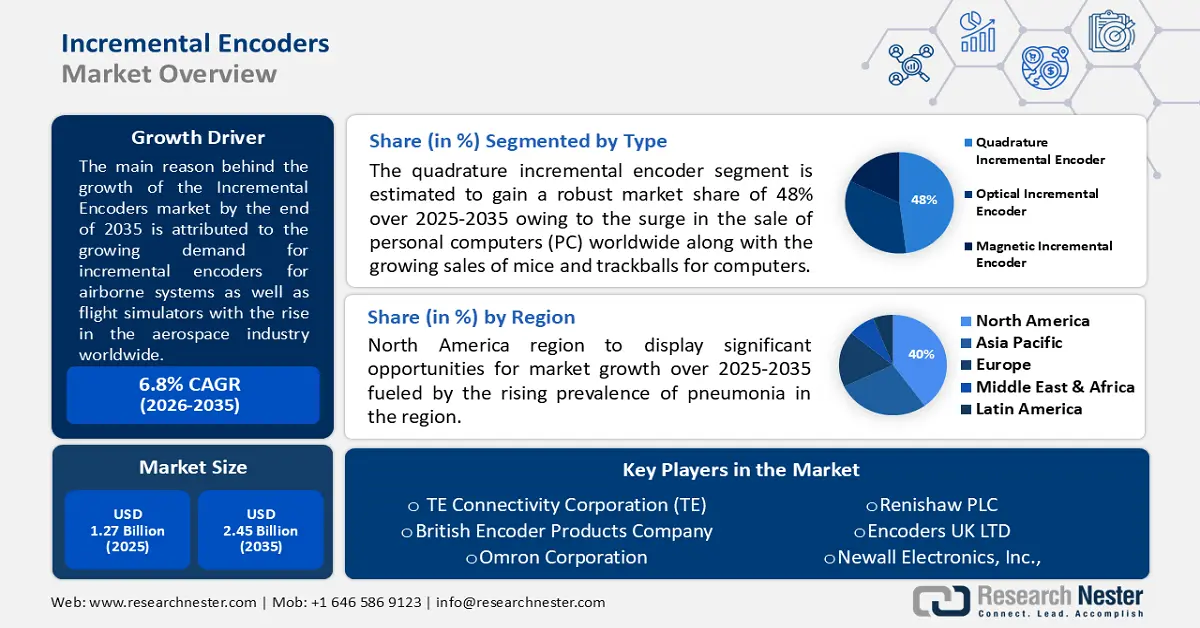
The growth of the market can primarily be attributed to the growing demand for incremental encoders for airborne systems as well as flight simulators with the rise in the aerospace industry worldwide. For instance, it was found that, the revenue of global commercial aerospace and defense (A&D) industry accounted for more than USD 700 billion in 2021
Encoders are used in machinery for motion feedback and motion control. They are found in machinery in all industries. The encoder sends a feedback signal that can be used to determine position, count, speed, or direction. A control device can use this information to send a command for a particular function. The demand for incremental encoders is on the rise in the automotive industry, which in turn, is expected to create massive revenue generation opportunities for the key players operating in the global incremental encoders market during the forecast period.
Key Incremental Encoders Market Insights Summary:
Regional Insights:
- North America is predicted to hold a 40% revenue share by 2035, impelled by a robust maritime network, rising port employment, and economic growth from marine transportation.
Segment Insights:
- Quadrature incremental encoder segment is projected to account for the largest revenue share by 2031, propelled by the surge in global PC sales and rising demand for mice and trackballs.
Key Growth Trends:
- Growing Textile Industries
- Increasing Investment in Robotics
Major Challenges:
- Possibility of Losing the Results Without an Electrical Supply
- Monitors only Distance or Speed
Key Players: British Encoder Products Company, Omron Corporation, Renishaw PLC, Encoders UK LTD, Newall Electronics, Inc., Dynapar Corporation, Fraba B.V., Gurley Precision Instruments Inc., Sensata Technologies Inc.
Global Incremental Encoders Market Forecast and Regional Outlook:
Market Size & Growth Projections:
- 2025 Market Size: USD 4.23 billion
- 2026 Market Size: USD 4.61 billion
- Projected Market Size: USD 10.87 billion by 2035
- Growth Forecasts: 9.9%
Key Regional Dynamics:
- Largest Region: North America (40% Share by 2035)
- Fastest Growing Region: North America
- Dominating Countries: China, India, Japan, U.S., Germany
- Emerging Countries: Brazil, Mexico, South Korea, Canada, Australia
Last updated on : 21 November, 2025
Incremental Encoders Market - Growth Drivers and Challenges
Growth Drivers
-
Growing Textile Industries – Textile industries are driving the demand for incremental encoders. In textile manufacturing machinery, encoders provide critical feedback for speed, direction, and distance. Hence, with the boom in the textile industry in the forecasted period, the demand for incremental encoders is also expected to escalate. It was found that, in the year 2021, the Indian textile industry was valued at more than USD 220 billion.
-
Increasing Investment in Robotics – In 2021, robotic startup investments accounted for over USD 17 billion.
-
Increasing Automation in Manufacturing Industry – As automating different tasks can raise productivity to grow at 1.4% annually. It was estimated that, by 2030, the use of automation in 3 key industries including manufacturing will contribute more than USD 15.5 trillion to the world economy.
-
Upsurge in the Food and Beverages Industry – The output of India’s food processing sector is expected to be more than USD 500 billion by 2025-26.
-
Growing Sales of the Automotive Industry - It is estimated that the unit sales volumes of the automotive industry to be around 78 million units in 2022 worldwide.
Challenges
- Possibility of Losing the Results Without an Electrical Supply – as an encoder being a sensing device provides feedback results. Encoders convert the motion to an electrical signal that can be read by some type of control device in a motion control system and this process can be hampered without a continuous electrical supply.
- Monitors only Distance or Speed
- Concern about Setting a Reference Point
Incremental Encoders Market Size and Forecast:
| Report Attribute | Details |
|---|---|
|
Base Year |
2025 |
|
Forecast Year |
2026-2035 |
|
CAGR |
9.9% |
|
Base Year Market Size (2025) |
USD 4.23 billion |
|
Forecast Year Market Size (2035) |
USD 10.87 billion |
|
Regional Scope |
|
Incremental Encoders Market Segmentation:
Type Segment Analysis
The global incremental encoders market is segmented and analyzed for demand and supply by type into quadrature incremental encoder, optical incremental encoder, and magnetic incremental encoder. Amongst these segments, the quadrature incremental encoder segment is anticipated to garner the largest revenue by the end of 2031, backed by the surge in the sale of personal computers (PC) worldwide along with the growing sales of mice and trackballs for computers. For instance, it was found that more than 72 million PCs were shipped globally in the second quarter of 2022.
Our in-depth analysis of the global market includes the following segments:
|
By Type |
|
|
By Application |
|

Vishnu Nair
Head - Global Business DevelopmentCustomize this report to your requirements — connect with our consultant for personalized insights and options.
Incremental Encoders Market - Regional Analysis
North American Market Insights
North America industry is anticipated to dominate majority revenue share of 40% by 2035, backed by the presence of a strong maritime network in the region, a growing number of jobs on ports, as well as the rising economy generated from marine transportation. For instance, as per the 2022 data, ports in the United States support over 13 million jobs, whereas ships move USD 1.5 trillion in and out of the country's ports annually. Also, also 75% of all trade involves some form of marine transportation in the United States.

Incremental Encoders Market Players:
-
TE Connectivity Corporation (TE)
- Company Overview
- Business Strategy
- Key Product Offerings
- Financial Performance
- Key Performance Indicators
- Risk Analysis
- Recent Development
- Regional Presence
- SWOT Analysis
- British Encoder Products Company
- Omron Corporation
- Renishaw PLC
- Encoders UK LTD
- Newall Electronics, Inc.,
- Dynapar Corporation
- Fraba B.V.
- Gurley Precision Instruments Inc.
- Sensata Technologies Inc.
Recent Developments
-
TE Connectivity Corporation (TE) - introduced the KMA36 Magnetic Encoder IC, based on Anisotropic Magnetoresistive (AMR) technology.
-
Renishaw PLC - launched the QUANTiC encoder series for linear axes which offers exceptionally wide installation tolerances and axis speeds of up to 24 m/s.
- Report ID: 4343
- Published Date: Nov 21, 2025
- Report Format: PDF, PPT
- Explore a preview of key market trends and insights
- Review sample data tables and segment breakdowns
- Experience the quality of our visual data representations
- Evaluate our report structure and research methodology
- Get a glimpse of competitive landscape analysis
- Understand how regional forecasts are presented
- Assess the depth of company profiling and benchmarking
- Preview how actionable insights can support your strategy
Explore real data and analysis
Frequently Asked Questions (FAQ)
Incremental Encoders Market Report Scope
Free Sample includes current and historical market size, growth trends, regional charts & tables, company profiles, segment-wise forecasts, and more.
Connect with our Expert


Copyright @ 2026 Research Nester. All Rights Reserved.
