Hydraulic Surgical Tables Market Outlook:
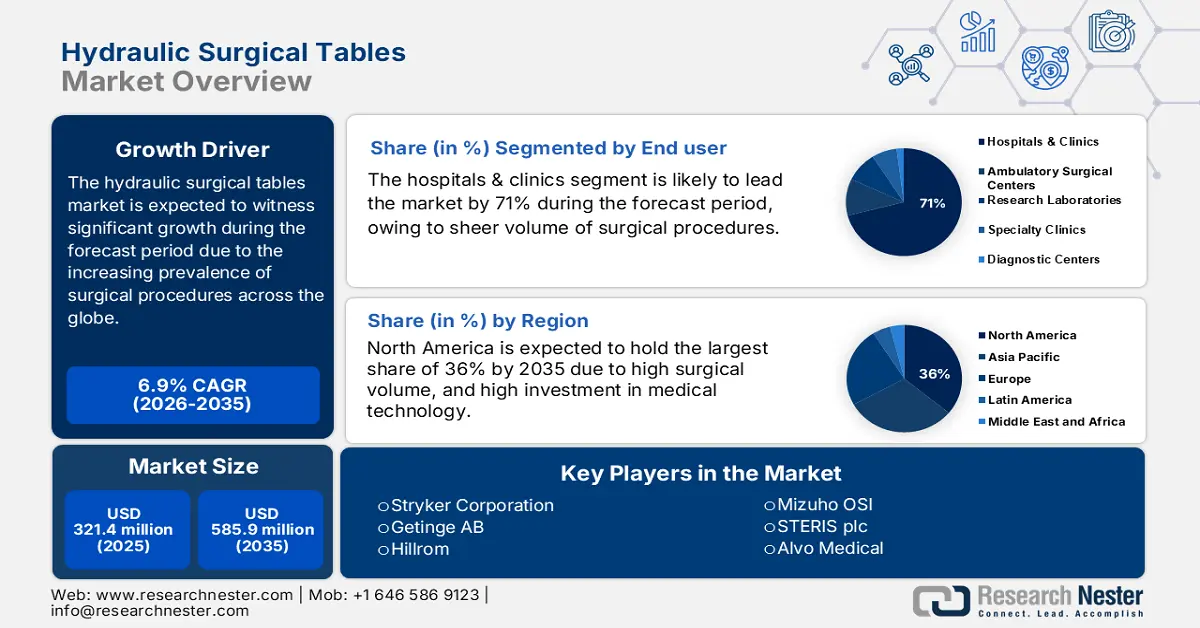
Hydraulic Surgical Tables Market size is valued at USD 321.4 million in 2025 and is projected to reach USD 585.9 million by the end of 2035, rising at a CAGR of 6.9% during the forecast period, i.e., 2026-2035. In 2026, the industry size of hydraulic surgical tables is estimated at USD 343.5 million.
The market is growing, depending on the increasing prevalence of surgical procedures across the globe, owing to an aging population and the advancement of medical technologies. According to a report by NLM in August 2025, surgical needs continued to grow, reaching at least 160 million operations per year. The patient pool needing surgical interventions crosses boundaries from orthopedics to neurosurgery to general surgery. The supply chain for the suitable market goes through several stages, from raw material procurement, manufacturing, and finally, distribution. Their key components, such as hydraulic systems, electronic controls, and ergonomic surfaces, are procured from special suppliers.
Moreover, trade dynamics play a significant role in countries such as Germany, the U.S., and China, which have considerable exports of medical equipment. Surgical tables constitute one important trade good manipulated with respect to laws on tariffs or imports applied to the demand for statutes. The PPI for medical equipment, including surgical tables, shows a trend in price changes related to the cost of manufacturing of the market. According to a report by NLM in August 2025, high-quality surgical care continues to be an urgent issue shared around the world, with 3.5 million adults dying every year after surgery. More and more advanced hydraulic surgical tables that will enable better surgical precision and patient safety are needed worldwide.
Key Hydraulic Surgical Tables Market Insights Summary:
Regional Highlights:
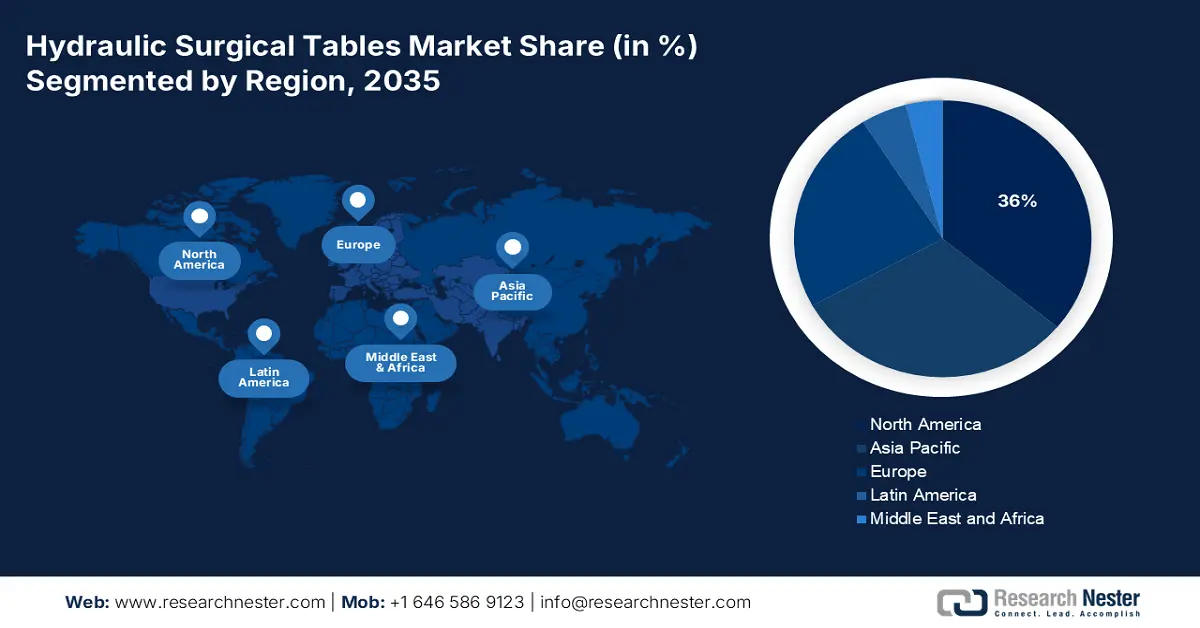
- The North America hydraulic surgical tables market is projected to hold the highest share of 36% through the forecast period, supported by advanced healthcare infrastructure, high surgical volumes, and growing adoption of minimally invasive surgeries.
- The Europe market is expected to register the fastest growth from 2026 to 2035, propelled by significant healthcare investments, aging demographics, and rapid adoption of innovative surgical technologies.
Segment Insights:
- The hospitals and clinics sub-segment of the hydraulic surgical tables market is projected to command around 71% of total revenue share by 2035, driven by the high volume of surgical procedures and the rising need for versatile, durable equipment across multiple surgical specialties.
- The hydraulic surgical tables type segment is anticipated to hold the largest share by 2035, supported by their performance reliability in environments with unstable electricity and the growing surgical demand requiring precise and stable patient positioning.
Key Growth Trends:
- Increasing surgical procedure volume
- Advancements in surgical technology
Major Challenges:
- High initial investment costs
- Maintenance and technical support
Key Players: Stryker Corporation, Getinge AB, Hillrom (Baxter), Mizuho OSI, STERIS plc, Alvo Medical, Skytron LLC, Trumpf Medical, Schaerer Medical, Lojer Group, Maquet (Getinge Subsidiary), Famed Żywiec, Medifa-hesse GmbH, Shimadzu Corporation, Mindray Medical
Global Hydraulic Surgical Tables Market Forecast and Regional Outlook:
Market Size & Growth Projections:
- 2025 Market Size: USD 321.4 million
- 2026 Market Size: USD 343.5 million
- Projected Market Size: USD 585.9 million by 2035
- Growth Forecasts: 6.9% CAGR (2026-2035)
Key Regional Dynamics:
- Largest Region:North America (36% Share by 2035)
- Fastest Growing Region: Europe
- Dominating Countries: United States, Germany, France, Japan, United Kingdom
- Emerging Countries: India, China, South Korea, Brazil, Indonesia
Last updated on : 6 October, 2025
Hydraulic Surgical Tables Market - Growth Drivers and Challenges
Growth Drivers
- Increasing surgical procedure volume: Rising surgical procedures worldwide are a growth driver for the market. According to the report by NLM January 2025, with just 28% to 32% portion of the world's disease burden being surgery, approximately 5 billion people lack access to safe, affordable surgical and anesthesia care. This huge unmet need, coupled with the aging population and increasing incidence of chronic diseases, has fostered a need for surgical infrastructure upgrades around the world. An advanced hydraulic surgical table is needed with each passing day by the industry that provides improved patient positioning and safety.
- Advancements in surgical technology: The integration of sophisticated technologies into surgical operations is driving the demand for hydraulic surgical tables. As per a report by ISAPS in September 2022, the global market is witnessing growth in plastic surgery procedures, shown by an 11.2% increase with over 14.9 million surgical and 18.8 million non-surgical procedures performed worldwide in that year. This growth follows the global trend in minimally invasive and precision surgeries, which requires High Adjustability and Stability of surgical tables, increasing the market. Innovations, such as the FDA-approved robot-assisted surgical tables, further increase operating efficiency and patient safety, compelling healthcare providers to invest in State-of-the-Art hydraulic systems.
- Economic efficiency and cost savings: Certain economic factors favor the installation of healthcare setup installations for hydraulic surgical tables. Hydraulic tables offer additional savings for hospitals and surgical centers seeking to improve patient outcomes while reducing operating costs through their longer lifespan and lower maintenance requirements. In April 2023, Getinge launched the Maquet Corin, a smart and connected operating room (OR) table designed to make life easier for surgical teams and improve safety in the operating room, with all such reductions in time spent translating to reduced downtime on operational activities. Fewer breakdowns contribute to fewer disruptions in surgical scheduling and, consequently, result in a smoother workflow, as well as better allocation of resources within healthcare facilities, with the increasing market.
Countries in Medical Furniture Exports and Imports in 2023
|
Exporters of Medical Furniture (2023) |
Value (USD) |
Importers of Medical Furniture (2023) |
Value (USD) |
|
Germany |
709 million |
Germany |
340 billion |
|
Poland |
239 million |
Netherlands |
255 billion |
|
U.S. |
757 million |
U.S. |
1.17 billion |
|
Mexico |
214 million |
Canada |
333 million |
|
China |
1.39 million |
Japan |
96.9 million |
|
Taipei |
157 million |
Saudi Arabia |
95.6 million |
|
Australia |
164 million |
Australia |
164 million |
|
Brazil |
31.1 million |
Brazil |
31.1 million |
Source: OEC
Challenges
- High initial investment costs: Hydraulic surgery tables often involve significant financial investment due to their typically high purchase costs. Smaller hospitals and clinics with fewer or limited resources take this obstacle into account. Due to budget constraints, some healthcare providers feel hesitant to invest in such advanced surgical tables even though their benefits are well recognized. This challenge becomes amplified in underdeveloped areas where there is scarce allocation for health. Also, since these are big bucks indeed, the less we can risk that most hospitals keep on using antiquated machinery, which is their main hindrance to enhancing surgical efficiency and patient safety. Hence, the adoption rates are restrained, directly affecting the market growth of the market.
- Maintenance and technical support: Maintenance by highly skilled and expert professionals is very necessary to keep the surgical hydraulic table fully functional and patients safe. Due to budget constraints, some healthcare providers feel hesitant to invest in such advanced surgical tables even though their benefits are well recognized. This challenge becomes amplified in underdeveloped areas where there is scarce allocation for health. Also, since these are big bucks indeed, the less we can risk that most hospitals keep on using antiquated machinery, which is their main hindrance to enhancing surgical efficiency and patient safety. Hence, the adoption rates are restrained, directly affecting downstream market growth. So, the quality trade-off remains an issue for stakeholders.
Hydraulic Surgical Tables Market Size and Forecast:
| Report Attribute | Details |
|---|---|
|
Base Year |
2025 |
|
Forecast Year |
2026-2035 |
|
CAGR |
6.9% |
|
Base Year Market Size (2025) |
USD 321.4 million |
|
Forecast Year Market Size (2035) |
USD 585.9 million |
|
Regional Scope |
|
Hydraulic Surgical Tables Market Segmentation:
End user Segment Analysis
The hospitals and clinics sub-segment in end user segment is projected to dominate the market, accounting for approximately 71% of the total revenue share by 2035. One of the reasons for such dominance is the sheer volume of surgical procedures carried out in those settings. According to the Centers for Disease Control and Prevention (CDC) in October 2024, 30.5 million patients were cared for at health centers, indicating the demand for advanced surgical equipment in 2022. This shows that hospitals and clinics needed surgical tables that were versatile and durable so as to fit various surgical specialties, such as orthopedics, neurosurgery, and cardiovascular procedures.
Type Segment Analysis
The hydraulic surgical tables type segment is anticipated to hold the largest market share in the market by 2035. The NIH states that hydraulic systems are preferred for performance reliability in work settings where voltage fluctuations can influence electronic devices, and so are favored in areas with erratic electricity supply. Additionally, according to the Centers for Disease Control and Prevention (CDC) in October 2024, around 349.4 visits per 1,000 adults to health centers were reported in 2022, staged by October 2024, showcasing the growing influx and the surgical demand tuning up toward the requirement for reliable surgical instruments. Such tables ensure smooth and precise adjustments to height and tilt, which is better for optimal patient positioning during surgery.
Product Configuration Segment Analysis
The multi-position tables configuration segment is projected to capture the highest revenue share in the product configuration of the market by 2035. These tables come with multi-purpose positioning capabilities, being suitable for almost any surgical procedure. They contribute positively to accuracy in surgeries and patient safety by carefully positioning the patient, an important factor in complex surgeries, affording them a wide scope of use in surgical specialties such as orthopedics, neurological procedures, and general surgical practices. The present innovations aimed at increasing their ergonomic value and ease of working with them also remain a persuasive factor for their growing demand in the market.
Our in-depth analysis of the global hydraulic surgical tables includes the following segments:
|
Segment |
Subsegments |
|
Type |
|
|
Application |
|
|
End user |
|
|
Technology |
|
|
Distribution Channel |
|
|
Product Configuration |
|

Vishnu Nair
Head - Global Business DevelopmentCustomize this report to your requirements — connect with our consultant for personalized insights and options.
Hydraulic Surgical Tables Market - Regional Analysis
North America Market Insights
The North America is expected to hold the highest market share of 36% within the forecast period due to the advanced healthcare infrastructure, high surgical volume, and high investment in medical technology. As per a report by the U.S. Bureau of Labor Statistics in August 2025, the producer price index for medical, surgical, and personal aid devices increased modestly by 1.5% from August 2024 to August 2025, indicating stability in price trends in this industry. Further driving the acceptance of advanced hydraulic surgical tables in North America is the rising need for minimally invasive surgeries.
The hydraulic surgical tables market in the U.S. is growing due to the increased surgical operation volumes and regulatory approvals of the advanced medical devices. According to the Centers for Disease Control and Prevention (CDC) in October 2024, during 2022, adult patients made an estimated 89.5 million visits to health centers in the country, corresponding to a rate of 349.4 visits per 1,000 adults. This brought the demand for reliable surgical equipment. Furthermore, the FDA continues approving innovative surgical tables that come with advanced safety features. Government initiatives aimed at improving surgical care quality and patient outcomes further propel this market.
The hydraulic surgical tables market in Canada is growing due to expanding healthcare services and increasing surgical procedures amid an aging population. As per a report by Statistics Canada in September 2024, irrespective of the total population, about 7.6 million people in Canada were in their 65+ age group in 2023, which is an example of roughly one-fifth (18.9%) of the total population, alongside a greater demand for surgical care. As stated by the Canadian Institute for Health Information, hospital-based surgeries witnessed a rising trend from 2022 to 2024. Meanwhile, the government's investments in healthcare infrastructure and digital health solutions align with market demand for state-of-the-art hydraulic surgical tables. The focus on promoting patient safety and surgical precision constrains market growth.
Europe Market Insights
The hydraulic surgical tables market in Europe is expected to hold the fastest-growing market share within the forecast period due to increasing investments in healthcare, the aging population, and newer surgical technologies. According to the report by Eurostat in November 2024, Germany (12.6%), France (11.9%), and Austria (11.2%) accounted for the highest share of current healthcare expenditure as a percentage of GDP in 2022 within the EU nations. The rising popularity of minimally invasive surgeries is further accelerating the demand for versatile surgical tables. Huge funds have been injected into medical research and innovation under the Horizon 2020 program of the European Union, fast-tracking endeavors to develop and adopt advanced surgical technologies.
The hydraulic surgical tables market in the UK is growing due to ongoing development efforts and a spike in surgical procedures being carried out in the hospital systems across the country. The NHS Long Term Plan, published in 2019, has ways to enhance patient care, such as the adoption of modern medical technologies. According to the report by ONS in April 2025, UK health care expenditure stood at about £317 billion in 2024. As a result of this, the NHS has been able to invest in the latest surgical instruments aimed at improving surgical accuracy and patient outcomes. Furthermore, the aging population of the UK is also contributing to a higher frequency of surgeries, thereby raising the demand for good surgical tables.
The hydraulic surgical tables market in Germany is growing as surgical infrastructure is being strengthened with an increase in the volume of surgeries. It possesses the most advanced healthcare system in Europe, boasting many hospitals and paramedical centers. According to the report by Eurostat in November 2024, having the highest current healthcare expenditure within EU nations, amounting to €489 billion in 2022, the country has witnessed an escalating demand for surgical equipment. In addition, Germany encourages medical research and innovation with active contributions from both public and private sectors, and, thereby, the development and use of the latest surgical technologies.
Historical Healthcare Expenditure of the Countries in Europe (2022)
|
Year |
Germany |
France |
Italy |
Spain |
Netherlands |
Ireland |
Belgium |
Greece |
|
2016 |
352,397 |
256,712 |
147,963 |
108,033 |
72,918 |
20,181 |
46,420 |
14,934 |
|
2017 |
370,023 |
261,004 |
150,697 |
113,702 |
74,614 |
21,216 |
48,071 |
14,391 |
|
2018 |
386,132 |
264,935 |
153,790 |
120,034 |
78,553 |
22,460 |
49,967 |
15,831 |
|
2019 |
407,025 |
270,562 |
155,524 |
126,700 |
82,447 |
23,931 |
51,504 |
15,716 |
|
2020 |
431,941 |
279,815 |
159,892 |
130,973 |
89,399 |
26,505 |
51,902 |
16,670 |
|
2021 |
466,713 |
307,680 |
170,278 |
131,114 |
96,821 |
28,632 |
56,112 |
17,462 |
|
2022 |
488,677 |
313,574 |
175,719 |
139,097 |
100,427 |
30,983 |
59,626 |
Source: Eurostat
Asia Pacific Market Insights
The hydraulic surgical tables market in the Asia Pacific region is expected to grow steadily within the forecast period, driven by increased healthcare investments, rising surgical volumes, and advancing medical technology. According to the report by UNFPA in 2025, by 2050, 1 in 4 persons in Asia and the Pacific will be aged above 60 years, one of the factors causing increased surgical procedures, judging from the incidences of chronic diseases and the number of older people in the Asia-Pacific, is expected to be 1.3 billion by 2050. This trend is supported further by national health care initiatives to build good surgical infrastructures and reasonably affordable access to quality care. With the adoption of minimally invasive surgeries being on the rise, there is a greater need for advanced surgical tables that will provide for more precision and versatility.
The hydraulic surgical tables market is growing in China as healthcare reforms in the country take strong shape, there is an increase in surgical procedures, and with medical equipment modernization being prioritized. As per a report by NLM in December 2024, with a focus on efficiency, China’s total health spending is expected to slow down and could reach around USD 8.6 trillion by 2060, following the global trend. Due to this rising trend of increased focus on cost-efficiency, the adoption of advanced medical equipment, including hydraulic surgical tables, is expected to receive a big boost as healthcare providers target durable yet cost-effective solutions to address higher surgical volumes and better patient outcomes.
The hydraulic surgical tables market in India is growing due to growing healthcare facilities, surgical volumes, and government efforts to uplift infrastructure for healthcare. An increase in the number of surgeries conducted in government and private hospitals was reported by the Ministry of Health and Family Welfare, implying a surge in demand for advanced surgical equipment. Also, the government scheme Ayushman Bharat creates accessibility and affordability for healthcare services that have accommodated the setting of available new healthcare centers and upgraded their basic facilities. This serves as a factor contributing to the increased need for surgical tables in India.
Key Hydraulic Surgical Tables Market Players:
- Stryker Corporation
- Company Overview
- Business Strategy
- Key Product Offerings
- Financial Performance
- Key Performance Indicators
- Risk Analysis
- Recent Development
- Regional Presence
- SWOT Analysis
- Getinge AB
- Hillrom (Baxter)
- Mizuho OSI
- STERIS plc
- Alvo Medical
- Skytron LLC
- Trumpf Medical
- Schaerer Medical
- Lojer Group
- Maquet (Getinge Subsidiary)
- Famed Żywiec
- Medifa-hesse GmbH
- Shimadzu Corporation
- Mindray Medical
The primary revolutionary factors for the market, followed by key players in the global market, include comprehensive pricing, product sustainability, and technological innovation. With a concentrated focus on these goals, leading pioneers are consolidating their positions in AI integration, portfolio expansion, and maximum revenue generation. For instance, in 2025, companies such as Stryker, Getinge, and Hillrom held a significant portion of the market share due to their expertise in the sector. This growth was supported by the introduction of the AI-enabled Q7 table for reducing operating room setup time by Stryker. On the other hand, emphasis on precision engineering with eco-design compliance presents new opportunities to emerging companies in the market.
Here is a list of key players operating in the global market:
Recent Developments
- In January 2025, Annovis Bio Inc. recieved the U.S. patent for using its drug buntanetap to help treat and prevent acute brain and nerve injuries, such as stroke, traumatic brain injury, and other related conditions where hydraulic surgical tables can be used.
- In March 2024, Getinge announced the launch of two new products in the U.S., named Corin Operating Table (OR) Table and Ezea Surgical Light. These new products are designed to help surgical teams work more efficiently while improving safety for both patients and medical staff.
- Report ID: 3020
- Published Date: Oct 06, 2025
- Report Format: PDF, PPT
- Explore a preview of key market trends and insights
- Review sample data tables and segment breakdowns
- Experience the quality of our visual data representations
- Evaluate our report structure and research methodology
- Get a glimpse of competitive landscape analysis
- Understand how regional forecasts are presented
- Assess the depth of company profiling and benchmarking
- Preview how actionable insights can support your strategy
Explore real data and analysis
Frequently Asked Questions (FAQ)
About this Report
Connect with our Expert

Report, 2026-2035


Copyright @ 2026 Research Nester. All Rights Reserved.
