Global Head-Up Display Market
1. An Outline of the Global Head-Up Display Market
1.1. Market Definition and Segmentation
1.2. Study Assumptions and Abbreviations
2. Research Methodology & Approach
2.1. Primary Research
2.2. Secondary Research
2.3. Data Triangulation
2.4. SPSS Methodology
3. Executive Summary
4. Growth Drivers
5. Major Roadblocks
6. Opportunities
7. Prevalent Trends
8. Government Regulation
9. Growth Outlook
10. Competitive White Space Analysis – Identifying Untapped Market Gaps
11. Risk Overview
12. SWOT
13. Technological Advancement
14. Technology Maturity Matrix for the Head-Up Display Market: Recent News
15. Regional Demand
16. Global Head-Up Display by Geography – Strategic Comparative Analysis
17. Strategic Segment Analysis: Head-Up Display Demand Landscape
18. Head-Up Display Demand Trends Driven by integration of advanced technologies, growth in defense modernization programs, and rising public-private investments. (2027-2036)
19. Root Cause Analysis (RCA) for discovering problems of the Head-Up Display Market
20. Porter Five Forces
21. PESTLE
22. Comparative Positioning
23. Global Head-Up Display – Key Player Analysis (2036)
24. Competitive Landscape: Key Suppliers/Players
25. Competitive Model: A Detailed Inside View for Investors
26. Company Market Share, 2036 (%)
26.1. Collins Aerospace
26.2. BAE Systems plc
26.3. CMC Electronics
26.4. Elbit Systems Ltd.
26.5. Elya Solutions sro
26.6. Honeywell International Inc.
26.7. Thales Group
26.8. Garmin Ltd.
26.9. Mercury Systems, Inc.
27. Global Head-Up Display Market Outlook
27.1. Market Overview
27.1.1. Market Revenue by Value (USD Million), and Compound Annual Growth Rate (CAGR)
27.2. Head-Up Display Market Segmentation Analysis (2027-2036)
27.2.1. By Aviation Sector
27.2.1.1. Civil Aviation, Market Value (USD Million), Volume (Units), and CAGR, 2027-2036F
27.2.1.2. Military Aviation, Market Value (USD Million), and CAGR, 2027-2036F
27.2.2. By Platform
27.2.2.1. Commercial Aircraft, Market Value (USD Million), and CAGR, 2027-2036F
27.2.2.2. Business Aviation, Market Value (USD Million), and CAGR, 2027-2036F
27.2.2.3. Civil Helicopters, Market Value (USD Million), and CAGR, 2027-2036F
27.2.2.4. Others, Market Value (USD Million), and CAGR, 2027-2036F
27.2.3. By Component
27.2.3.1. Display Units, Market Value (USD Million), and CAGR, 2027-2036F
27.2.3.2. Sensors & Cameras, Market Value (USD Million), and CAGR, 2027-2036F
27.2.3.3. Others, Market Value (USD Million), and CAGR, 2027-2036F
27.2.4. By End user
27.2.4.1. Business Aviation Operators, Market Value (USD Million), and CAGR, 2027-2036F
27.2.4.2. Airlines / Commercial Aviation Operators, Market Value (USD Million), and CAGR, 2027-2036F
27.2.4.3. Others, Market Value (USD Million), and CAGR, 2027-2036F
27.2.5. By HUD Technology
27.2.5.1. Conventional HUD, Market Value (USD Million), and CAGR, 2027-2036F
27.2.5.2. Augmented Reality (AR) HUD, Market Value (USD Million), and CAGR, 2027-2036F
27.2.5.3. Others, Market Value (USD Million), and CAGR, 2027-2036F
27.2.6. By HUD Architecture
27.2.6.1. Fixed HUD, Market Value (USD Million), and CAGR, 2027-2036F
27.2.6.2. Retractable HUD, Market Value (USD Million), and CAGR, 2027-2036F
27.2.6.3. Others, Market Value (USD Million), and CAGR, 2027-2036F
27.2.7. Regional Synopsis, Value (USD Million), 2027-2036
27.2.7.1. North America Market Value (USD Million) and CAGR & Y-o-Y Growth Trend, 2027-2036F
27.2.7.2. Europe Market Value (USD Million) and CAGR & Y-o-Y Growth Trend, 2027-2036F
27.2.7.3. Asia Pacific, excluding Japan Market Value (USD Million) and CAGR & Y-o-Y Growth Trend, 2027-2036F
27.2.7.4. Latin America Market Value (USD Million) and CAGR & Y-o-Y Growth Trend, 2027-2036F
27.2.7.5. Middle East and Africa Market Value (USD Million) and CAGR & Y-o-Y Growth Trend, 2027-2036F
28. North America Market
28.1. Overview
28.1.1. Market Value (USD Million), Current and Future Projections, 2027-2036
28.1.2. Increment $ Opportunity Assessment, 2027-2036
28.2. Segmentation (USD Million), 2027-2036, By
28.2.1. By Aviation Sector
28.2.1.1. Civil Aviation, Market Value (USD Million), Volume (Units), and CAGR, 2027-2036F
28.2.1.2. Military Aviation, Market Value (USD Million), and CAGR, 2027-2036F
28.2.2. By Platform
28.2.2.1. Commercial Aircraft, Market Value (USD Million), and CAGR, 2027-2036F
28.2.2.2. Business Aviation, Market Value (USD Million), and CAGR, 2027-2036F
28.2.2.3. Civil Helicopters, Market Value (USD Million), and CAGR, 2027-2036F
28.2.2.4. Others, Market Value (USD Million), and CAGR, 2027-2036F
28.2.3. By Component
28.2.3.1. Display Units, Market Value (USD Million), and CAGR, 2027-2036F
28.2.3.2. Sensors & Cameras, Market Value (USD Million), and CAGR, 2027-2036F
28.2.3.3. Others, Market Value (USD Million), and CAGR, 2027-2036F
28.2.4. By End user
28.2.4.1. Business Aviation Operators, Market Value (USD Million), and CAGR, 2027-2036F
28.2.4.2. Airlines / Commercial Aviation Operators, Market Value (USD Million), and CAGR, 2027-2036F
28.2.4.3. Others, Market Value (USD Million), and CAGR, 2027-2036F
28.2.5. By HUD Technology
28.2.5.1. Conventional HUD, Market Value (USD Million), and CAGR, 2027-2036F
28.2.5.2. Augmented Reality (AR) HUD, Market Value (USD Million), and CAGR, 2027-2036F
28.2.5.3. Others, Market Value (USD Million), and CAGR, 2027-2036F
28.2.6. By HUD Architecture
28.2.6.1. Fixed HUD, Market Value (USD Million), and CAGR, 2027-2036F
28.2.6.2. Retractable HUD, Market Value (USD Million), and CAGR, 2027-2036F
28.2.6.3. Others, Market Value (USD Million), and CAGR, 2027-2036F
28.2.7. Country Level Analysis, Value (USD Million)
28.2.7.1. U.S. Market Value (USD Million) and CAGR & Y-o-Y Growth Trend, 2027-2036F
28.2.7.2. Canada Market Value (USD Million) and CAGR & Y-o-Y Growth Trend, 2027-2036F
29. Europe Market
29.1. Overview
29.1.1. Market Value (USD Million), Current and Future Projections, 2027-2036
29.1.2. Increment $ Opportunity Assessment, 2027-2036
29.2. Segmentation (USD Million), 2027-2036, By
29.2.1. By Aviation Sector
29.2.1.1. Civil Aviation, Market Value (USD Million), Volume (Units), and CAGR, 2027-2036F
29.2.1.2. Military Aviation, Market Value (USD Million), and CAGR, 2027-2036F
29.2.2. By Platform
29.2.2.1. Commercial Aircraft, Market Value (USD Million), and CAGR, 2027-2036F
29.2.2.2. Business Aviation, Market Value (USD Million), and CAGR, 2027-2036F
29.2.2.3. Civil Helicopters, Market Value (USD Million), and CAGR, 2027-2036F
29.2.2.4. Others, Market Value (USD Million), and CAGR, 2027-2036F
29.2.3. By Component
29.2.3.1. Display Units, Market Value (USD Million), and CAGR, 2027-2036F
29.2.3.2. Sensors & Cameras, Market Value (USD Million), and CAGR, 2027-2036F
29.2.3.3. Others, Market Value (USD Million), and CAGR, 2027-2036F
29.2.4. By End user
29.2.4.1. Business Aviation Operators, Market Value (USD Million), and CAGR, 2027-2036F
29.2.4.2. Airlines / Commercial Aviation Operators, Market Value (USD Million), and CAGR, 2027-2036F
29.2.4.3. Others, Market Value (USD Million), and CAGR, 2027-2036F
29.2.5. By HUD Technology
29.2.5.1. Conventional HUD, Market Value (USD Million), and CAGR, 2027-2036F
29.2.5.2. Augmented Reality (AR) HUD, Market Value (USD Million), and CAGR, 2027-2036F
29.2.5.3. Others, Market Value (USD Million), and CAGR, 2027-2036F
29.2.6. By HUD Architecture
29.2.6.1. Fixed HUD, Market Value (USD Million), and CAGR, 2027-2036F
29.2.6.2. Retractable HUD, Market Value (USD Million), and CAGR, 2027-2036F
29.2.6.3. Others, Market Value (USD Million), and CAGR, 2027-2036F
29.2.7. Country Level Analysis, Value (USD Million)
29.2.7.1. UK Market Value (USD Million) and CAGR & Y-o-Y Growth Trend, 2027-2036F
29.2.7.2. Germany Market Value (USD Million) and CAGR & Y-o-Y Growth Trend, 2027-2036F
29.2.7.3. France Market Value (USD Million) and CAGR & Y-o-Y Growth Trend, 2027-2036F
29.2.7.4. Italy Market Value (USD Million) and CAGR & Y-o-Y Growth Trend, 2027-2036F
29.2.7.5. Spain Market Value (USD Million) and CAGR & Y-o-Y Growth Trend, 2027-2036F
29.2.7.6. Netherlands Market Value (USD Million) and CAGR & Y-o-Y Growth Trend, 2027-2036F
29.2.7.7. Russia Market Value (USD Million) and CAGR & Y-o-Y Growth Trend, 2027-2036F
29.2.7.8. Switzerland Market Value (USD Million) and CAGR & Y-o-Y Growth Trend, 2027-2036F
29.2.7.9. Poland Market Value (USD Million) and CAGR & Y-o-Y Growth Trend, 2027-2036F
29.2.7.10. Belgium Market Value (USD Million) and CAGR & Y-o-Y Growth Trend, 2027-2036F
29.2.7.11. Rest of Europe Market Value (USD Million) and CAGR & Y-o-Y Growth Trend, 2027-2036F
30. Asia Pacific Market
30.1. Overview
30.1.1. Market Value (USD Million), Current and Future Projections, 2027-2036
30.1.2. Increment $ Opportunity Assessment, 2027-2036
30.2. Segmentation (USD Million), 2027-2036, By
30.2.1. By Aviation Sector
30.2.1.1. Civil Aviation, Market Value (USD Million), Volume (Units), and CAGR, 2027-2036F
30.2.1.2. Military Aviation, Market Value (USD Million), and CAGR, 2027-2036F
30.2.2. By Platform
30.2.2.1. Commercial Aircraft, Market Value (USD Million), and CAGR, 2027-2036F
30.2.2.2. Business Aviation, Market Value (USD Million), and CAGR, 2027-2036F
30.2.2.3. Civil Helicopters, Market Value (USD Million), and CAGR, 2027-2036F
30.2.2.4. Others, Market Value (USD Million), and CAGR, 2027-2036F
30.2.3. By Component
30.2.3.1. Display Units, Market Value (USD Million), and CAGR, 2027-2036F
30.2.3.2. Sensors & Cameras, Market Value (USD Million), and CAGR, 2027-2036F
30.2.3.3. Others, Market Value (USD Million), and CAGR, 2027-2036F
30.2.4. By End user
30.2.4.1. Business Aviation Operators, Market Value (USD Million), and CAGR, 2027-2036F
30.2.4.2. Airlines / Commercial Aviation Operators, Market Value (USD Million), and CAGR, 2027-2036F
30.2.4.3. Others, Market Value (USD Million), and CAGR, 2027-2036F
30.2.5. By HUD Technology
30.2.5.1. Conventional HUD, Market Value (USD Million), and CAGR, 2027-2036F
30.2.5.2. Augmented Reality (AR) HUD, Market Value (USD Million), and CAGR, 2027-2036F
30.2.5.3. Others, Market Value (USD Million), and CAGR, 2027-2036F
30.2.6. By HUD Architecture
30.2.6.1. Fixed HUD, Market Value (USD Million), and CAGR, 2027-2036F
30.2.6.2. Retractable HUD, Market Value (USD Million), and CAGR, 2027-2036F
30.2.6.3. Others, Market Value (USD Million), and CAGR, 2027-2036F
30.2.7. Country Level Analysis, Value (USD Million)
30.2.7.1. China Market Value (USD Million) and CAGR & Y-o-Y Growth Trend, 2027-2036F
30.2.7.2. Japan Market Value (USD Million) and CAGR & Y-o-Y Growth Trend, 2027-2036F
30.2.7.3. India Market Value (USD Million) and CAGR & Y-o-Y Growth Trend, 2027-2036F
30.2.7.4. South Korea Market Value (USD Million) and CAGR & Y-o-Y Growth Trend, 2027-2036F
30.2.7.5. Australia Market Value (USD Million) and CAGR & Y-o-Y Growth Trend, 2027-2036F
30.2.7.6. Indonesia Market Value (USD Million) and CAGR & Y-o-Y Growth Trend, 2027-2036F
30.2.7.7. Malaysia Market Value (USD Million) and CAGR & Y-o-Y Growth Trend, 2027-2036F
30.2.7.8. Vietnam Market Value (USD Million) and CAGR & Y-o-Y Growth Trend, 2027-2036F
30.2.7.9. Thailand Market Value (USD Million) and CAGR & Y-o-Y Growth Trend, 2027-2036F
30.2.7.10. Singapore Market Value (USD Million) and CAGR & Y-o-Y Growth Trend, 2027-2036F
30.2.7.11. New Zealand Market Value (USD Million) and CAGR & Y-o-Y Growth Trend, 2027-2036F
30.2.7.12. Rest of Asia Pacific Excluding Japan Market Value (USD Million) and CAGR & Y-o-Y Growth Trend, 2027-2036F
31. Latin America Market
31.1. Overview
31.1.1. Market Value (USD Million), Current and Future Projections, 2027-2036
31.1.2. Increment $ Opportunity Assessment, 2027-2036
31.1.3. Year-on-Year Growth Forecast (%)
31.2. Segmentation (USD Million), 2027-2036, By
31.2.1. By Aviation Sector
31.2.1.1. Civil Aviation, Market Value (USD Million), Volume (Units), and CAGR, 2027-2036F
31.2.1.2. Military Aviation, Market Value (USD Million), and CAGR, 2027-2036F
31.2.2. By Platform
31.2.2.1. Commercial Aircraft, Market Value (USD Million), and CAGR, 2027-2036F
31.2.2.2. Business Aviation, Market Value (USD Million), and CAGR, 2027-2036F
31.2.2.3. Civil Helicopters, Market Value (USD Million), and CAGR, 2027-2036F
31.2.2.4. Others, Market Value (USD Million), and CAGR, 2027-2036F
31.2.3. By Component
31.2.3.1. Display Units, Market Value (USD Million), and CAGR, 2027-2036F
31.2.3.2. Sensors & Cameras, Market Value (USD Million), and CAGR, 2027-2036F
31.2.3.3. Others, Market Value (USD Million), and CAGR, 2027-2036F
31.2.4. By End user
31.2.4.1. Business Aviation Operators, Market Value (USD Million), and CAGR, 2027-2036F
31.2.4.2. Airlines / Commercial Aviation Operators, Market Value (USD Million), and CAGR, 2027-2036F
31.2.4.3. Others, Market Value (USD Million), and CAGR, 2027-2036F
31.2.5. By HUD Technology
31.2.5.1. Conventional HUD, Market Value (USD Million), and CAGR, 2027-2036F
31.2.5.2. Augmented Reality (AR) HUD, Market Value (USD Million), and CAGR, 2027-2036F
31.2.5.3. Others, Market Value (USD Million), and CAGR, 2027-2036F
31.2.6. By HUD Architecture
31.2.6.1. Fixed HUD, Market Value (USD Million), and CAGR, 2027-2036F
31.2.6.2. Retractable HUD, Market Value (USD Million), and CAGR, 2027-2036F
31.2.6.3. Others, Market Value (USD Million), and CAGR, 2027-2036F
31.2.7. Country Level Analysis, Value (USD Million)
31.2.7.1. Brazil Market Value (USD Million) and CAGR & Y-o-Y Growth Trend, 2027-2036F
31.2.7.2. Argentina Market Value (USD Million) and CAGR & Y-o-Y Growth Trend, 2027-2036F
31.2.7.3. Mexico Market Value (USD Million) and CAGR & Y-o-Y Growth Trend, 2027-2036F
31.2.7.4. Rest of Latin America Market Value (USD Million) and CAGR & Y-o-Y Growth Trend, 2027-2036F
32. Middle East & Africa Market
32.1. Overview
32.1.1. Market Value (USD Million), Current and Future Projections, 2027-2036
32.1.2. Increment $ Opportunity Assessment, 2027-2036
32.1.3. Year-on-Year Growth Forecast (%)
32.2. Segmentation (USD Million), 2027-2036, By
32.2.1. By Aviation Sector
32.2.1.1. Civil Aviation, Market Value (USD Million), Volume (Units), and CAGR, 2027-2036F
32.2.1.2. Military Aviation, Market Value (USD Million), and CAGR, 2027-2036F
32.2.2. By Platform
32.2.2.1. Commercial Aircraft, Market Value (USD Million), and CAGR, 2027-2036F
32.2.2.2. Business Aviation, Market Value (USD Million), and CAGR, 2027-2036F
32.2.2.3. Civil Helicopters, Market Value (USD Million), and CAGR, 2027-2036F
32.2.2.4. Others, Market Value (USD Million), and CAGR, 2027-2036F
32.2.3. By Component
32.2.3.1. Display Units, Market Value (USD Million), and CAGR, 2027-2036F
32.2.3.2. Sensors & Cameras, Market Value (USD Million), and CAGR, 2027-2036F
32.2.3.3. Others, Market Value (USD Million), and CAGR, 2027-2036F
32.2.4. By End user
32.2.4.1. Business Aviation Operators, Market Value (USD Million), and CAGR, 2027-2036F
32.2.4.2. Airlines / Commercial Aviation Operators, Market Value (USD Million), and CAGR, 2027-2036F
32.2.4.3. Others, Market Value (USD Million), and CAGR, 2027-2036F
32.2.5. By HUD Technology
32.2.5.1. Conventional HUD, Market Value (USD Million), and CAGR, 2027-2036F
32.2.5.2. Augmented Reality (AR) HUD, Market Value (USD Million), and CAGR, 2027-2036F
32.2.5.3. Others, Market Value (USD Million), and CAGR, 2027-2036F
32.2.6. By HUD Architecture
32.2.6.1. Fixed HUD, Market Value (USD Million), and CAGR, 2027-2036F
32.2.6.2. Retractable HUD, Market Value (USD Million), and CAGR, 2027-2036F
32.2.6.3. Others, Market Value (USD Million), and CAGR, 2027-2036F
32.2.7. Country Level Analysis, Value (USD Million)
32.2.7.1. Saudi Arabia Market Value (USD Million) and CAGR & Y-o-Y Growth Trend, 2027-2036F
32.2.7.2. UAE Market Value (USD Million) and CAGR & Y-o-Y Growth Trend, 2027-2036F
32.2.7.3. Israel Market Value (USD Million) and CAGR & Y-o-Y Growth Trend, 2027-2036F
32.2.7.4. Qatar Market Value (USD Million) and CAGR & Y-o-Y Growth Trend, 2027-2036F
32.2.7.5. Kuwait Market Value (USD Million) and CAGR & Y-o-Y Growth Trend, 2027-2036F
32.2.7.6. Oman Market Value (USD Million) and CAGR & Y-o-Y Growth Trend, 2027-2036F
32.2.7.7. South Africa Market Value (USD Million) and CAGR & Y-o-Y Growth Trend, 2027-2036F
32.2.7.8. Rest of Middle East & Africa Market Value (USD Million) and CAGR & Y-o-Y Growth Trend, 2027-2036F
33. Global Economic Scenario
33.1. World Economic Outlook
34. About Research Nester
34.1. Our Global Clientele
34.2. We Serve Clients Across World
Head-Up Display Market Outlook:
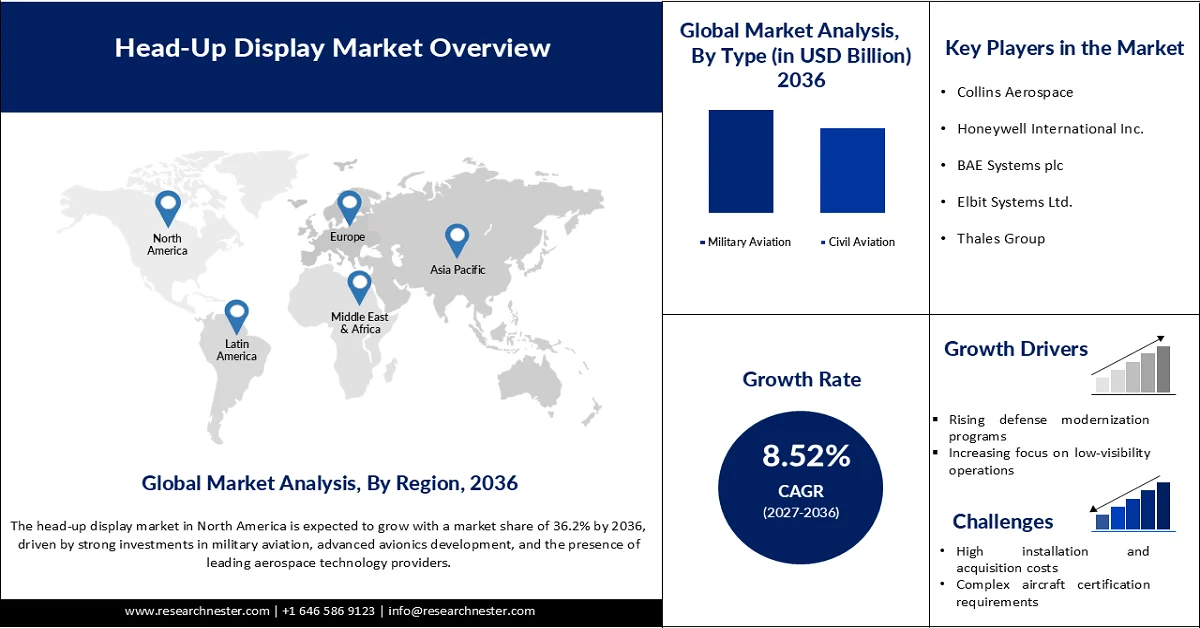
Head-Up Display Market size is valued at USD 1.11 billion in 2026 and is projected to reach USD 2.65 billion by 2036, growing at a CAGR of 8.52% during the forecast period, i.e., 2027-2036. In 2027, the industry size of head-up display is evaluated at USD 1.27 billion.
The swift rise in defense modernization initiatives across the world is fueling the sales of innovative head-up display (HUD) solutions. Both public and private organizations are investing heavily in upgrading aviation systems, including fighter jets, aircraft, helicopters, and surveillance platforms. According to Invest India, in the defense sector for FY 2025–26, the country allocated nearly USD 13.44 billion (INR 111,544.83 crore), three-quarters of the modernization budget, for procurement from domestic sources. India also plans to spend USD 130 billion on fleet modernization over the next 5 to 7 years. Thus, major economies are significantly driving demand for advanced head-up display (HUD) systems in aviation.
Further, commercial aircraft upgradation is a key revenue booster for head-up display manufacturers. Innovations, strategic collaborations, and expansion moves are projected to boost the sales of head-up displays in the years ahead. In May 2026, Boeing and EgyptAir announced that Egypt's national airline had received its first 737 MAX aircraft. The 737-8 is the first of 18 planes leased from SMBC Aviation Capital to be delivered and marks the introduction of the 737 MAX to Egypt. This delivery represents a key milestone in EgyptAir's fleet modernization plan.
Key Head-Up Display Market Insights Summary:
Regional Highlights:
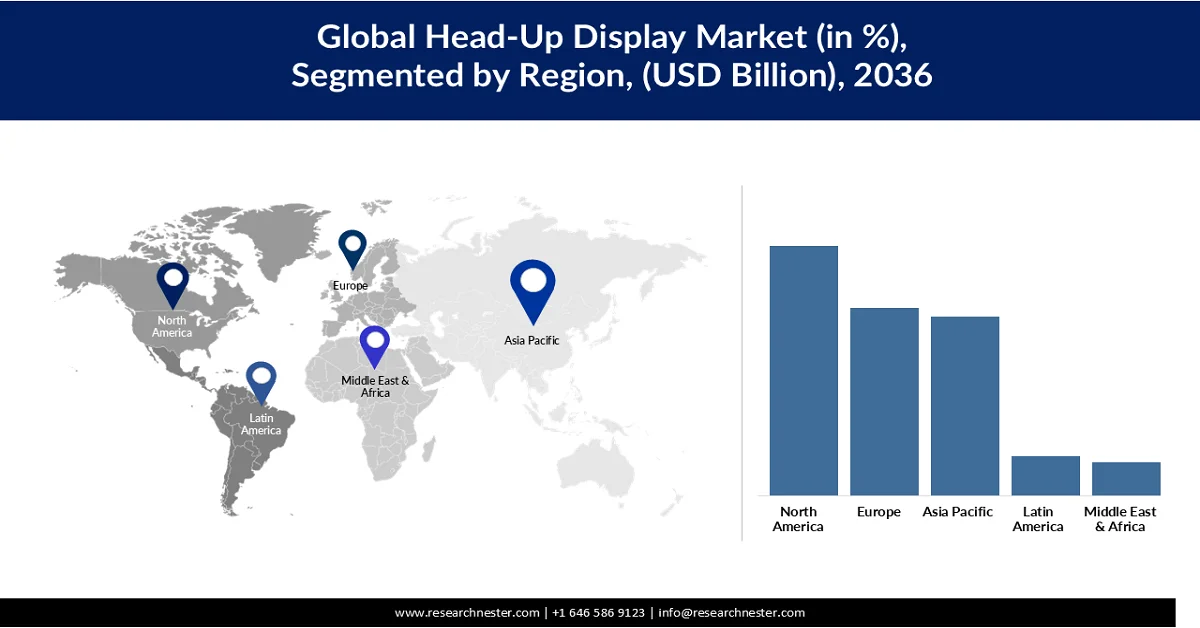
- By 2036, North America is projected to command 36.2% of the global head-up display market share, underpinned by its advanced aerospace ecosystem, strong aircraft manufacturing base, and sustained investments in aviation technology
- Europe is anticipated to account for 27.2% of the market share through 2036, bolstered by robust aerospace manufacturing capabilities, advanced aviation infrastructure, and growing emphasis on flight safety
Segment Insights:
- By 2036, the military aviation segment is expected to secure 54.8% of the head-up display market share, propelled by rising investments in advanced battlefield awareness technologies and the critical need for enhanced situational awareness and mission effectiveness
- The display units segment is forecast to hold 53.3% of the market share throughout 2036, supported by continuous technological innovations aimed at improving visual information projection effectiveness and overall performance
Key Growth Trends:
- Demand for next-generation augmented reality HUDs
- Increasing focus on low-visibility operations
Major Challenges:
- High installation and acquisition costs
- Complex aircraft certification requirements
Key Players: Collins Aerospace (U.S.),BAE Systems plc (U.K.),CMC Electronics (Canada),Elbit Systems Ltd. (Israel),Elya Solutions sro (Czech Republic),Honeywell International Inc. (U.S.),Thales Group (France),Garmin Ltd. (U.S.),Mercury Systems, Inc. (U.S.).
Global Head-Up Display Market Forecast and Regional Outlook:
Market Size & Growth Projections:
- 2026 Market Size: USD 1.11 billion
- 2027 Market Size: USD 1.27 billion
- Projected Market Size: USD 2.65 billion by 2036
- Growth Forecasts: 8.52% CAGR (2027-2036)
Key Regional Dynamics:
- Largest Region: North America (36.2% Share by 2036)
- Fastest Growing Region: Asia Pacific
- Dominating Countries: United States, China, France, United Kingdom, Germany
- Emerging Countries: India, Japan, South Korea, Saudi Arabia, United Arab Emirates
Last updated on : 26 June, 2026
Head-Up Display Market - Growth Drivers and Challenges
Growth drivers
- Demand for next-generation augmented reality HUDs: The development of augmented reality (AR)-enabled head-up displays is projected to double the revenues of key players in the coming years. In military aviation, AR HUDs are gaining traction owing to their ability to improve operational effectiveness and decision-making speed. In February 2026, Kopin Corporation announced it had received an initial microdisplay production order for integration into a new rotary-wing helmet-mounted display (HMD) system for a critical defense mission. The rotary-wing HMD system uses Kopin's highly reliable, custom-designed active matrix liquid crystal (AMLCD) microdisplays, which present essential flight, tactical, and sensor data in augmented reality (AR) by overlaying digital information directly onto the pilot's natural view.
- Increasing focus on low-visibility operations: The increasing focus on maintaining safety during low-visibility conditions is propelling the demand for advanced head-up display solutions. The HUD technology aids in overcoming weather-related factors such as fog, heavy rain, snow, haze, and dust storms. Universal Avionics received FAA approval in December 2023 for its AerAware™ Enhanced Flight Vision System (EFVS) using ClearVision™ technology on the Boeing 737NG aircraft. This is the world’s first certification of an EFVS that allows a 50% reduction in minimum visibility requirements for approach and landing. The system features dual wearable head-up displays for both pilots, combined with a multispectral camera and panoramic synthetic vision. Developed in partnership with AerSale Corporation, the solution significantly improves safety and operational capability in low-visibility conditions. This approval marks a major advancement for retrofitting older 737NG aircraft with modern enhanced vision technology.
- Stringent aviation safety regulations: The effective aviation safety frameworks in the aviation sector are boosting the application of advanced head-up displays. Organizations, including the International Civil Aviation Organization (ICAO), that focus on establishing standards that reduce operational risks and enhance flight safety drive the demand for next-gen cockpit technologies. Furthermore, increasing importance on collision avoidance and enhanced pilot decision-making is fueling the sales of cockpit solutions.
Challenges
- High installation and acquisition costs: The high costs associated with the installation and acquisition are one of the key factors restraining the growth of the market. The incorporation of advanced technologies and specialized components adds to the final costs of the advanced aviation HUDs. Smaller companies often refrain from investing in these solutions due to budgetary constraints. Thus, these factors emerge as key challenges in the cost-sensitive markets.
- Complex aircraft certification requirements: Aviation is one of the most highly regulated industries in the world, and the complex certification requirements hinder the market substantially. Several regulatory bodies, such as the European Union Aviation Safety Agency (EASA), the Federal Aviation Administration (FAA), and more, enforce strict frameworks. Manufacturers operating across the world had to meet specific requirements if want to supply their product into a specific region. Thus, lengthy and complex regulatory procedures delay product launches and increase the development costs, limiting the overall market growth.
Head-Up Display Market Size and Forecast:
| Report Attribute | Details |
|---|---|
|
Base Year |
2026 |
|
Forecast Year |
2027-2036 |
|
CAGR |
8.52% |
|
Base Year Market Size (2026) |
USD 1.11 billion |
|
Forecast Year Market Size (2036) |
USD 2.65 billion |
|
Regional Scope |
|
Head-Up Display Market Segmentation:
Type Segment Analysis
The military aviation segment is projected to capture 54.8% of the global head-up display market through 2036. Head displays are being widely used in military aviation systems due to their critical requirement for advanced situational awareness and mission effectiveness. The growing investments and development of advanced battlefield awareness technologies are fueling the application of head-up displays in military aviation. In February 2025, Collins Aerospace, part of RTX, announced that its enhanced power and cooling system (EPACS) has completed testing and is now ready for aircraft integration.
The new system is designed primarily as an upgrade for the F-35 fighter jet, offering more than double the current cooling capacity to support advanced future sensors, weapons, and mission systems. After rigorous testing, the EPACS demonstrator has reached Technology Readiness Level 6 (TRL-6). This technology is also expected to apply to future military aircraft and commercial planes that require high-power thermal management. This development marks a significant step in preparing aircraft for next-generation high-energy systems.
Component Segment Analysis
The display units segment is estimated to hold 53.3% of the head-up display market share throughout the forecast period. Display units are being widely demanded due to their key role in generating and projecting critical visual information to pilots. Continuous technological innovations focused on effectiveness and overall performance are projected to fuel the adoption of next-gen display units. In April 2026, Panasonic Avionics Corporation unveiled eXNeo, a next-generation seatback monitor upgrade designed to modernize older aircraft cabins through a quick, seamless modification that provides the latest digital experiences. eXNeo, a cost-effective, direct replacement for Panasonic Avionics' older X Series seatback monitors, is estimated to be available to all by 2027.
HUD Technology Segment Analysis
The conventional head-up display (HUD) segment is anticipated to account for 63.3% of the global market share during the study timeframe. The proven reliability and extensive integration across commercial and military aircraft fleets are fueling the sales of conventional head-up displays. Airlines, aircraft manufacturers, and defense organizations have been using conventional HUDs for decades, which directly contributes to the segmental growth. Further, the incorporation of digital avionics and enhanced vision systems (EVS) is expected to drive the adoption of conventional heads-up displays (HUDs) in modern aircraft platforms.
Our in-depth analysis of the head-up display market includes the following segments:
|
Segments |
Subsegments |
|
Aviation Sector |
|
|
Platform |
|
|
Component |
|
|
End user |
|
|
HUD Technology |
|
|
HUD Architecture |
|

Vishnu Nair
Head - Global Business DevelopmentCustomize this report to your requirements — connect with our consultant for personalized insights and options.
Head-Up Display Market - Regional Analysis
North America Market Insights
North America is projected to hold 36.2% of the global head-up display market share through 2036. The region’s advanced aerospace ecosystem, strong aircraft manufacturing base, and continuous investments in aviation technology are driving market growth. The concentration of established aircraft manufacturers and avionics suppliers boosts the development and trade of head-up displays. The ongoing investments in next-generation fighter jets, military transport aircraft, surveillance platforms, and helicopter modernization programs continue to drive demand for sophisticated HUD technologies.
The U.S. market is poised to be valued at USD 402.75 million in 2027, owing to extensive military aviation capabilities. The country’s dominant aerospace industry and large commercial aircraft fleet are increasing the demand for advanced head-up display solutions. According to Airlines for America, commercial aviation contributes 5% of U.S. GDP, equal to USD 1.54 trillion in 2025. Each day, U.S. airlines operate over 28,000 flights, transporting 2.7 million passengers to and from nearly 80 countries and moving 61,000 tons of cargo to and from more than 220 countries. Thus, both commercial and military aviation are estimated to fuel the sales of head-up displays in the country.
The Canada market is estimated to increase at a CAGR of 7.84% from 2027 to 2036. The country benefits from a well-established aerospace sector and strong aviation infrastructure. The ongoing investments in both commercial and defense aviation modernization are increasing the demand for advanced head-up displays. The Canadian Airports Council reveals that the country’s airports support 435,800 jobs, deliver CAD 32.9 billion in annual wages, contribute CAD 49.6 billion to GDP, and generate CAD 123.5 billion in yearly economic output. Overall, Canada is one of the key marketplaces for head-up display manufacturers.
Europe Market Insights
Europe is estimated to account for 27.2% of the global head-up display market share throughout the forecast period. The region’s strong aerospace manufacturing capabilities are boosting the sales of head-up displays. The advanced aviation infrastructure and emphasis on flight safety are also boosting the trade of advanced cockpit technologies. The growing adoption of HUD systems across commercial, military, and business aviation segments is further driven by the need to enhance pilot situational awareness, improve operational efficiency, and support safer flight operations.
The Germany market is projected to reach USD 137.34 million by 2036. The country’s strong aerospace manufacturing base and engineering expertise are mainly boosting the trade of head-up displays. Germany’s key role in the European aerospace sector through its participation in aircraft production, avionics development, and defense aviation programs is also contributing to the market growth. According to the International Air Transport Association (IATA), aviation in Germany directly employs 386,900 people and generates USD 37 billion in economic output. Thus, investing in Germany is the most profitable decision for key players.
The U.K. market for head-up displays is estimated to increase at a CAGR of 9.10% between 2027 and 2036. High tourism activities and a well-established ecosystem of aerospace manufacturers are fueling the trade of head-up displays. The government reveals that overseas visitors made an estimated 9.3 million trips to Great Britain and spent around USD 10.67 billion (£7.9 billion) in the second quarter of 2025 (April to June). Further, continuous investment in aviation innovation is poised to double the revenues of key players in the years ahead.
Asia Pacific Market Insights
Asia Pacific is anticipated to capture 25.9% of the global head-up display market share by 2036. The rapid expansion of the aviation sector and increasing defense modernization initiatives are fueling the trade of cockpit technologies. The rising investments in advanced avionics technologies are also supporting the sales of head-up displays. Technological advancements in digital avionics, synthetic vision systems, and enhanced vision solutions are further contributing to market growth. China, Japan, India, and South Korea are some of the key marketplaces in the region.
The China market is projected to reach USD 167.91 million by 2036. The rapidly growing aerospace industry is a key driver for the sales of head-up display solutions. The expanding commercial aviation activities and substantial defense modernization programs are boosting the trade of cockpit technologies. In March 2026, China announced a defense budget of USD 281 billion, with USD 277 billion allocated through the central government. Further strategic public-private strategies are projected to push the sales of head-up displays in the years ahead.
The Japan market was valued at USD 38.40 million in 2026. The country’s strong aerospace manufacturing capabilities are boosting the trade of cockpit solutions. The hefty investments in the defense sector are increasing the sales of head-up displays. Continuous technological innovations are also propelling the overall market growth. Further. A rise in foreign direct investments is expected to fuel the demand for head-up displays.
Japan Market Insights
The Japan head-up display market is expected to increase from USD 43.68 billion in 2027 to USD 91.17 billion by 2036. The country’s strong aerospace manufacturing capabilities and continuous investment in advanced avionics technologies are fueling the sales of head-up displays. Japanese airlines and aircraft operators place significant importance on operational reliability and safety, which encourages the adoption of advanced cockpit technologies.
The government has moved forward the target to reach a defense budget equal to 2% of GDP, as set out in the current National Security Strategy, to be achieved in fiscal year 2025. The expenditure budget for implementing the Defense Build-up Program (DBP) is JPY 8,809 billion. The Ministry of Defense is set to steadily raise its budget in line with program progress and budget execution throughout the DBP period. Thus, the hefty defense budget is expected to propel the sales of head-up displays in the years ahead.
Japan Head-Up Display Market Size and Forecast
|
Report Attribute |
Details |
|
Base Year Market Size (2026) |
USD 38.40 million; 31 units |
|
Forecast Year Market Size (2036) |
USD 91.17 million; 50 units |
|
CAGR (2027-2036) |
8.52% |
Key Head-Up Display Key Market Players:
- Collins Aerospace (U.S.)
- BAE Systems plc (U.K.)
- CMC Electronics (Canada)
- Elbit Systems Ltd. (Israel)
- Elya Solutions sro (Czech Republic)
- Honeywell International Inc. (U.S.)
- Thales Group (France)
- Garmin Ltd. (U.S.)
- Mercury Systems, Inc. (U.S.)
- Company Overview
- Business Strategy
- Key Product Offerings
- Financial Performance
- Key Performance Indicators
- Risk Analysis
- Recent Development
- Regional Presence
- SWOT Analysis
- Collins Aerospace is a leading player in the aviation market, leveraging its extensive expertise in avionics and cockpit systems. The company maintains a strong position through long-term relationships with major commercial and military aircraft manufacturers. Its competitive advantage lies in integrating HUDs with advanced flight deck technologies, enhanced vision systems, and digital avionics platforms. Continuous investment in research and development enables Collins Aerospace to offer high-performance solutions that improve pilot situational awareness, operational efficiency, and flight safety across diverse aviation applications.
- Honeywell International Inc. is a prominent competitor in the aviation HUD market, recognized for its innovative avionics portfolio and strong presence in commercial, military, and business aviation. The company focuses on developing advanced HUD systems that support low-visibility operations, improve pilot decision-making, and enhance flight safety. Honeywell strengthens its market position through continuous product innovation, strategic collaborations with aircraft manufacturers, and investments in connected cockpit technologies. Its broad customer base and global service network contribute significantly to its competitive strength.
- BAE Systems plc holds a strong position in the aviation HUD market, particularly within military aviation applications. The company is known for delivering advanced display and mission systems that enhance pilot effectiveness and combat readiness. Its HUD solutions are widely integrated into fighter aircraft and defense aviation platforms worldwide. BAE Systems focuses on technological advancements in digital displays, situational awareness systems, and next-generation cockpit architectures. Strong defense contracts, modernization programs, and long-standing government relationships support its competitive leadership in the market.
- Elbit Systems Ltd. is a key competitor in the aviation HUD market, particularly recognized for its advanced military avionics and display technologies. The company specializes in innovative HUD solutions integrated with targeting, navigation, and mission management systems. Its strong presence in defense aviation is supported by continuous investments in research and development, enabling the introduction of cutting-edge display capabilities. Elbit’s focus on enhanced pilot situational awareness, operational effectiveness, and mission success has strengthened its position across global military aviation markets.
- Thales Group is a major participant in the aviation HUD market, benefiting from its extensive expertise in aerospace electronics, avionics, and defense technologies. The company offers advanced HUD solutions designed to improve flight safety, pilot awareness, and operational performance in both commercial and military aircraft.. Strategic partnerships with aircraft manufacturers and strong participation in international aerospace programs further reinforce its competitive position in the global market.
Below is the list of the key players operating in the global market:
The aviation head-up display market is characterized by the presence of both international and regional players. The leading companies are focused on technological innovations to introduce next-gen solutions. They are also collaborating with others to enhance their product offerings. To increase their reach and earnings, giant companies are exploring opportunities in high-potential economies. Both the organic and inorganic marketing strategies are projected to aid leading companies in doubling their revenues in the years ahead.
Corporate Landscape of the Global Head-Up Display Market:
Recent Developments
- In October 2025, SAE issued a new performance standard for head-worn displays used in aviation. The new aerospace standard, AS7377, the minimum performance standard for airborne head-worn displays, sets out the core performance requirements for HWDs to guarantee safe and reliable operation in fixed-wing aircraft across various flight deck applications.
- In June 2023, Honeywell reached an agreement with Saab, a Swedish aerospace and defense firm, to acquire its heads-up display (HUD) assets for integration into various Honeywell avionics products. As part of the deal, Saab collaborates with Honeywell to develop and enhance its HUD product range.
- Report ID: 4847
- Published Date: Jun 26, 2026
- Report Format: PDF, PPT
- Explore a preview of key market trends and insights
- Review sample data tables and segment breakdowns
- Experience the quality of our visual data representations
- Evaluate our report structure and research methodology
- Get a glimpse of competitive landscape analysis
- Understand how regional forecasts are presented
- Assess the depth of company profiling and benchmarking
- Preview how actionable insights can support your strategy
Explore real data and analysis
Frequently Asked Questions (FAQ)
About this Report
Connect with our Expert


Report, 2027-2036



Copyright @ 2026 Research Nester. All Rights Reserved.
