Food Service Disposable Market Outlook:
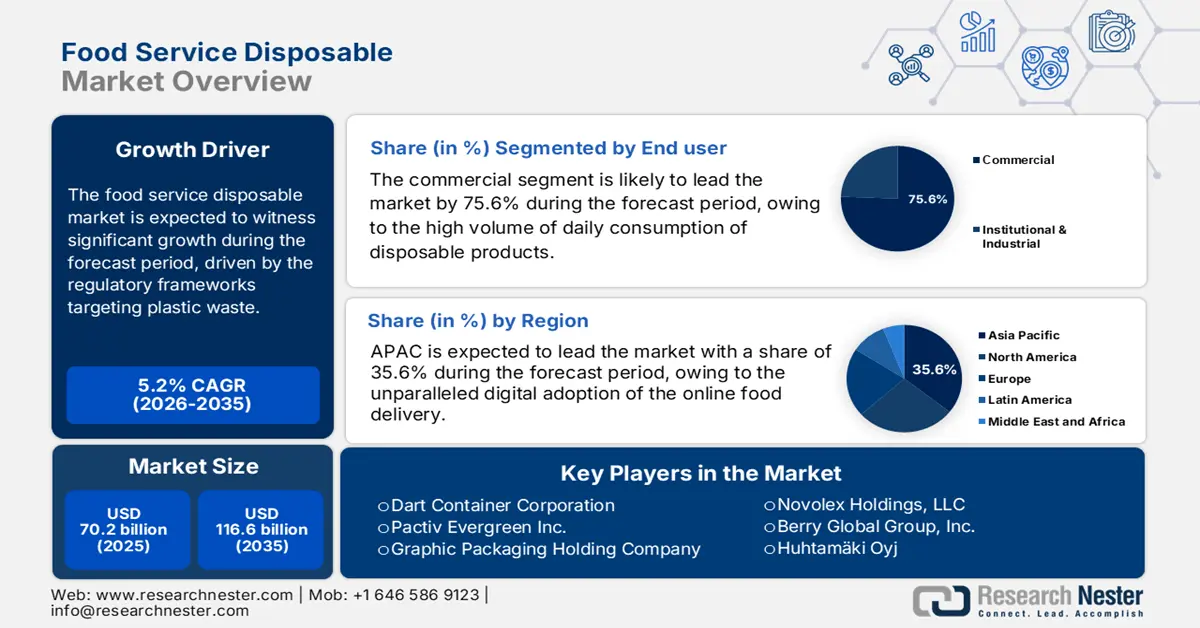
Food Service Disposable Market size was valued at USD 70.2 billion in 2025 and is projected to reach USD 116.6 billion by the end of 2035, rising at a CAGR of 5.2% during the forecast period, i.e., 2026-2035. In 2026, the industry size of food service disposable is evaluated at USD 73.9 billion.
The operational environment for food service disposable market suppliers is fundamentally shaped by the regulatory frameworks targeting plastic waste. The institutional foodservice operators across the U.S. and other developed economies remain structurally dependent on disposable tableware due to the scale, sanitation mandates, and labor constraints. The data from the U.S. Census Bureau’s report of manufacturers' U.S. shipments of the converted paper products, which include plates, cups, and trays, reflect a steady downstream demand from restaurants, quick service chains, and educational institutions. The report from the USDA in September 2025 indicates that the food service facilities contributed USD 1.06 trillion, with both the full-service and limited-service establishments each accounting for about USD 360 million. Further, the single-use service ware in healthcare, senior care, and institutional dining settings sustains a baseline procurement volume for the disposable products despite increasing material and compliance costs.
Source: Eurostat October 2025
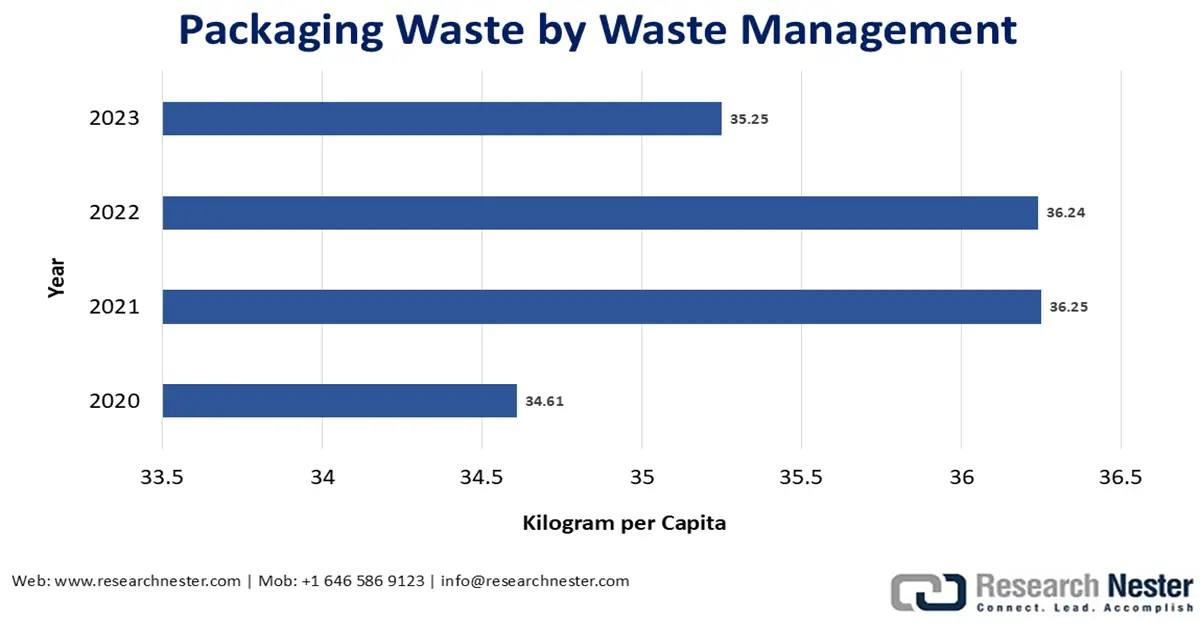
At the same time, the regulatory and procurement pressures are reshaping material choices rather than reducing volume demand. The U.S. Environmental Protection Agency report in October 2025 depicts that nearly 82.2 million tons of containers and packaging municipal solid waste were generated, promoting the federal and state agencies to prioritize waste reduction, recyclability, and compostability in the public procurement framework. Multiple state and municipal governments have enacted restrictions on specific resin-based foodservice items, shifting the B2B purchasing toward fiber-based molded pulp and certified compostable alternatives without eliminating the disposable usage in high-traffic foodservice environments. In the EU, the Eurostat report in October 2025 depicts that the plastic packaging waste in 2023 was 35.25 kilograms per capita. The institutional buyers and government-funded food service programs are increasingly embedding material compliance and end of life criteria into the long term supply contracts, driving for the single use solutions.
Key Food Service Disposable Market Insights Summary:
Regional Highlights:
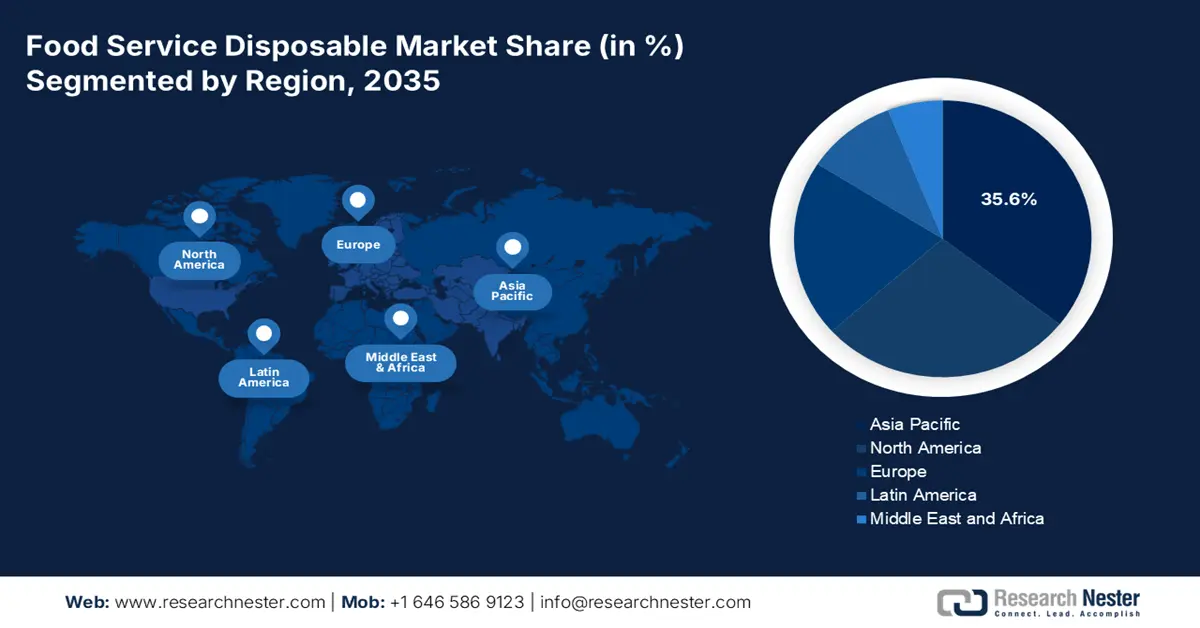
- Asia Pacific is projected to account for a 35.6% share by 2035 in the food service disposable market, fueled by rapid urbanization, population expansion, and accelerating adoption of online food delivery platforms.
- North America is expected to expand at a CAGR of 4.4% during 2026–2035, accelerated by high per-capita food-away-from-home spending and stringent regulatory actions driving a shift toward sustainable disposable materials.
Segment Insights:
- Commercial (End User) is expected to account for a dominant 75.6% share by 2035 in the food service disposable market,, anchored in intensive daily usage across dine-in and off-premise foodservice operations.
- Wholesalers and Distributors (Distribution Channel) are set to hold a significant share over the 2026–2035 period, strengthened by their role as centralized logistics intermediaries enabling efficient bulk supply to fragmented foodservice operators.
Key Growth Trends:
- Sustained government and institutional foodservice spending
- Regulatory emphasis on food safety and infection control
Major Challenges:
- High capital intensity and economies of scale
- Established supply chain integration and buyer loyalty
Key Players: Dart Container Corporation, Pactiv Evergreen Inc., Graphic Packaging Holding Company.
Global Food Service Disposable Market Forecast and Regional Outlook:
Market Size & Growth Projections:
- 2025 Market Size: USD 70.2 billion
- 2026 Market Size: USD 73.9 billion
- Projected Market Size: USD 116.6 billion by 2035
- Growth Forecasts: 5.2% CAGR (2026-2035)
Key Regional Dynamics:
- Largest Region: Asia Pacific (35.6% Share by 2035)
- Fastest Growing Region: North America
- Dominating Countries: United States, China, Japan, Germany, United Kingdom
- Emerging Countries: India, Brazil, Indonesia, Vietnam, Mexico
Last updated on : 22 December, 2025
Food Service Disposable Market - Growth Drivers and Challenges
Growth Drivers
- Sustained government and institutional foodservice spending: The public sector foodservice spending is a primary structural driver for the disposable demand in the market, mainly in education, healthcare, defense, and social welfare programs. The USDA in September 2025 reports that the food sales at the foodservice outlets generated USD 1.52 trillion in 2024, with the institutional and limited service formats accounting for a significant share of volume throughput. The government-funded programs, such as the National School Lunch Program, School Breakfast Program, and Senior Nutrition Program, require high-volume standardized and sanitary service ware solutions. These programs rely heavily on the disposable plates, trays, cups, and cutlery to manage the cost, efficiency, labor limitations, and food safety compliance.
U.S. Food Expenditure (2020-2024)
|
Year |
Food-away-from-home establishments (percentage) |
|
2020 |
51.20 |
|
2021 |
55.02 |
|
2022 |
56.46 |
|
2023 |
58.22 |
|
2024 |
58.90 |
Source: USDA September 2025
- Regulatory emphasis on food safety and infection control: Government health agencies continue to reinforce the single-use foodservice items as part of infection prevention strategies in institutional settings. The U.S. Centers for Disease Control and Prevention highlights the disposable serviceware as a risk mitigation tool in hospital long-term care facilities, correctional institutions, and emergency shelters where the cross-contamination risks are high, and labor turnover is significant. The disposable products depend on the centralized dishwashing systems that require water, energy, trained staff, and validated sanitation controls. This is mainly relevant in healthcare foodservice, where the centers for the Medicare and Medicaid services tie reimbursement eligibility to infection control compliance. As an aging population expands, healthcare utilization in various countries and regions, institutional meal volumes rise in parallel, reinforcing baseline demand for the compliant disposable products.
- Expansion of the education and school meal program: Public education system represent one of the largest centralized buyers of food service disposables globally. The report from the USDA October 2023 states that the National School Lunch Program served over 4,9 billion lunches annually, while the emergency waivers and universal free meal pilots expanded the participation. Disposable trays portion cups milk cartons and cutlery remain the operationally essential due to limited kitchen infrastructure and staffing shortages across the school districts. Further, these similar government supported school feeding initiatives across the Asia and Europe emphasize meal scalability and cost control reinforcing disposable usage. Education budgets typically prioritize the food quality and access over the capital-intensive reusable system particularly in rural and high-density urban districts.
Challenges
- High capital intensity and economies of scale: Manufacturing requires a substantial investment in specialized machinery and bulk raw material procurement. Incumbents like Dart Containers benefit from the decades of scaled production, allowing lower per-unit costs. A new supplier cannot compete on price at volume without a similar scale, creating a significant barrier to securing large QSR chain contracts that demand millions of uniform units at low cost points. Further long term supply agreements with the major QSR and foodservice operators encircle incumbents by locking in volume commitments and specifications, limiting the opportunities for smaller entrants to achieve the production scale required to compete on cost and consistency.
- Established supply chain integration and buyer loyalty: Major QSRs and distributors have deeply integrated long-term partnerships with the top suppliers. These relationships are fortified by the just in time derlivery systems, custom product co-development, and volume-based rebates. Displacing an incumbent by the leading players as a primary cup or carton supplier for a global chain requires not just a better product but the ability to seamlessly integrate into a complex, mission-critical global logistics network.
Food Service Disposable Market Size and Forecast:
| Report Attribute | Details |
|---|---|
|
Base Year |
2025 |
|
Forecast Year |
2026-2035 |
|
CAGR |
5.2% |
|
Base Year Market Size (2025) |
USD 70.2 billion |
|
Forecast Year Market Size (2035) |
USD 116.6 billion |
|
Regional Scope |
|
Food Service Disposable Market Segmentation:
End user Segment Analysis
Under the end user segment, the commercial is the dominating sub-segment in the food service disposable market and is poised to hold the share value of 75.6% by 2035. The segment is driven by the high volume daily consumption of disposable products for both the dine-in and off-premise service. A key statistical indicator of this demand is the report from the FRED in September 2025, which shows that the retail sales for the food service and drinking places in September 2025 reached USD 99,780 million, reflecting the robust commercial sector activity that directly translates to the disposable packaging consumption. This consistent high level of spending underpins the commercial segments' undisputed market position as it serves as the primary and the most consistent demand generator for all types of food service disposables, from the simple cups to complex meal kits.
Distribution Segment Analysis
The wholesalers and distributors are leading the distribution segment and are poised to hold a significant share value during the forecast period, 2026 to 2035. The dominance is due to their vital role as the logistics hubs that consolidate products from the numerous manufacturers and provide efficient bulk supply to a fragmented base of foodservice operators. The statistical evidence of this segment's scale is found in data from the U.S. Bureau of Labor Statistics in December 2025. The report depicts that the employment in the Merchant Wholesales Nondurable Goods sector, which includes the paper and the disposable product wholesales, accounted for 1,775.3 thousand jobs, highlighting the extensive infrastructure and economic footprint of this vital supply chain intermediary that connects producers with the end user across the country.
Sustainability Segment Analysis
Within the sustainability segment, the biodegradable and compostable sub-segment is the leading sustainability category in the market. This growth is fueled by the regulatory bans on conventional plastics and corporate sustainability pledges, creating a demand for certified products that can integrate into the commercial composting streams. The key government metric supporting this trend is the U.S. Environmental Protection Agency’s advancing sustainable materials management report. The most recent data from the EPA, May 2025, indicates that paper makes 23% of the total municipal waste every year, establishing a baseline for the potential infrastructure and market need for compostable packaging designed to divert this organic waste from landfills, a driver that has accelerated from 2022 onward.
Our in-depth analysis of the market includes the following segments:
|
Segment |
Subsegments |
|
Material Type |
|
|
Product Type |
|
|
Applications |
|
|
Distribution |
|
|
End user |
|
|
Sustainability |
|

Vishnu Nair
Head - Global Business DevelopmentCustomize this report to your requirements — connect with our consultant for personalized insights and options.
Food Service Disposable Market - Regional Analysis
APAC Market Insights
The Asia Pacific is dominating the food service disposable market and is expected to hold the market share of 35.6% by 2035. The market is driven by the explosive urbanization, massive and expanding population growth, and the unparalleled digital adoption of the online food delivery platforms. While the regional growth is robust, it is highly heterogeneous. The major economies, such as Japan and South Korea, represent mature, high-value markets with stringent regulations similar to Europe, creating a demand for advanced sustainable materials. Further, the high-growth markets such as China and India are primarily volume-driven by the rapid urbanization and the expansion of the quick-service restaurant chains, though they are increasingly implementing their own bans on single-use plastics. The overarching trend is a rapid regulation and consumer-driven pivot away from conventional plastics toward paper, bagasse, and other biodegradable alternatives tailored to local food types and waste management infrastructure.
China’s market is the world's largest and is driven by an unparalleled online food delivery ecosystem and a top-down regulatory mandate to phase out non-degradable plastics. The national development and the Reform Commission’s policy bans specific plastic items in phases, directly reshaping supply chains. While the comprehensive national sales data is not publicly disaggregated, the scale of the underlying demand is clear. The People’s Republic of China, in May 2025, reported that the online food delivery users as of December 2024 reached 592 million, highlighting the urgent need for food service disposable products. Further, the massive recurring demand for disposable packaging from the hundreds of millions of monthly orders now requires compliant, often paper-based alternatives. This regulatory-driven shift is accelerating domestic capacity expansion in paper-based and compostable disposable manufacturing.
In India, the market is characterized by rapid growth and a complex regulatory landscape, including central and state-level plastic bans. The cornerstone is the government of India’s plastic waste management rules, which prohibit identified single-use plastic items nationwide. The report from the Central Pollution Control Board states that the enforcement of these rules has led to a significant reduction in the supply of identified SUP items across the country. This further shows the policy’s immediate and substantial impact on the market composition and drives the demand for the compliant substitutes. The report from the PIB May 2025 has indicated that the USD 81.04 billion FDI inflow (FY 2024–25) reflects stronger capital formation across services, manufacturing, logistics, retail, and urban infrastructure, all of which support the expansion of organized foodservice, QSR chains, cloud kitchens, and delivery platforms that rely heavily on disposable packaging.
North America Market Insights
North America is the fastest-growing food service disposable market and is poised to grow at a CAGR of 4.4% during the forecast period 2026 to 2035. The market is driven by the dominance anchored in high per capita consumer spending on the food away from home, a mature food delivery sector, and stringent via fragmented regulatory action against single-use plastics and PFAS chemicals. The primary driver is the legislative push with the multiple U.S. states and a federal ban in Canada, which is pushing a rapid material transition from conventional plastics to paper molded fiber and compliant alternatives. The innovation focuses on the performance within sustainable formats supported by the investments in recycling and composting infrastructure. The market is defined by the consolidation among the major suppliers who can navigate complex compliance and supply chain logistics.
The U.S. market is defined by regulatory fragmentation and compliance-driven material innovation. In the absence of federal law, state-level bans on items such as expanded polystyrene foam and PFAS chemicals are the primary demand drivers. For instance, California’s AB 1200 and similar laws create an immediate need for the PFAS-free fiber-based bowls and containers. The government data confirms the underlying economic activity, with the U.S. Department of Agriculture in September 2025 reporting that the food-away-from-home expenditure reached a record of USD 1.45 trillion in 2023 to USD 1.52 trillion in 2024, sustaining the high volume demand for the packaging across both the regulated and conventional product lines. The U.S. Environmental Protection Agency grants from the Bipartisan Infrastructure Law aim to modernize the domestic recycling infrastructure that is vital for managing new material streams.
In Canada, by 2035, the food service disposable market will undergo a uniform federally mandated transformation. The single-use plastics prohibition regulations prohibit the manufacture, import, and sale of six categories of plastic items, including specific foodservice ware. This creates a clear nationwide shift toward compliant paper fiber and reusable alternatives. The government strategy supports this transition via a direct investment. The Government of Canada, in October 2025, reports that the Zero Plastic Waste Initiative 2018 to 2022 allocated a budget of over USD 5 million for education/awareness and USD 5.2 million for sector solutions. This funding fuels the innovation and infrastructure for compliant material solutions. The market growth is further concentrated in developing products that meet the federal definitions while aligning with the provincial organics collection programs.
Europe Market Insights
The food service disposable market in Europe is fundamentally shaped by the sustainability regulations and is transitioning rapidly. The EU’s single-use plastics directive is the primary catalyst restricting items such as cutlery plates and straws, creating a massive continent-wide demand for compliant alternatives like paper molded fiber and reusable systems. This has driven a significant innovation in sustainable material science. The high consumer awareness of environmental issues further surges this shift, making sustainability a key brand differentiator. The market is advanced but fragmented, with the robust national rules adding complexity. The growth is further concentrated in high-performance sustainable formats mainly for the booming online food delivery sectors that demand functional, eco-friendly packaging solutions such as leak resistant fiber based containers.
The food service disposable market in Germany is driven by the robust enforcement of the EU single-use plastics directive and one of the continent’s most advanced waste management and recycling systems. The country’s packaging act mandates high recycling quotas and holds producers financially responsible, creating a strong incentive for designing recyclable and reusable foodservice items. A key statistical trend is the significant reduction in the plastic packaging waste which is decreased significantly. This indicates a successful early shift in material use away from the conventional plastics, fueling the demand for the certified compostable and mono material solutions that align with Germany’s Dual System for the efficient sorting and recycling. This regulatory environment ensures sustained B2B demand for compliant disposable formats.
In the UK, the food service disposable market has established its own regulatory framework, notably the plastic packaging tax. This tax applies at the rate of £210.82 per ton in April 2023 on plastic packaging with less than 30% of it is recycled content, based on the Government of UK in April 2025, directly altering procurement economies for foodservice operators and suppliers. This policy has stimulated the adoption of recycled content and alternative material packaging. It has also accelerated supplier reformulation efforts to ensure compliance across national distribution networks. Further, the public-sector and contract catering buyers increasingly embed the tax alignment into the tender evaluations. As a result, the long-term sourcing strategies in the UK favor compliant disposable formats over conventional plastics.
Key Food Service Disposable Market Players:
- Dart Container Corporation (U.S.)
- Company Overview
- Business Strategy
- Key Product Offerings
- Financial Performance
- Key Performance Indicators
- Risk Analysis
- Recent Development
- Regional Presence
- SWOT Analysis
- Pactiv Evergreen Inc. (U.S.)
- Graphic Packaging Holding Company (U.S.)
- Novolex Holdings, LLC (U.S.)
- Berry Global Group, Inc. (U.S.)
- Huhtamäki Oyj (Finland)
- Genpak, LLC (A Novolex Company) (U.S.)
- Sabert Corporation (U.S.)
- Reynolds Consumer Products Inc. (U.S.)
- CKF Inc. (Canada)
- Be Green Packaging LLC (U.S.)
- Duni AB (Sweden)
- Vegware Ltd (UK)
- Solia (France)
- Faerch A/S (Denmark)
- Genecis (U.S.)
- Toppan Printing Co., Ltd. (Japan)
- Doypack (India) Pvt. Ltd. (India)
- Golden Aspect Sdn Bhd (Malaysia)
- Detpak (Australia)
- Dart Container Corporation is a global titan in the market and has significantly advanced the industry by pioneering the large-scale integration of post-consumer recycled and mass balance advanced recycled resins into its product lines. This material science advancement ensures reliable high-volume production of cups and containers with a reduced carbon footprint, optimizing sustainability for the major quick service restaurant chains without compromising performance.
- Pactiv Evergreen Inc. is a top player in the fiber-based packaging within the food service disposable market. The company has made significant advancements by strategically expanding its EcoCraft and Evergreen product portfolios. This expansion is focused on 100% recycled content, and PFAS free barrier ensures a comprehensive suite of sustainable solutions for fresh and prepared foods, optimizing the brand's compliance with the evolving regulatory and consumer environmental demands. The company has witnessed a 30% of hike in the revenue sales in fiber-based packaging products.
- Graphic Packaging Holding Company is a pioneer in paperboard and fiber packaging within the food service disposable market and has significantly advanced its market position via strategic acquisitions and capital investments in molded fiber production. This advancement, such as the expansion of its Kinston, NC facility, ensures increased capacity for the compostable clamshells and trays, optimizing the supply of the sustainable alternatives to plastic for protein produce and foodservice packaging. The company has made the net sales of USD 8,807 million in 2024 based on the annual report.
- Novolex Holdings, LLC is a major player in the market and has significantly advanced its service capabilities via strategic acquisitions such as Protects Premium Frozen Packaging and Biopac UK. This advancement ensures an expanded portfolio that spans from the insulated delivery packaging to European-sourced sustainable fiber products, optimizing the company’s ability to provide end-to-end geographically diverse solutions for the cold chain logistics and foodservice.
- Berry Global Group Inc is a key innovator in engineered materials for the food service disposable market and has significantly advanced the circular economy pathway by forming strategic partnerships in advanced recycling technology. This advancement ensures future access to certified circular polymers, optimizing the potential for incorporating high levels of recycled content into high-performance food contact films, lids, and rigid packaging while maintaining necessary safety and barrier properties.
Here is a list of key players operating in the global market:
The global food service disposable market is highly consolidated and competitive, with sustainability as the central strategic driver. The top players, such as the Dart, Pactiv, and Huhtamaki, are pursuing aggressive initiatives on three fronts, such as the acquisitions to boost the sustainable portfolios, heavy R&D in PFAS-free and compostable materials, and partnerships with brands and waste managers to enable circular systems. The companies in Europe are pioneering reusable models, while the players in North America are leveraging scale. The regional players in the Asia Pacific, such as Toppan and Detpak, compete via localized innovation and cost-effective solutions amidst rising regional demand. The recent acquisition is Arbor Investments ' acquisition of Acxion Foodservice in September 2025.
Corporate Landscape of the Food Service Disposable Market:
Recent Developments
- In July 20225, WinCup, Inc., a leading national manufacturer of disposable foodservice products, has announced the acquisition of the paper cup company ConverPack Inc., a global manufacturer of hot and cold paper cups, in a strategic decision that will bolster the company’s capability to manufacture more eco-friendly foodservice products.
- In May 2025, ProMach, a worldwide leader in processing and packaging machinery and related solutions, announced the acquisition of DJS Systems, a leader in disposable food service packaging automation. DJS Systems is a well-known and respected automation partner for many of the best-known disposable food service packaging providers in the U.S.
- In September 2024, Quit Plastic has announced the launch of a 1000ml sugarcane Bagasse rectangular white food container with lids for takeout. It is mainly designed for the takeaway restaurants, cafes, cloud kitchens, and other food service establishments.
- Report ID: 2808
- Published Date: Dec 22, 2025
- Report Format: PDF, PPT
- Explore a preview of key market trends and insights
- Review sample data tables and segment breakdowns
- Experience the quality of our visual data representations
- Evaluate our report structure and research methodology
- Get a glimpse of competitive landscape analysis
- Understand how regional forecasts are presented
- Assess the depth of company profiling and benchmarking
- Preview how actionable insights can support your strategy
Explore real data and analysis
Frequently Asked Questions (FAQ)
Food Service Disposable Market Report Scope
Free Sample includes current and historical market size, growth trends, regional charts & tables, company profiles, segment-wise forecasts, and more.
Connect with our Expert


Copyright @ 2026 Research Nester. All Rights Reserved.
