Solar Power Equipment Market Outlook:
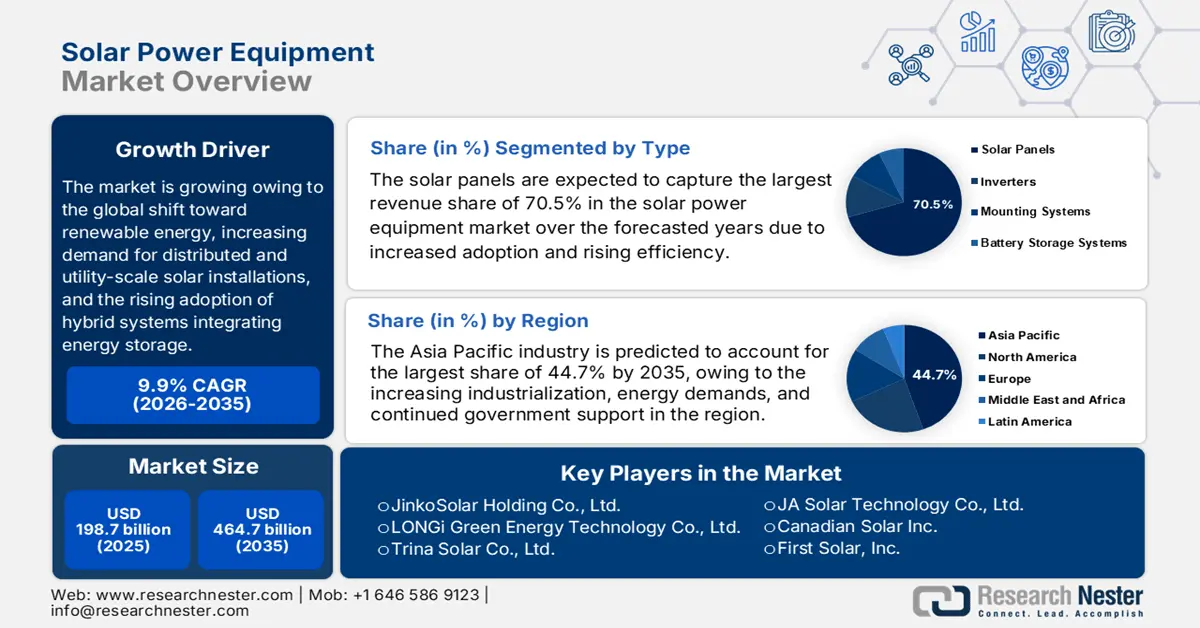
Solar Power Equipment Market size was valued at USD 198.7 billion in 2025 and is projected to reach USD 464.7 billion by the end of 2035, rising at a CAGR of 9.9% during the forecast period, i.e., 2026-2035. In 2026, the industry size of solar power equipment is evaluated at USD 218.3 billion.
The international solar power equipment market is poised for extensive growth in the years ahead, owing to the global shift toward renewable energy, increasing demand for distributed and utility-scale solar installations, and the rising adoption of hybrid systems integrating energy storage. In this regard, the U.S. Department of Energy in September 2024 disclosed that its loan programs office is actively supporting domestic solar PV manufacturing, wherein around 50 GWdc of annual solar manufacturing capacity has been announced under the Inflation Reduction Act, with more than 35 operational factories producing modules, inverters, trackers, and balance-of-system components. The report also mentioned that domestic PV module capacity is expected to reach 40 GW by 2026, by supplying up to 80% of projected demand. Simultaneously, the projects, such as Qcells’ USD 1.45 billion Cartersville facility, will produce ingots, wafers, cells, and panels, reshoring production from China and Southeast Asia, hence enhancing supply chain resiliency and supporting both distributed and utility-scale projects across the U.S.
Furthermore, the U.S. solar power equipment market benefits from technological advancements, federal and state incentives, and increasing demand for utility- and residential-scale solar systems. Testifying to this, Congress.gov in November 2024 reported that over the last decade, the U.S. solar photovoltaics sector has rapidly expanded, in which the domestic manufacturing capacity for key PV components such as polysilicon, wafers, cells, and modules has increased substantially, though imports remain essential to meet overall demand. It also stated that federal incentives such as the Inflation Reduction Act and trade policies have spurred investments in domestic production, thereby enhancing supply chain resilience and workforce development. In addition to continued policy support and growing utility-scale, residential, and commercial installations, the solar power equipment market is poised for sustained growth.
U.S. Solar Photovoltaic Manufacturing Capacity: 2023-2024 and Planned Additions by Stage (GWDC)
|
Stage |
2023 |
2024 |
Planned Additions (GW) |
|
Silicon/Polysilicon (GWDC) |
1.3 |
34.5 |
8.0 |
|
Ingots (GWDC) |
n/a |
n/a |
5.0 |
|
Wafers (GWDC) |
0 |
n/a |
16.0 |
|
Cells (GWDC) |
0 |
n/a |
33.2 |
|
Modules (GWDC) |
2.7 |
33.9 |
19.5 |
Source: Congress.gov
Key Solar Equipment Market Insights Summary:
Regional Highlights:
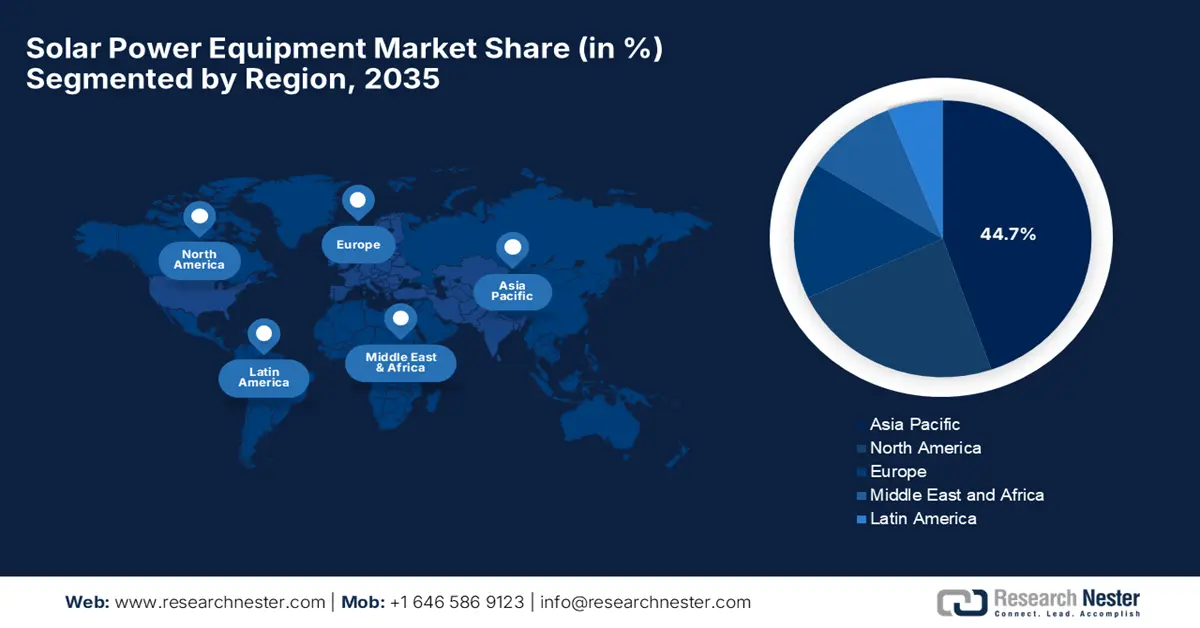
- Asia Pacific in the solar power equipment market is projected to account for a leading 44.7% revenue share by 2035, reinforcing its dominance over the forecast period, propelled by rapid industrialization, escalating energy demand, and sustained government support for renewable energy initiatives
- North America is anticipated to expand at a strong pace through 2035, strengthening its market position across the forecast timeline, supported by favorable government policies and rising consumer demand for renewable energy
Segment Insights:
- Solar Panels in the solar power equipment market are expected to capture a dominant 70.5% revenue share by 2035, reflecting continued leadership across the forecast horizon, driven by rising adoption rates and improving panel efficiency
- Photovoltaics are set to secure a considerable share by 2035, maintaining their revenue prominence across end-use applications, aided by continuous advancements in panel efficiency and cost-effective energy generation
Key Growth Trends:
- Government policies & incentives
- Technological improvements
Major Challenges:
- Supply chain constraints
- Policy and regulatory uncertainty
Key Players: JinkoSolar Holding Co., Ltd., LONGi Green Energy Technology Co., Ltd., Trina Solar Co., Ltd., JA Solar Technology Co., Ltd., Canadian Solar Inc., First Solar, Inc.
Global Solar Equipment Market Forecast and Regional Outlook:
Market Size & Growth Projections:
- 2025 Market Size: USD 198.7 billion
- 2026 Market Size: USD 218.3 billion
- Projected Market Size: USD 464.7 billion by 2035
- Growth Forecasts: 9.9% CAGR (2026-2035)
Key Regional Dynamics:
- Largest Region: Asia Pacific (44.7% Share by 2035)
- Fastest Growing Region: North America
- Dominating Countries: United States, China, Germany, Japan, India
- Emerging Countries: India, Vietnam, Brazil, Mexico, Indonesia
Last updated on : 19 December, 2025
Solar Power Equipment Market - Growth Drivers and Challenges
Growth Drivers
- Government policies & incentives: Most of the nations across the world are offering subsidies, tax rebates, and feed-in tariffs, which efficiently reduce upfront costs and encourage investment in solar infrastructure. Therefore, the presence of such policies is stimulating consistent demand for solar panels, inverters, and other equipment. The Government of India in August 2025 reported that the country has implemented many solar incentives to accelerate renewable adoption, which include PM Surya Ghar for rooftop electricity, PM-KUSUM for farmer solar pumps, and large-scale solar parks for utility generation. The report also mentioned that these schemes offer financial support for domestic manufacturing, thereby boosting the production of solar modules from 38 GW to 74 GW and PV cells from 9 GW to 25 GW in FY 2024-25. Furthermore, the initiatives such as floating solar projects, agrivoltaics, and PM JANMAN are focused on land-efficient energy generation and the electrification of tribal regions, hence positively impacting the solar power equipment market growth.
India Solar Incentives & Statistical Data (2025)
|
Initiative |
Objective |
Support |
Capacity |
|
PM Surya Ghar |
Rooftop solar for households |
₹30,000-₹78,000 (USD 360-940) per system |
1 crore households; up to 300 units free/month |
|
PM-KUSUM |
Solar pumps & farmer-owned solar plants |
30-50% subsidy |
Plants up to 2 MW; selling to DISCOMs |
|
Solar Parks Scheme |
Utility-scale solar projects |
Central funding & approvals |
Target 40 GW by Mar 2026; 53 parks approved, 39,323 MW |
|
PM JANMAN |
Electrification of tribal areas |
₹515 crore (USD 62.0 million) |
1 lakh households in 18 states |
|
Solar PV Manufacturing |
Domestic production support |
Policies + BCD on imports |
Modules: 38 → 74 GW, PV cells: 9 → 25 GW |
|
Floating Solar Projects |
Efficient use of water bodies |
₹49.85 crore (USD 6.0 million) central support |
Omkareshwar 600 MW (Asia’s largest) |
|
ISA & OSOWOG |
Global solar collaboration |
Investment & tech support |
100+ countries; USD 1 trillion mobilization by 2030 |
Source: Government of India
- Technological improvements: The advances in terms of solar technology, which include high-efficiency PV cells, bifacial modules, and integrated inverters, are reducing the cost per watt and improving the total energy output. Simultaneously, the innovations in terms of energy storage systems and smart grid integration are also enhancing the value of solar equipment, making solar power more attractive for a wider range of applications. In August 2025, Oxford PV reported that it had set a new world record with its perovskite-on-silicon tandem solar panels, by achieving 25% efficiency higher when compared to the typical 21% to 23% of commercial modules. Besides, it is developed with Fraunhofer ISE, wherein the panels deliver 421 W over 1.68 m² using scalable industrial processes, enabling more power generation from the same area. Furthermore, this reduces electricity costs and accelerates the adoption of clean energy across residential, commercial, and utility sectors, hence contributing to solar power equipment market growth.
- Rising energy demand: This, coupled with the sustainability goals, is consistently driving business in the solar power equipment market. Also, the governments, corporations, and residential consumers are making a shift towards renewable energy sources to meet sustainability targets. In this regard, the Government of India in December 2025 reported that rising energy demand in the country, evidenced by a 5.21% increase in electricity generation to 1,829.69 BU in 2024-25 and a meta peak of 241 GW with near-zero shortage, coupled with sustainability goals, is driving consistent growth in the solar power equipment market. Also, the Government initiatives, such as PM Surya Ghar, adding ~7 GW of clean energy and connecting ~24 lakh households, and non-fossil sources currently account for over 50% of the 505 GW installed capacity, which are efficiently accelerating the adoption of solar technologies, hence denoting a positive solar power equipment market outlook.
Challenges
- Supply chain constraints: This is a major hampering factor for the solar power equipment market, negatively impacting both manufacturing and project deployment timelines. Besides the critical components, such as polysilicon, wafers, inverters, and battery cells, which are sometimes subject to raw material price volatility, international trade restrictions, thereby straining manufacturers in this field. In addition, geopolitical tensions and regional manufacturing dependencies, particularly in China and Southeast Asia, are complicating the logistics of sourcing and delivering essential equipment. Hence, the presence of these constraints can lead to increased costs for project developers and longer lead times, ultimately causing a delay for commissioning schedules.
- Policy and regulatory uncertainty: This remains as yet another obstacle for the expansion of the solar power equipment market since the project economics are influenced by government incentives, tariffs, and renewable energy mandates. Any changes in feed-in-tariffs, subsidy programs can alter the project viability, thereby affecting both domestic and international investments. In addition, the continuously changing domestic regulations in terms of grid interconnection and environmental approvals may add to burgeoning compliance expenses, making it challenging for small-scale manufacturers. Therefore, manufacturers and developers must closely monitor policy landscapes and actively engage with government agencies to navigate these uncertainties.
Solar Power Equipment Market Size and Forecast:
| Report Attribute | Details |
|---|---|
|
Base Year |
2025 |
|
Forecast Year |
2026-2035 |
|
CAGR |
9.9% |
|
Base Year Market Size (2025) |
USD 198.7 billion |
|
Forecast Year Market Size (2035) |
USD 464.7 billion |
|
Regional Scope |
|
Solar Power Equipment Market Segmentation:
Type Segment Analysis
In the type segment, the solar panels are expected to capture the largest revenue share of 70.5% in the solar power equipment market over the forecasted years. The rising adoption, increased efficiency are the key factors driving the subtype’s leadership. In July 2025, Tata Power Renewable Energy Ltd. announced the launch of the Ghar Ghar Solar campaign in Jaipur to accelerate residential rooftop solar adoption, offering systems from ₹7,499 (USD 83.4) for 2 kW with affordable monthly instalments and central subsidies under the PM Surya Ghar Yojana. The company also mentioned that this initiative aims to install 125 MW of rooftop capacity in Rajasthan this financial year, supported by 39 local channel partners and strategic MoUs with the state’s Discoms. Furthermore, TPREL also introduced lifestyle solutions, MySine for solar + battery backup, and solar design spaces for aesthetic installations, hence increasing the demand for solar panels.
Solar Technology Segment Analysis
In the solar power equipment market, photovoltaics is set to grow with a considerable share by the end of 2035, owing to the continued advancements in panel efficiency. This makes it highly prioritized by residential, commercial, and utility-scale deployments. Also, the subtype’s cost-effectiveness, coupled with the higher returns on energy generation, is positioning it at the forefront of revenue generation in this field. In March 2025, Alpex Solar Limited announced that it had secured a Rs 210.71 crore (USD 25.5 million) order from SECI to supply advanced solar PV modules across India, to be completed within nine months using its expanded 1.2 GW Greater Noida facility. Besides, the company recently also won a Rs 45 crore (≈ USD 5.5 million) order from MSEDCL for 2,000 solar water pumps under the Magel Tyala Saur Krushi Pump scheme, thereby supporting clean energy in agriculture. Furthermore, Alpex is also expanding its manufacturing footprint with a 1.6 GW solar cell facility in Mathura and additional units for aluminum frames and PV module production, hence denoting a wider segment scope.Top of Form
End user Segment Analysis
Based on the end user, the utility-scale segment is expected to lead the solar power equipment market by 2035, capturing a significant revenue share. The renewable energy adoption, tax rebates, and increasing environmental awareness are the primary fueling factors for the subtype. Rising energy demand, supported by government initiatives which are aimed at cost reduction, also propels the segment’s progress. Technological advancements in solar solutions, battery storage integration, and smart energy management systems are enhancing adoption rates. Financial schemes and easy financing options make solar installations more accessible across, whereas the growing corporate and community awareness around sustainability encourages a shift toward distributed utility-scale solar systems, strengthening long-term solar power equipment market potential. Furthermore, international investments in renewable infrastructure and the decreasing cost of photovoltaic panels are expected to further accelerate solar power equipment market expansion.
Our in-depth analysis of the solar power equipment market includes the following segments:
|
Segment |
Subsegments |
|
Type |
|
|
Solar Technology |
|
|
End user |
|
|
Installation Type |
|
|
System Configuration |
|
|
Energy Storage |
|

Vishnu Nair
Head - Global Business DevelopmentCustomize this report to your requirements — connect with our consultant for personalized insights and options.
Solar Power Equipment Market - Regional Analysis
APAC Market Insights
Asia Pacific is all set to lead the entire solar power equipment market, capturing the largest revenue share of 44.7% by the end of 2035. The growth of the region is efficiently propelled by increasing industrialization, energy demands, and continued government support for renewable energy initiatives. In June 2025, Solarium Green Energy Limited announced that it is re-entering solar module manufacturing with a fully automated 1000 MW facility in Gujarat, at an estimated capex of ₹70 crore (USD 8.5 million), thereby aiming to enhance supply chain security and improve EPC project margins. Besides, the plant will produce advanced crystalline silicon PV modules using TOPCon, half-cut, and bifacial cell technologies, wherein the commercial operations are expected from the fourth quarter of the year. Furthermore, this backward integration is set to strengthen Solarium’s residential, commercial offerings by generating more than ₹1,000 crore (~USD 121 million) in revenue at 85% utilization.
China represents one of the largest landscapes for the solar power equipment market, due to its strong climate targets. The country is making continued investments in utility-scale solar projects and expanding distributed rooftop solar installations in both urban and industrial areas. JinkoSolar Holding Co., Ltd., in November 2025, announced its 2025 financial results for the 2nd and 3rd quarters, reporting total module shipments of 61.9 GW for the first three quarters, with more than 65% shipped overseas. Besides, the company has achieved record milestones, which include cumulative shipments of 370 GW and high-efficiency TOPCon cells reaching 27.2% to 27.4%. In addition, revenues were USD 2.51 billion in Q2 and USD 2.27 billion in Q3, whereas the adjusted net losses narrowed sequentially to USD 5 million and USD 4 million, respectively. The firm highlighted strong growth in its energy storage business with cumulative ESS shipments exceeding 3.3 GWh, hence positioning it as a key driver for future profitability.
China’s Solar Cell, Wafer, and Panel Exports and India’s Import Trends (H1 2025)
|
Metric |
Value (H1 2025) |
Notes |
|
China’s share of cells & wafers in solar exports |
>40% |
Cells are now larger than wafers in share |
|
Year-on-year growth of China’s cell exports |
+76% |
+19 GW vs H1 2024 |
|
Year-on-year growth of China’s wafer exports |
+26% |
+8.6 GW vs H1 2024 |
|
China’s panel exports growth |
-5.2% |
-6.7 GW vs H1 2024 |
|
Combined China solar product exports (capacity) |
+11% |
Compared to H1 2024; total 208 GW |
|
China cell exports 2022 → 2024 |
23 GW → 57 GW |
+144% over 2 years |
|
China wafer exports 2022 → 2024 |
36 GW → 60 GW |
+67% over 2 years |
|
Average monthly exports H1 2025 |
Cells: 7.5 GW, Wafers: 7 GW |
Each month > Portugal’s total installed capacity (6.3 GW) |
|
Fall in China solar cell prices since Aug 2022 |
USD 0.19/W → USD 0.03/W |
-82% |
|
Fall in China panel prices since Aug 2022 |
USD 0.29/W → USD 0.09/W |
-63% |
|
India’s share of the China cell export growth |
52% |
Largest contributor globally |
|
India’s imports of Chinese cells (H1 2025) |
21 GW |
Almost double H1 2024 (11 GW) |
|
India’s solar manufacturing capacities (March 2025) |
Panels: 68 GW, Cells: 25 GW |
Target: Panels 120 GW by 2030 |
|
India’s solar capacity addition in 2024 |
Panels: 36 GW, Cells: 16 GW |
Domestic installation growth |
Source: Ember
India is continuously growing in the solar power equipment market, efficiently fueled by government backing, with a prime focus on expanding renewable energy capacity and providing affordable energy access across urban and rural regions. The country’s solar power equipment market also benefits from the push for residential rooftop solar, utility-scale projects, which are rapidly accelerating adoption, with extended support from policy measures. Maruti Suzuki India in June 2025 Limited announced that it had commissioned a 20 MWp project at Kharkhoda and added 10 MWp at Manesar, thereby increasing total capacity from 49 MWp to 79 MWp, hence expanding its solar capacity by 30 MWp. Besides, the company also aims to reach 319 MWp by FY2030-31, making an investment of more than INR 925 crore (USD 112 million), targeting 85% of electricity consumption from renewable sources. Hence, these initiatives reflect the firm’s commitment to sustainable manufacturing and alignment with India’s renewable energy goals.
North America Market Insights
North America is exponentially growing in the global solar power equipment market owing to the presence of suitable government policies and rising consumer demand for renewable energy. The presence of pioneering companies and their strategic initiatives also positions North America as a predominant leader in this field. As per the article published by NREL in August 2024, the U.S. market saw a significant shift in 2024, wherein the utility-scale PV installations (12.7 GWac) and commercial & industrial projects (1.2 GWac) grew 111% and 76% respectively, whereas the residential installations (1.6 GWac) declined 52%. Besides, Texas, Florida, and California continued to lead installations, though a broader set of states contributed increasingly to overall growth, reflecting nationwide adoption. Furthermore, it projects a steady increase in U.S. PV deployment by 2028, wherein the residential PV shows the highest CAGR of 5% to 6%, hence highlighting sustained solar power equipment market expansion across all segments.
The U.S. is identified as the leader in the regional solar power equipment market, highly propelled by the tax credits and the presence of a wide range of solar technologies such as photovoltaic and concentrated solar power systems. The companies in the country are elevating the market potential with their innovative solutions. In June 2024, Hanwha Qcells announced that it had completed the 50 MW Ocotillo Wells Solar project in Borrego Springs, California, coupled with a 200 MWh battery energy storage system, thereby supplying renewable energy to Meta. Besides, the company also managed the EPC, leveraging its U.S. solar manufacturing and utility-scale expertise to deliver an integrated clean energy solution. Hence, this project strengthens Hanwha Qcells’ role in supporting corporate renewable goals by the U.S. solar and energy storage sectors, thus contributing to stronger solar power equipment market expansion.
Canada also gained strong exposure in the solar power equipment market, driven by increasing adoption of renewable energy solutions, government incentives, and a national focus on decarbonization. Additionally, rising electricity demand and growing environmental awareness among both consumers and businesses are also boosting the uptake of solar power solutions. In June 2025, Canadian Solar presented its first-quarter 2025 results, which underscore the firm’s strong presence in the market, since it has 6.9 GW of solar module shipments across more than 70 countries and a gross margin of 11.7%. Besides, its recurrent energy segment holds a global solar project pipeline of 26.9 GWp and a battery energy storage pipeline of 75.7 GWh, whereas its e-STORAGE division maintains a turnkey pipeline of over 91 GWh with a USD 3.2 billion contracted backlog. Hence, this combination of large-scale manufacturing and energy storage solutions positions the company as a dominant force in this solar power equipment market.
Europe Market Insights
Europe is rearranging the growth dynamics in the global solar power equipment market, capturing a significant revenue stake from 2026 to 2035. The regional growth is highly attributed to stringent regulatory bodies and climatic goals. Simultaneously, the European Union leverages the Green Deal and other national incentives, which play a highly essential role in promoting solar energy adoption. In July 2025, SolarPower Europe announced the launch of the Battery Storage Europe platform, which highlights the growing integration of battery energy storage with solar power systems across the EU. Also, the initiative calls for a tenfold increase in battery storage capacity by the conclusion of 2030 to support rising solar deployments, strengthen grid resilience, and enhance energy security. Hence, such developments underscore strong regulatory and industry momentum for advanced solar power equipment and storage solutions, reinforcing the region’s leadership in the clean energy transition.
In Germany, the solar power equipment market is progressing on account of a strong commitment to the energy transition and support for renewable energy adoption. Simultaneously, the continuous expansion of rooftop and utility-scale solar projects, coupled with a mature grid infrastructure, is sustaining heightened demand for advanced solar modules, inverters, mounting systems, and balance-of-system components. In November 2025, Statkraft announced that it had commissioned the country’s largest solar-plus-battery hybrid power plant under the EEG in Zerbst, combining a 46.4 MW solar park with a 16 MW / 57 MWh battery storage system, developed and grid-connected in-house within a 12-month construction timeline. The firm also mentioned that this project generates nearly 50,000 MWh of renewable electricity on a yearly basis, supplying power to around 14,000 households while reducing approximately 32,000 tonnes of CO₂ emissions each year. Furthermore, with an investment of about EUR 45 million (USD 49 to 50 million), the hybrid plant enhances grid stability, improves solar profitability through storage.
The U.K. is also solidifying its position in the regional solar power equipment market owing to the ever-increasing adoption of rooftop solar, growing utility-scale installations, and increasing interest in hybrid systems. In addition, growing corporate sustainability initiatives and community-led renewable projects are efficiently expanding market reach in the country. In September 2025, Solarwatt announced that it had introduced commercial and industrial battery storage solutions, thereby enabling large-scale solar-plus-storage projects to be delivered from a single source across Europe. Besides the new AC and DC hybrid storage systems support higher self-consumption, grid optimization, and emergency power supply, thereby helping businesses significantly reduce energy costs and improve return on investment. Furthermore, this expansion strengthens Solarwatt’s position in the commercial solar power equipment market, hence aligning with growing demand for integrated solar and energy storage solutions.
Key Solar Power Equipment Market Players:
- JinkoSolar Holding Co., Ltd. (China)
- Company Overview
- Business Strategy
- Key Product Offerings
- Financial Performance
- Key Performance Indicators
- Risk Analysis
- Recent Development
- Regional Presence
- SWOT Analysis
- LONGi Green Energy Technology Co., Ltd. (China)
- Trina Solar Co., Ltd. (China)
- JA Solar Technology Co., Ltd. (China)
- Canadian Solar Inc. (Canada)
- First Solar, Inc. (U.S.)
- Hanwha Q CELLS Co., Ltd. (South Korea)
- SolarEdge Technologies, Inc. (Israel)
- Enphase Energy, Inc. (U.S.)
- Huawei Technologies Co., Ltd. (China)
- Sungrow Power Supply Co., Ltd. (China)
- SMA Solar Technology AG (Germany)
- Fronius International GmbH (Austria)
- Nextracker, Inc. (U.S.)
- Array Technologies, Inc. (U.S.)
- JinkoSolar Holding Co., Ltd. is identified as one of the world’s largest solar module manufacturers, which has a strong international footprint across Asia, Europe, and the Americas. The company is focused on high-efficiency N-type TOPCon technology, continuous capacity expansion, and vertical integration across wafers, cells, and modules. JinkoSolar is emphasizing large-scale manufacturing and innovation to serve a wide range of markets.
- LONGi Green Energy Technology Co., Ltd. is a leading player in this field, which is leveraging mono-crystalline solar. The firm makes heavy R&D investments to improve cell efficiency and reduce the levelized cost of electricity. Besides, LONGi’s strategic initiatives include expanding global manufacturing capacity, strengthening supply chain resilience, and promoting green manufacturing practices, thereby supporting large-scale solar deployment.
- Trina Solar Co., Ltd. is yet another major force in this field, which is offering modules, trackers, and smart energy solutions. The prime focus of the company lies in system-level optimization, which also includes high-power modules and intelligent tracking systems. Furthermore, Trina Solar also focuses on expanding its smart solar and energy storage portfolio, thereby enabling higher energy yields and supporting the transition toward hybrid and digitally optimized solar power systems.
- First Solar, Inc. specializes in advanced thin-film photovoltaic technology and serves utility-scale solar projects primarily. Besides, the company differentiates itself through strong intellectual property, low-carbon manufacturing processes, and long-term performance reliability. In addition to expanding U.S. and international manufacturing facilities, strengthening domestic supply chains is one of the strategies opted for by the firm to secure its market position.
- Canadian Solar Inc. operates as both a leading solar equipment manufacturer and a global project developer. The firm’s strategy centers on diversified offerings, which include solar modules, inverters, as well as battery energy storage solutions. Canadian Solar continues to expand its manufacturing footprint and downstream project portfolio by leveraging vertical integration to manage costs and capitalize on the growing demand for solar-plus-storage solutions across the globe.
Below is the list of some prominent players operating in the global solar power equipment market:
The global solar power equipment market is competitive, in which the China-based manufacturers dominate module and cell production owing to the scale and cost advantages, whereas the U.S. and Europe-based firms are leading in terms of advanced power electronics and tracking systems. Besides, leading pioneers in this field are making strong investments in efficiency improvements, vertical integration, and global expansions to secure market share. In May 2025, ReNew announced that it made an investment of approximately INR 22,000 crore (USD 2.5 billion) to develop one of the largest hybrid renewable energy projects in Andhra Pradesh, India, by combining 1.8 GW of solar, 1 GW of wind, and 2 GWh of battery energy storage. Also, the project will deploy domestically manufactured solar modules, advanced tracking systems, and large-scale BESS to enable firm and dispatchable renewable power. Hence, this development highlights strong demand for utility-scale solar equipment, hybrid systems, and energy storage solutions in India.
Corporate Landscape of the Solar Power Equipment Market:
Recent Developments
- In December 2025, PowerBank Corporation announced a 5 MW AC distributed solar and battery energy storage project in New York, which is expected to benefit from NYSERDA incentives and support community solar deployment.
- In December 2025, ITOCHU Corporation announced that it had invested in the black hollow sun solar power project in Colorado, which has a total capacity of 324 MWdc (258 MWac), will supply renewable energy to approximately 73,000 households, making it the largest photovoltaic installation.
- In December 2025, Solidcore Resources notified that it has commissioned a 22.6 MW solar power plant at its Varvara site in Kazakhstan, which will generate about 28.5 million kWh annually and reduce indirect emissions by 50% backed by investments of USD 13.4 million for solar.
- In October 2025, Vikram Solar introduced its next-generation Hypersol Pro N-type solar PV modules at the REI Expo 2025, featuring efficiencies of up to 23.69% and power output reaching 640 Wp that are designed to minimize energy losses and support hybrid and battery-integrated solar systems.
- Report ID: 594
- Published Date: Dec 19, 2025
- Report Format: PDF, PPT
- Explore a preview of key market trends and insights
- Review sample data tables and segment breakdowns
- Experience the quality of our visual data representations
- Evaluate our report structure and research methodology
- Get a glimpse of competitive landscape analysis
- Understand how regional forecasts are presented
- Assess the depth of company profiling and benchmarking
- Preview how actionable insights can support your strategy
Explore real data and analysis
Frequently Asked Questions (FAQ)
About this Report
Connect with our Expert

Report, 2026-2035


Copyright @ 2026 Research Nester. All Rights Reserved.
