Energy Harvesting System Market Outlook:
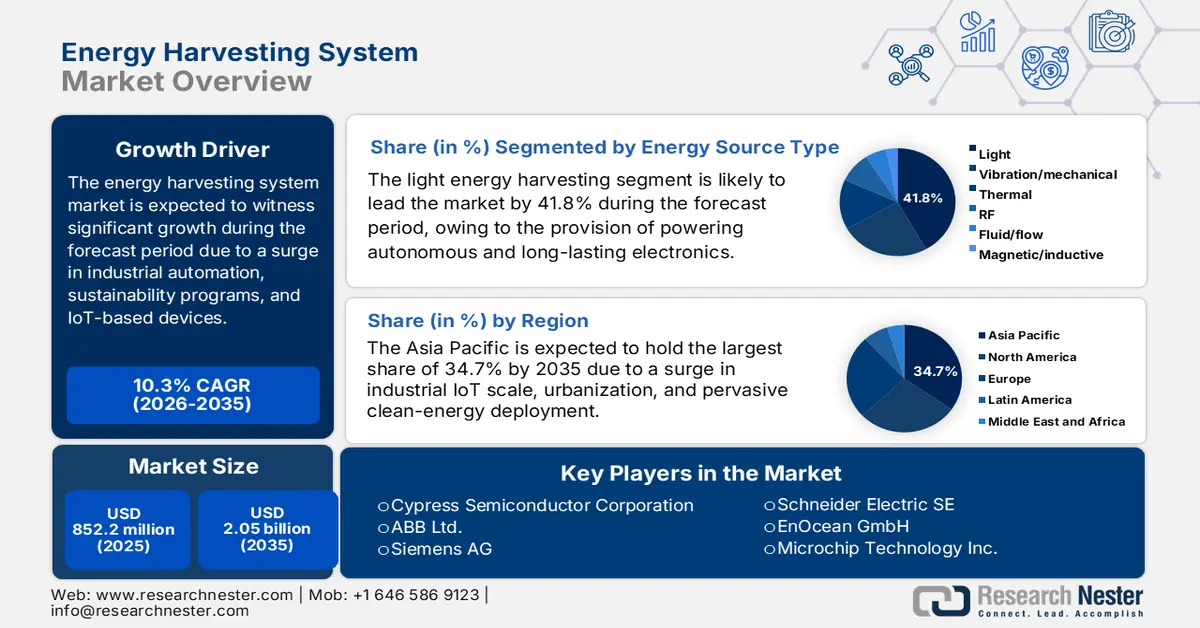
Energy Harvesting System Market size was over USD 852.2 million in 2025 and is estimated to reach USD 2.05 billion by the end of 2035, expanding at a CAGR of 10.3% during the forecast timeline, i.e., 2026-2035. In 2026, the industry size of energy harvesting system is estimated at USD 939.8 million.
The international energy harvesting system market’s growth significantly reflects the increased dependency on industrial automation, smart buildings, and self-powered IoT devices, along with the availability of government-driven sustainability programs. Besides, according to an article published by NLM in August 2025, with the sudden emergence of IoT and artificial intelligence, sensor network has become a cornerstone technology, and more than 30 billion devices are projected to be connected by the end of 2025. In this regard, the surrounding magnetic field in high-voltage power cable environments constitutes a magnetic induction intensity at ±660 kV converter station. Additionally, the maximum magnetic induction intensity is recorded at 1.5 m distance above ground level and outside the pole grid, thus reaching 353 μT. Therefore, with such presence of technologies, there is a huge growth opportunity for the market.
Indirect Magnetic Field Energy Harvesting Technology (2025)
|
Structure Type |
Piezoelectric/Magnetostriction Material |
Maximum Output Voltage |
Maximum Output Power/ Power Density |
Frequency Collection |
|
Cantilever beam stacking structure |
PZT-5H Ni |
40.3 v (1.8 Hz) |
0.87 mW |
50 Hz |
|
Turning fork structure |
PZT-5H ST |
100 V |
72 mW |
60 Hz |
|
Cantilever beam laminated structure |
PMN-PZT Metglas |
36.5 V (100 Hz 0.02 g) |
1.25 mW |
60 Hz |
|
Clamp cantilever beam |
PZT Copper |
1.775 V |
970 μW |
50 Hz |
|
Imitating dragonfly structure |
PZT TC4 |
45.5 V |
4.45 mW |
50.5 Hz |
Source: NLM
Furthermore, the IoT integration, healthcare and wearable devices, miniaturization, smart infrastructure, hybrid systems, and sustainability push are other trends that are readily driving the energy harvesting system market globally. As per an article published by NLM in March 2023, various individuals have migrated across urban locations, and it is further predicted that by the end of 2030, 60% of the international population is poised to reside in urban regions. Therefore, different types of smart applications are unveiled to ensure an easy lifestyle, which positively contributes to smart city development. Besides, as stated in a report published by the UNEP Organization in November 2023, greenhouse gas emissions are projected to increase by 16% by the end of 2030, which currently denotes a 3% projection increase. However, the emission has been predicted to reduce by 28% based on the 42 per cent for the 1.5°C pathway and the Paris Agreement 2°C pathway.
Key Energy Harvesting System Market Insights Summary:
Regional Insights:
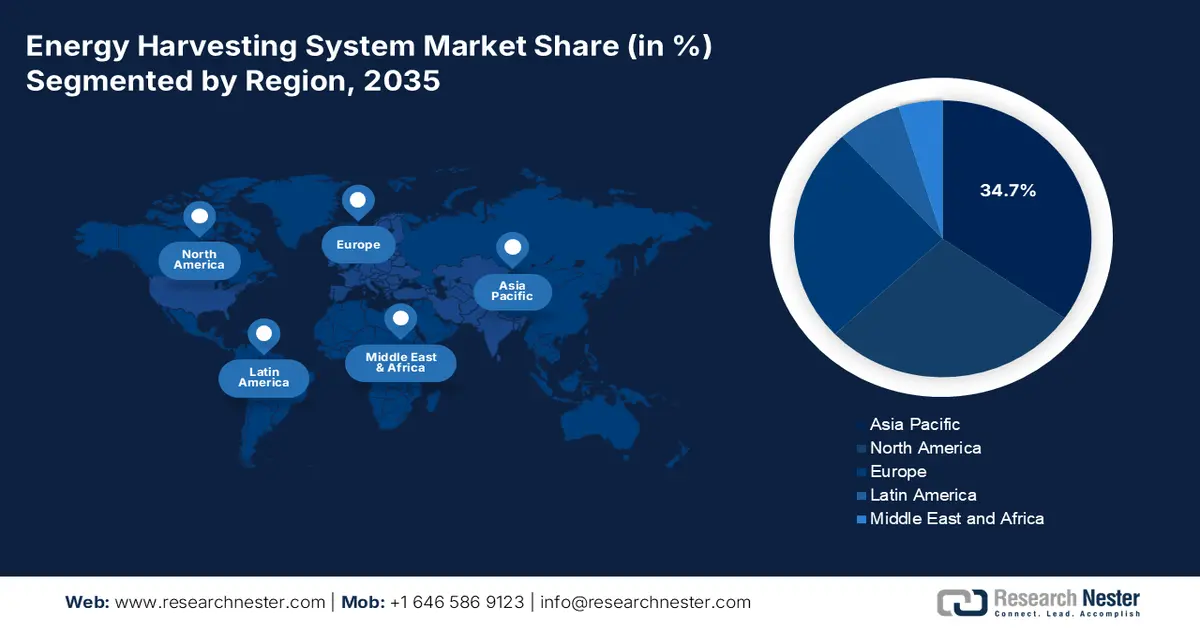
- Asia Pacific is projected to command a 34.7% share by 2035 in the energy harvesting system market, bolstered by rapid urbanization, expanding industrial IoT adoption, and widespread clean-energy deployment
- Europe is set to emerge as the fastest-growing region by 2035, accelerated by industrial decarbonization mandates, advances in low-power electronics, and large-scale renewable energy expansion
Segment Insights:
- The light energy harvesting segment is expected to secure a dominant 41.8% share by 2035 in the energy harvesting system market, supported by its capability to sustainably power autonomous electronics through efficient ambient light conversion
- The photovoltaic (PV) sub-segment is forecast to capture the second-largest share by 2035, underpinned by its effectiveness in delivering maintenance-free energy to low-power devices across industrial and building applications
Key Growth Trends:
- Increase in industry automation
- Rise in consumer electronics demand
Major Challenges:
- Increase initial expenses and integration complexity
- Restricted energy output and reliability
Key Players: Analog Devices, Inc. (U.S.), STMicroelectronics N.V. (Switzerland), Cypress Semiconductor Corporation (U.S.), ABB Ltd. (Switzerland), Siemens AG (Germany), Schneider Electric SE (France), EnOcean GmbH (Germany), Microchip Technology Inc. (U.S.), Fujitsu Limited (Japan), TDK Corporation (Japan), Murata Manufacturing Co., Ltd. (Japan), Samsung Electronics Co., Ltd. (South Korea), LG Chem Ltd. (South Korea), Panasonic Holdings Corporation (Japan), Hitachi, Ltd. (Japan), Tata Chemicals Limited (India), Reliance Industries Limited (India), Petronas Chemicals Group Berhad (Malaysia), CSIRO (Australia).
Global Energy Harvesting System Market Forecast and Regional Outlook:
Market Size & Growth Projections:
- 2025 Market Size: USD 852.2 million
- 2026 Market Size: USD 939.8 million
- Projected Market Size: USD 2.05 billion by 2035
- Growth Forecasts: 10.3% CAGR (2026-2035)
Key Regional Dynamics:
- Largest Region: Asia Pacific (34.7% share by 2035)
- Fastest Growing Region: Europe
- Dominating Countries: United States, China, Germany, Japan, South Korea
- Emerging Countries: India, Vietnam, Indonesia, Brazil, Mexico
Last updated on : 16 December, 2025
Energy Harvesting System Market - Growth Drivers and Challenges
Growth Drivers
- Increase in industry automation: The rising demand for maintenance-free sensors in manufacturing, automotive, and chemical sectors is gradually driving the energy harvesting system market. According to an article published by the IFR Organization in September 2024, there are 4,281,585 units of robotics currently operating across different factories globally, thereby denoting a surge by 10%. In addition, yearly installations have exceeded by half a million units for this year consecutively. Moreover, regionally, 70% of all newly deployed robotics have been installed in Asia, 17% in Europe, and 10% in America as of 2023. Besides, China is considered the largest energy harvesting system market, with 276,288 industrial robots installed as of 2023, which represents 51% of international installations, thus bolstering the market’s exposure.
Global Operational Robot Installations (2013-2023)
|
Year |
Units |
|
2013 |
1,332 |
|
2014 |
1,472 |
|
2015 |
1,632 |
|
2016 |
1,838 |
|
2017 |
2,125 |
|
2018 |
2,441 |
|
2019 |
2,737 |
|
2020 |
3,027 |
|
2021 |
3,479 |
|
2022 |
3,904 |
|
2023 |
4,282 |
Source: IFR Organization
- Rise in consumer electronics demand: The availability of wireless devices, wearables, and smartphones heavily relies on harvesting, which readily increases the exposure of the energy harvesting system market internationally. As per an article published by the Invest India Organization in December 2025, the consumer appliances and electronics industry in India is expected to reach USD 300 billion by the end of 2025. In addition, there has been a 2 to 3 times growth across wearables and hearables, consumer durables, and mobile phones internationally, along with USD 29.1 billion in electronic goods export. Moreover, household electronics consumption is predicted to reach USD 270 billion by the end of 2030, thereby denoting a huge demand for the energy harvesting system market.
- Focus on semiconductor innovation: The aspect of improved supercapacitors, GaAs wafers, and PMICs demands enhanced efficiency, which is yet another driver for the energy harvesting system market globally. As stated in an article published by the Semiconductors Organization in 2025, the chips powering modernized smartphones comprise over 15 billion transistors, which are each so small that a virus and are capable of switching on and off billions of times per second. Besides, the international chip manufacturing capacity of America accounts for only 10% as of 2022, thus denoting increased opportunity in the upcoming future. Meanwhile, the semiconductor sector in the U.S. continues to remain the international leader, commanding more than 50% of worldwide chip revenues, thus suitable for the market’s development.
Challenges
- Increase initial expenses and integration complexity: Technologies in the energy harvesting system market frequently demand specialized materials and innovative semiconductor components, which drive up costs compared to conventional battery-powered solutions. Integrating these systems into existing industrial and chemical infrastructures is complex, requiring redesign of sensors, controllers, and communication modules. For chemical plants, where safety and reliability are paramount, retrofitting energy harvesting devices into hazardous environments demands rigorous testing and certification, further increasing costs. Additionally, economies of scale are not yet fully realized, meaning unit costs remain high for niche applications. This creates hesitation among manufacturers and end-users, especially in cost-sensitive markets such as consumer electronics and developing economies.
- Restricted energy output and reliability: The energy harvesting system market is readily constrained by the intermittent and variable nature of ambient energy sources such as light, vibration, and RF signals. For instance, photovoltaic harvesting is ineffective in low-light or indoor environments, while vibration-based systems depend on consistent mechanical activity. In chemical plants, where monitoring devices must operate continuously and reliably, these limitations pose risks to safety and compliance. The small amounts of energy harvested often restrict applications to ultra-low-power devices, limiting scalability to more demanding industrial systems. Storage technologies like supercapacitors and micro-batteries help buffer energy, but they add cost and complexity. Reliability issues also arise from environmental factors, including dust, temperature extremes, and chemical exposure can degrade harvesting materials and reduce efficiency.
Energy Harvesting System Market Size and Forecast:
| Report Attribute | Details |
|---|---|
|
Base Year |
2025 |
|
Forecast Year |
2026-2035 |
|
CAGR |
10.3% |
|
Base Year Market Size (2025) |
USD 852.2 million |
|
Forecast Year Market Size (2035) |
USD 2.05 billion |
|
Regional Scope |
|
Energy Harvesting System Market Segmentation:
Energy Source Type Segment Analysis
The light energy harvesting segment, which is part of the energy source type, is anticipated to garner the largest share of 41.8% in the energy harvesting system market by the end of 2035. The segment’s upliftment is highly attributed to its importance for powering long-lasting and autonomous electronics, such as wearables, sensors, and IoT devices, removing operational expenses, diminishing reliance on batteries, lowering maintenance across remote locations, and providing an environmentally friendly and sustainable power source by effectively converting ambient light into electricity. According to an article published by NLM in February 2024, the international electricity consumption is estimated to be 26,779 TWh as of 2022, with a projected surge of almost 9.3% by the end of 2025. Besides, the Earth’s temperature has increased by nearly 1.4 degrees Celsius, thereby creating an optimistic outlook for the overall segment’s demand.
Technology Segment Analysis
By the end of 2035, the photovoltaic (PV) sub-segment, which is part of the technology segment, is expected to account for the second-largest share in the energy harvesting system market. The sub-segment’s growth is driven by its ability to convert ambient light into usable electrical energy for powering low‑power devices. PV harvesting is particularly effective in industrial automation, building management, and consumer electronics, where sensors and IoT devices require continuous, maintenance‑free energy. The chemical industry benefits significantly from PV harvesting, as monitoring equipment in hazardous environments can operate autonomously without battery replacement, reducing downtime and improving safety. Advances in thin‑film solar cells and gallium arsenide wafers have improved efficiency, enabling PV modules to function even under low‑light indoor conditions.
Component Segment Analysis
Based on the component, the power management integrated circuits (PMIC) segment in the energy harvesting system market is projected to cater to the third-largest share in the energy harvesting system market during the forecast period. The segment’s development is highly propelled by ensuring that small, intermittent energy inputs from sources such as PV, thermoelectric, or RF harvesting are stabilized and delivered reliably to devices. Their importance is magnified in chemical industry applications, where continuous monitoring of temperature, pressure, and emissions requires a dependable power supply in hazardous environments. Advances in semiconductor design have enabled ultra‑low‑power PMICs with higher conversion efficiency, supporting miniaturization and integration into IoT devices.
Our in-depth analysis of the energy harvesting system market includes the following segments:
|
Segment |
Subsegments |
|
Energy Source Type |
|
|
Technology |
|
|
Component |
|
|
Application |
|
|
Sensor Type |
|
|
End use Industry |
|

Vishnu Nair
Head - Global Business DevelopmentCustomize this report to your requirements — connect with our consultant for personalized insights and options.
Energy Harvesting System Market - Regional Analysis
APAC Market Insights
The Asia Pacific energy harvesting system market is anticipated to garner the highest share of 34.7% by the end of 2035. The market’s upliftment in the region is highly driven by an increase in urbanization, industrial IoT scale, and pervasive clean-energy deployment. In addition, Southeast Asia’s manufacturing expansion, India’s fast-growing economy, and China’s clean energy buildout have created abundant ambient energy for self-powered sensors in smart infrastructure, factories, and chemicals. According to an article published by the IEA Organization in 2025, there has been an increase in energy demand by more than 35%, with an upsurge in electricity by over 60%. This is readily driven by a 12% increase in the electricity accessibility rate, a rise in income and urbanization, growing consumption sector for creating the need for cooling and other appliances.
China in the energy harvesting system market is growing significantly, owing to large-scale industrial IoT deployment, in-depth electronics manufacturing ecosystems, and unmatched clean energy capacity additions. As per the 2025 IEA Organization article, the country accounted for 40% of international renewable capacity expansion, which is fueled by optimized system integration, low curtailment rates, and enhanced competitiveness of both onshore wind and solar PV. Besides, the electricity consumption per capita in the country caters to more than 557% as of 2023, along with 43% energy intensity of the economy, and 24.2% share of power generation through renewables as of 2022. Moreover, 18% of the overall energy supply is derived from oil, 8% from natural gas, and 61% from coal, thus positively contributing to the energy harvesting system market’s upliftment and growth.
India in the energy harvesting system market is also due to increased digitalization of chemicals and manufacturing, clean energy investment, and rapid industrial growth. According to an article published by Invest India Government in December 2025, the energy landscape in the country has successfully undergone a huge transition with the nation significantly gaining an unprecedented 50% of its overall installed electricity capacity from non-fossil fuel resources as of July 2025. In addition, the country has ensured transformational upgradation in diversifying its energy mix by diminishing dependency on traditional fossil fuels, while maintaining its increased target of 500 GW of non-fossil fuel-driven energy by the end of 2030. Therefore, with such an objective, there is a huge growth opportunity for the market in the country.
Europe Market Insights
Europe in the energy harvesting system market is projected to emerge as the fastest-growing region by the end of the forecast period. The market’s development in the region is highly fueled by industrial decarbonization for mandating pervasive sensing across infrastructure and factories, maturation of low-power electronics, and accelerated deployment of renewables. As per an article published by Ember Energy Organization in June 2022, the region constitutes the objective of achieving 70% to 80% of solar and wind power by the end of 2035, along with less than 1% coal power by 2030, and gas power by 5% by 2035. Besides, upgrading the solar and wind scale, along with quadrupling growth, requires an upfront funding, ranging between €300 to € 750 billion. Moreover, the power generation by technology can reduce unabated gas, thus denoting a huge growth opportunity for the energy harvesting system market.
Yearly Power Generation by Technology in Europe (2020-2050)
|
Energy Sources |
2025 |
2030 |
2035 |
2040 |
2045 |
2050 |
|
Stated Policy (TWh) |
|
|
|
|
|
|
|
Onshore Wind |
487.5 |
746.8 |
941.5 |
1,540.6 |
2,030.7 |
2,359.6 |
|
Offshore Wind |
148.3 |
429.5 |
579.2 |
939.3 |
1,191.0 |
1,220.4 |
|
Solar |
234.2 |
469.2 |
553.9 |
1,124.1 |
1,414.8 |
1,614.9 |
|
Nuclear |
722.4 |
703.4 |
637.0 |
403.0 |
539.8 |
321.6 |
|
Hydro |
538.3 |
539.9 |
539.9 |
539.7 |
529.8 |
539.8 |
|
Baseload Gas |
802.0 |
546.3 |
507.4 |
132.4 |
14.1 |
- |
|
Gas Peaker |
43.3 |
14.2 |
39.3 |
19.6 |
14.1 |
- |
|
Gas CCS |
- |
- |
- |
344.6 |
232.0 |
354.6 |
|
Coal |
802.0 |
42.7 |
28.7 |
- |
- |
- |
|
Hydrogen |
- |
- |
- |
- |
18.5 |
63.1 |
|
Oil |
0.7 |
0.3 |
0.7 |
0.8 |
0.6 |
- |
|
Other RES |
169.9 |
175.3 |
173.3 |
158.1 |
158.2 |
160.1 |
|
Technology Driven (TWh) |
|
|
|
|
|
|
|
Onshore Wind |
552.0 |
1,097.5 |
1,638.2 |
2,112.9 |
2,499.0 |
2,836.7 |
|
Offshore Wind |
175.6 |
536.2 |
856.5 |
1,081.3 |
1,221.9 |
1,386.2 |
|
Solar |
276.2 |
698.8 |
932.7 |
1,067.9 |
1,202.8 |
1,156.0 |
|
Nuclear |
716.6 |
614.6 |
425.9 |
198.4 |
132.5 |
120.6 |
|
Hydro |
537.7 |
539.1 |
539.2 |
539.1 |
539.1 |
539.2 |
|
Baseload Gas |
954.7 |
473.8 |
242.2 |
128.7 |
96.4 |
- |
|
Gas Peaker |
52.9 |
32.9 |
40.8 |
55.6 |
34.6 |
- |
|
Gas CCS |
- |
16.1 |
189.2 |
279.6 |
225.2 |
320.4 |
|
Coal |
94.7 |
17.3 |
10.5 |
4.0 |
- |
- |
|
Hydrogen |
- |
- |
- |
15.5 |
26.0 |
98.7 |
|
Oil |
0.5 |
0.8 |
1.4 |
1.9 |
1.0 |
- |
|
Other RES |
176.6 |
174.4 |
171.0 |
162.1 |
161.0 |
159.9 |
|
System Change (TWh) |
|
|
|
|
|
|
|
Onshore Wind |
564.9 |
1,179.8 |
1,761.7 |
2,211.6 |
2,170.5 |
2,207.5 |
|
Offshore Wind |
182.3 |
557.3 |
903.9 |
1,194.6 |
1,159.5 |
1,111.2 |
|
Solar |
324.3 |
1,080.2 |
1,615.6 |
1,624.2 |
1,604.0 |
1,484.1 |
|
Nuclear |
584.2 |
319.4 |
150.6 |
79.5 |
53.5 |
50.3 |
|
Hydro |
537.7 |
539.0 |
539.1 |
518.9 |
516.4 |
519.2 |
|
Baseload Gas |
1,081.7 |
439.4 |
36.6 |
- |
- |
- |
|
Gas Peaker |
83.9 |
44.7 |
151.4 |
- |
- |
- |
|
Gas CCS |
- |
- |
- |
- |
- |
- |
|
Coal |
86.1 |
- |
- |
- |
- |
- |
|
Hydrogen |
- |
16.8 |
114.9 |
156.9 |
132.4 |
111.4 |
|
Oil |
0.5 |
1.0 |
5.7 |
- |
- |
- |
|
Other RES |
181.3 |
171.8 |
173.8 |
156.8 |
154.7 |
154.9 |
Source: Ember Energy Organization
Germany in the energy harvesting system market is gaining increased traction due to the sustained energy transition, strict efficiency requirements, and its massive industrial base. In addition, the country’s power mix evolution, along with industrial modernization resulted in the demand for self-powered sensing in chemical processes, including safety systems, leak detection, and condition monitoring for diminishing battery-less and wiring operation. As stated in an article published by the ITA in August 2025, the country accounts for 80% of its electricity supply target to derive from renewables by the end of 2030, and has successfully gained 59% as of 2024. Furthermore, it has plans to lower greenhouse gas emissions by 65% by 2030, with the intention of achieving the carbon neutrality goal by the end of 2045, thereby making it suitable for boosting the market’s growth.
The UK in the energy harvesting system market is also growing, owing to the strong deployment of smart infrastructure, grid digitalization, and rapid scaling of renewables. Additionally, the country’s low-carbon power is projected to overtake fossil fuels, with wind gradually approaching the highest single source by developing thermal gradients, vibration, and abundant light. Besides, as stated in the September 2025 UK Government data report, the country’s electricity generation share, deriving from renewable sources, reached the latest record level of 54.5% of the overall generation. In addition, there has been a 10% increase in offshore wind generation to 10.8 TWh, along with a 27% surge in solar output, accounting for 7.1 TWh. Moreover, solar generation constitutes a record of 11.0% of the overall regional generation, with both increasing capacity contribution and recording sun hours, thereby uplifting the energy harvesting system market’s exposure.
North America Market Insights
North America is expected to witness considerable growth in the energy harvesting system market during the stipulated timeline. The market’s growth in the region is significantly driven by a record deployment of renewables, upscaling of clean manufacturing, and sustained industrial efficiency programs. All these create pervasive ambient energy sources for self-driven sensors across logistics networks, buildings, and factories. According to an article published by the U.S. Department of Energy (DOE) in September 2022, the administrative body unveiled the 2022 Better Plants Progress Updates, effectively highlighting the leadership of over 270 water utilities and manufacturers. They have partnered with DOE to enhance water and energy efficiency and jointly saved USD 10.6 billion in energy expenses, over 130 million metric tons of carbon dioxide, and 2.2 quadrillion British thermal units of energy.
The energy harvesting system market in the U.S. is gaining increased exposure, owing to the presence of industrial efficiency programs, an expansion in clean energy manufacturing, the existence of the EPA Green Chemistry program, and NIST's innovative manufacturing strategies. As per a report published by the Climate Group Organization in 2022, the Infrastructure Investment and Jobs Act (IIJA) has significantly authorized USD 1.2 trillion as well as USD 550 billion, both of which cover power and energy infrastructure, climate, water, and transportation resilience. Besides, the Inflation Reduction Act (IRA) leads to spending USD 369 billion for climate change-based grants and programs. In addition, this particular bill has placed the country on a suitable path to an estimated 40% in emissions reduction by the end of 2030, thereby making it suitable for the market’s growth.
The energy harvesting system market in Canada is also growing due to ensuring clean energy transition investments, the presence of industrial decarbonization programs, the Internet of Things (IoT) and smart city deployment, as well as compliance and environmental safety. As stated in an article published by the Government of Canada in November 2025, the Net Zero Accelerator (NZA) is considered an initiative, based on which regional companies cater to contribute to international efforts by effectively meeting the ambitious target of diminishing greenhouse gas emissions by 40% to 45% by the end of 2030 and gain net zero by the end of 2050. Besides, the NZA readily supports the government’s expanded climate plan, which is A Healthy Environment and a Healthy Economy to deliver a robust economy that can thrive in a low-carbon world to the population's advantage. Moreover, with almost USD 8 billion in grants for supporting large-scale investments in notable industrial sectors across the country, the market is growing.
Key Energy Harvesting System Market Players:
- Texas Instruments Incorporated (U.S.)
- Company Overview
- Business Strategy
- Key Product Offerings
- Financial Performance
- Key Performance Indicators
- Risk Analysis
- Recent Development
- Regional Presence
- SWOT Analysis
- Analog Devices, Inc. (U.S.)
- STMicroelectronics N.V. (Switzerland)
- Cypress Semiconductor Corporation (U.S.)
- ABB Ltd. (Switzerland)
- Siemens AG (Germany)
- Schneider Electric SE (France)
- EnOcean GmbH (Germany)
- Microchip Technology Inc. (U.S.)
- Fujitsu Limited (Japan)
- TDK Corporation (Japan)
- Murata Manufacturing Co., Ltd. (Japan)
- Samsung Electronics Co., Ltd. (South Korea)
- LG Chem Ltd. (South Korea)
- Panasonic Holdings Corporation (Japan)
- Hitachi, Ltd. (Japan)
- Tata Chemicals Limited (India)
- Reliance Industries Limited (India)
- Petronas Chemicals Group Berhad (Malaysia)
- CSIRO (Australia)
- Texas Instruments Incorporated is one of the leaders in low‑power electronics and power management ICs, which are critical for energy harvesting applications. Its innovations in ultra‑low‑power semiconductors enable self‑powered sensors and devices widely used in industrial and chemical monitoring systems.
- Analog Devices, Inc. readily specializes in signal processing and sensing technologies, providing advanced solutions for vibration, thermal, and RF energy harvesting. Their components are integral to chemical industry applications where precise monitoring and autonomous operation are essential.
- STMicroelectronics N.V. usually develops microcontrollers, sensors, and PMICs that support energy harvesting integration in industrial IoT and chemical process automation. The company’s focus on sustainable electronics aligns with Europe’s push for green chemical technologies and circular economy initiatives.
- Cypress Semiconductor Corporation is well-known for its wireless and energy‑efficient solutions, including energy harvesting modules for IoT devices. Its technology supports chemical industry applications by reducing reliance on batteries and enabling continuous monitoring.
- ABB Ltd. is an international leader in industrial automation and electrification, integrating energy harvesting systems into smart factories and chemical plants. Their solutions enhance operational efficiency, safety, and sustainability by deploying autonomous sensors and monitoring devices across complex industrial environments.
Here is a list of key players operating in the global energy harvesting system market:
The international energy harvesting system market is extremely competitive, with notable players from Australia, Malaysia, India, South Korea, Japan, the U.S., and Europe fueling advancement. Besides, organizations are readily focusing on tactical partnerships, government-driven sustainability programs, and research and development investment to expand their positions in the market. Moreover, Europe-based firms have readily leveraged the Green Deal to extend sustainable chemical processes, while South Korea and Japan-specific companies have heavily made investments in innovative materials, such as GaAs wafers. Furthermore, in September 2024, Honda Motor Co., declared that the property of its very own Saitama Factory Automobile Plant has been significantly certified as an OECM biodiversity by the Japan-based Ministry of the Environment (MOE). This certification caters to the organization striving to understand carbon neutrality, along with clean energy resource circulation by installing storage battery facilities and solar power generation, thus suitable for the energy harvesting system market’s growth.
Corporate Landscape of the Energy Harvesting System Market:
Recent Developments
- In April 2025, Asahi Kasei Microdevices has successfully created the AP4413, which is the latest series of ultra-low current power management ICs (PMICs), further ideal for battery charging systems that are utilized in energy harvesting applications.
- In September 2023, Sony Semiconductor Solutions Corporation notified that it has effectively created an energy harvesting module that utilizes electromagnetic wave noise energy, which is cultivated under the tuner development process to generate increased power from electromagnetic wave noise.
- Report ID: 8322
- Published Date: Dec 16, 2025
- Report Format: PDF, PPT
- Explore a preview of key market trends and insights
- Review sample data tables and segment breakdowns
- Experience the quality of our visual data representations
- Evaluate our report structure and research methodology
- Get a glimpse of competitive landscape analysis
- Understand how regional forecasts are presented
- Assess the depth of company profiling and benchmarking
- Preview how actionable insights can support your strategy
Explore real data and analysis
Frequently Asked Questions (FAQ)
Energy Harvesting System Market Report Scope
Free Sample includes current and historical market size, growth trends, regional charts & tables, company profiles, segment-wise forecasts, and more.
Connect with our Expert


Copyright @ 2026 Research Nester. All Rights Reserved.
