Display Component Market Outlook:
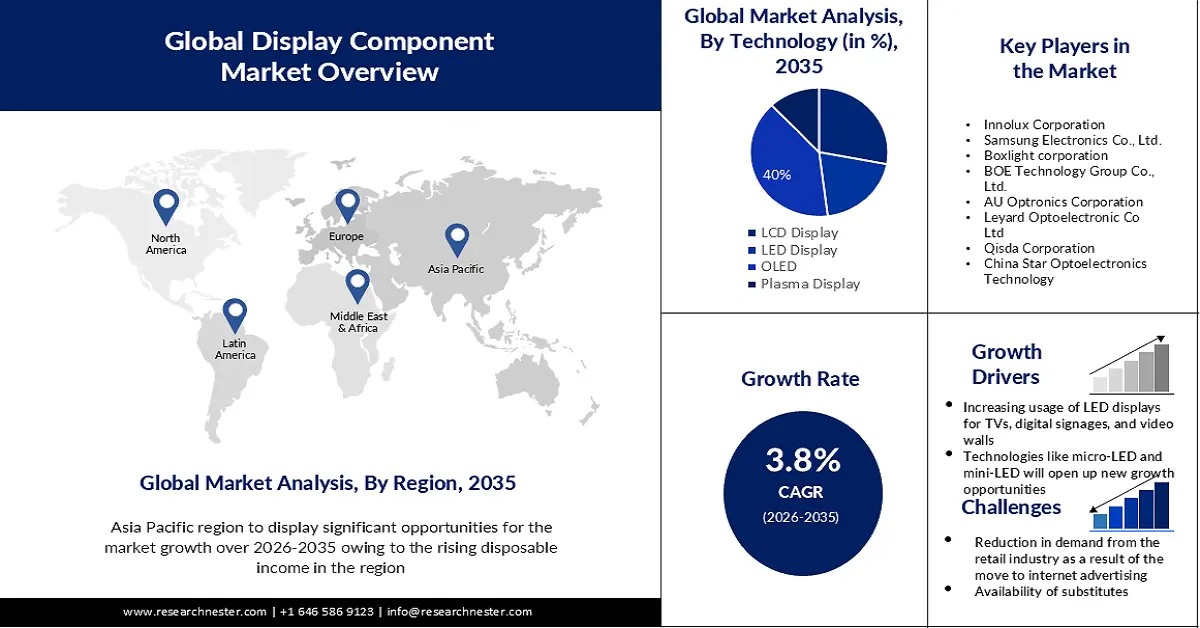
Display Component Market size was over USD 341.82 billion in 2025 and is poised to exceed USD 496.33 billion by 2035, witnessing over 3.8% CAGR during the forecast period i.e., between 2026-2035. In the year 2026, the industry size of display component is evaluated at USD 353.51 billion.
The primary factor driving the market's expansion is the rising demand for smartphones around the globe. Approximately 1.39 billion smartphones were sold globally in 2022, according to smartphone vendors Furthermore, the necessity for sophisticated portable devices and the quick improvements in cellular network technology have contributed to the recent spike in smartphone ownership.
In addition, the recent trends in the width of these displays getting thinner, the rising popularity of flat-panel displays, and the increase in television unit sales globally, and these factors are all anticipated to fuel market expansion. In addition, throughout the projected period, the growing use of screens in various medical equipment is anticipated to bolster market expansion.
Key Display Component Market Insights Summary:
Regional Highlights:
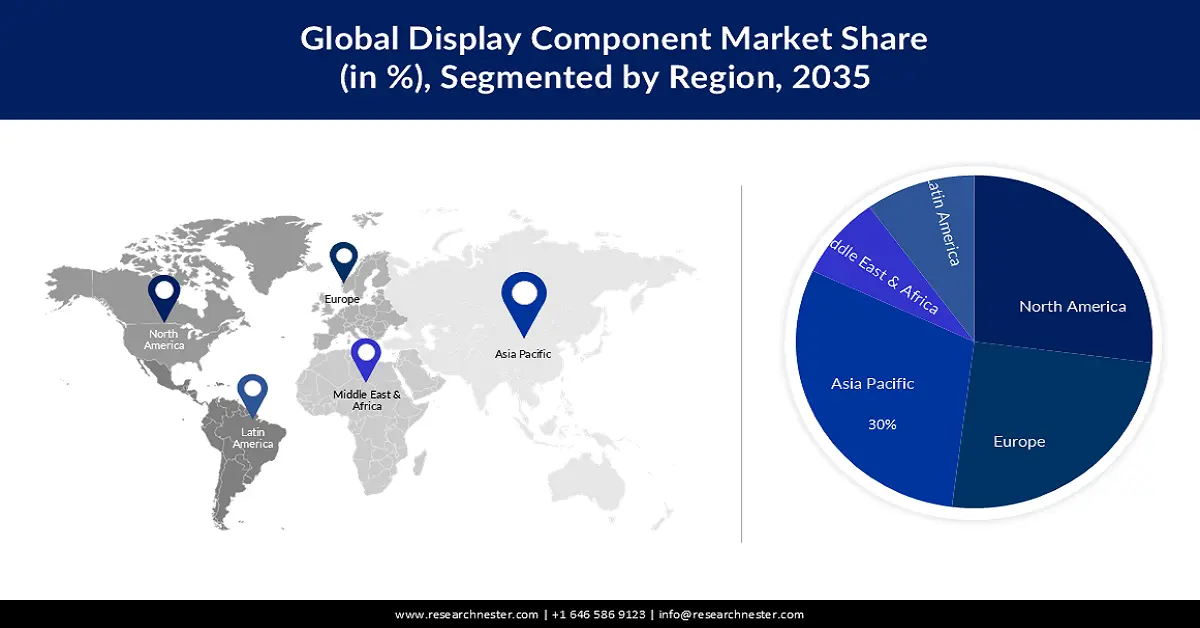
- Asia Pacific is estimated to account for the largest revenue share of 30% by 2035, owing to rising disposable incomes, presence of key manufacturers, and growing demand for smartphones, TVs, and wearables.
- North America is anticipated to hold the second-largest share of 27% during the forecast period, driven by increasing consumer adoption of advanced electronic devices and robust regional manufacturing capabilities.
Segment Insights:
- The OLED segment is projected to hold the largest revenue share of about 40% during the forecast period, propelled by extensive applications across industries, high demand for superior viewing experiences, and technological advancements.
- The smartphone application segment is expected to account for a 32% share by 2035, driven by rising adoption of OLED displays, demand for 4K/8K content, flexible panels, and investments in new display manufacturing facilities.
Key Growth Trends:
- Increasing Usage of LED Displays for TVs, Digital Signages, and Video Walls
- Technologies like Micro LED and Mini LED will Open up New Growth Opportunities for the Display Business
Major Challenges:
- Reduction in Demand from the Retail Industry as a Result of the Move to Internet Advertising
- Availability of substitutes is anticipated to impede the growth of the market.
Key Players: Innolux Corporation, Samsung Electronics Co., Ltd., Boxlight corporation, BOE Technology Group Co., Ltd., AU Optronics Corporation, Leyard Optoelectronic Co Ltd, Qisda Corporation, China Star Optoelectronics Technology.
Global Display Component Market Forecast and Regional Outlook:
Market Size & Growth Projections:
- 2025 Market Size: USD 341.82 billion
- 2026 Market Size: USD 353.51 billion
- Projected Market Size: USD 496.33 billion by 2035
- Growth Forecasts: 3.8%
Key Regional Dynamics:
- Largest Region: Asia Pacific (30% Share by 2035)
- Fastest Growing Region: North America
- Dominating Countries: China, Japan, South Korea, United States, Germany
- Emerging Countries: India, Vietnam, Taiwan, Brazil, Mexico
Last updated on : 19 November, 2025
Display Component Market - Growth Drivers and Challenges
Growth Drivers
-
Increasing Usage of LED Displays for TVs, Digital Signages, and Video Walls- Many devices, including TVs, digital signages, video walls, and cell phones, automotive smart display, use this technology. 65% of end users intend to spend more on digital signage and will spend more on buying new displays, and 42% will spend more on creating content. Compared to other display technologies, LED displays have grown to be one of the most popular and occupy a sizable market share in a variety of applications. Improvements in resolution, brightness, product variety, and the development of long-lasting surface LEDs and micro-LEDs are just a few examples of the technological developments that have fuelled the market's expansion.
-
Technologies like Micro-LED and Mini-LED will Open up New Growth Opportunities for the Display Business- Micro-LED displays, have various advantages over traditional display technologies, including better colour accuracy, increased contrast, and quicker response times. Micro-LED displays are also more power-efficient and suitable for a wide range of devices, such as laptops, smartphones, AR/VR headsets, and huge digital signage. Because of these benefits, micro-LED screens are a promising technology that could completely change the display component market.
- Expanding Usage of Flexible and Foldable Panels- Because flexible substrates are employed in their fabrication, flexible panel displays can be bent. These flexible substrates can be made of lightweight, thin, and long-lasting plastic or flexible glass. Furthermore, they are bent or curved by manufacturers and used in final devices like laptops, PCs, and cell phones. OLED display panels serve as the foundation for flexible display technology, which powers foldable phones. Over the past few years, foldable panels for displays have gained popularity in notebooks, tablets, and smartphones. High-end smartphones are increasingly being equipped with these foldable panels. Demand for high-end cell phones is rising as a result of consumers' greater disposable income.
Challenges
-
Reduction in Demand from the Retail Industry as a Result of the Move to Internet Advertising- These days, digital ads are getting more advanced, tailored, and pertinent. Customers are spending more time online than ever before due to the rise in internet usage, and digital advertising provides a perfect means of connecting with multi-channel customers. As a result, the retail industry's need for displays is decreasing. The market for displays is also being hampered by consumers avoiding touchscreen display panels in public areas as a result of the coronavirus outbreak. During the projected time, these factors are impeding the expansion of the display market.
-
Availability of substitutes is anticipated to impede the growth of the market.
- The high cost of the latest display technologies may hinder the growth of the market.
Display Component Market Size and Forecast:
| Report Attribute | Details |
|---|---|
|
Base Year |
2025 |
|
Forecast Year |
2026-2035 |
|
CAGR |
3.8% |
|
Base Year Market Size (2025) |
USD 341.82 billion |
|
Forecast Year Market Size (2035) |
USD 496.33 billion |
|
Regional Scope |
|
Display Component Market Segmentation:
Technology Segment Analysis
The OLED segment in the display component market is attributed to hold largest revenue share of about 40% during the forecast period. The segment's expansion in the market is being driven by the OLED used in smartphones, a vast range of applications of OLED panels across industry verticals, the high demand for improved viewing experiences, and technological advancements. LED screens respond more quickly, use less electricity, have wider viewing angles, more contrast, and are brighter. Moreover, these screens are self-illuminating by nature and don't need a backlight to provide the best visibility possible in all lighting situations. The market for panels based on OLED technology is driven by these benefits. These elements and advancements will strengthen the OLED technology sector, expanding the size of the market in the process.
End-Products Segment Analysis
Display component market from the smartphones segment is projected to hold largest share of about 32% by the end of 2035. The smartphone application segment in the display industry is growing owing to the availability of UHD content, rising demand for 4K and 8K displays, the growing use of OLED screens in smartphones, rising demand for flexible display panels, and rising investments in the building of new OLED and LCD panel manufacturing facilities. For instance, OnePlus released the OnePlus 10 Pro smartphone, featuring an LTPO 2.0 AMOLED display, in January 2022. For energy savings, the low-temperature polycrystalline oxide display can lower the frequency to 1Hz.
Our in-depth analysis of the global market includes the following segments:
|
Technology |
|
|
Panel Size |
|
|
End-Products |
|

Vishnu Nair
Head - Global Business DevelopmentCustomize this report to your requirements — connect with our consultant for personalized insights and options.
Display Component Market - Regional Analysis
APAC Market Insights
Asia Pacific industry is estimated to account for largest revenue share of 30% by 2035. The main driver of the market's expansion in this area is the rising disposable income of the local populace. Moreover, the market is expanding due to the existence of significant manufacturers and their ongoing R&D efforts. The Asia-Pacific market is expanding due to rising demand for smartphones, televisions, and smart wearables. About 41% of Chinese respondents as of June 2023 said they personally use wearables.
North American Market Insights
Display component market in North America region is anticipated to hold second largest market share of 27% during the forecast period. North America dominates the market, and throughout the projection period, earnings are expected to grow at a robust rate. Consumers are choosing technologically advanced electronic devices due to their increasing disposable income, which is propelling market progress. The presence of core performance manufacturing in the area drives the target market.
Display Component Market Players:
- LG Display Co., Ltd.
- Company Overview
- Business Strategy
- Key Product Offerings
- Financial Performance
- Key Performance Indicators
- Risk Analysis
- Recent Development
- Regional Presence
- SWOT Analysis
- Innolux Corporation
- Samsung Electronics Co., Ltd.
- Boxlight corporation
- BOE Technology Group Co., Ltd.
- AU Optronics Corporation
- Leyard Optoelectronic Co Ltd
- Qisda Corporation
- China Star Optoelectronics Technology
- VIA Optronics AG
Recent Developments
- Boxlight Corporation which is a leading provider of digital signage, interactive technology, and software solutions announced the acquisition of Sahara Presentation Systems PLC which includes Sahara AV Solutions, Sedao, and Clevertouch. This acquisition will benefit Sahara AV’s, Clevertouch’s Sedao’s, and partners all over the world.
- Samsung Electronics Australia has announced its first Onyx Cinema LED screen in Australia, unveiling a 14-metre screen at HOYTS Entertainment Quarter in Moore Park, Sydney. Another 10-metre screen will be installed in March 2020 at HOYTS Highpoint in Melbourne. Onyx Cinema LED technology transcends the visual experience and performance reliability of the traditional projector-based solutions, which have been the industry standard for more than 120 years. Samsung’s Onyx brings the visual power of LED technology to the ‘big screen’, offering an unbelievable, immersive cinema experience.
- Report ID: 3426
- Published Date: Nov 19, 2025
- Report Format: PDF, PPT
- Explore a preview of key market trends and insights
- Review sample data tables and segment breakdowns
- Experience the quality of our visual data representations
- Evaluate our report structure and research methodology
- Get a glimpse of competitive landscape analysis
- Understand how regional forecasts are presented
- Assess the depth of company profiling and benchmarking
- Preview how actionable insights can support your strategy
Explore real data and analysis
Frequently Asked Questions (FAQ)
About this Report
Connect with our Expert

Report, 2026-2035


Copyright @ 2026 Research Nester. All Rights Reserved.
