Containerboard Market Outlook:
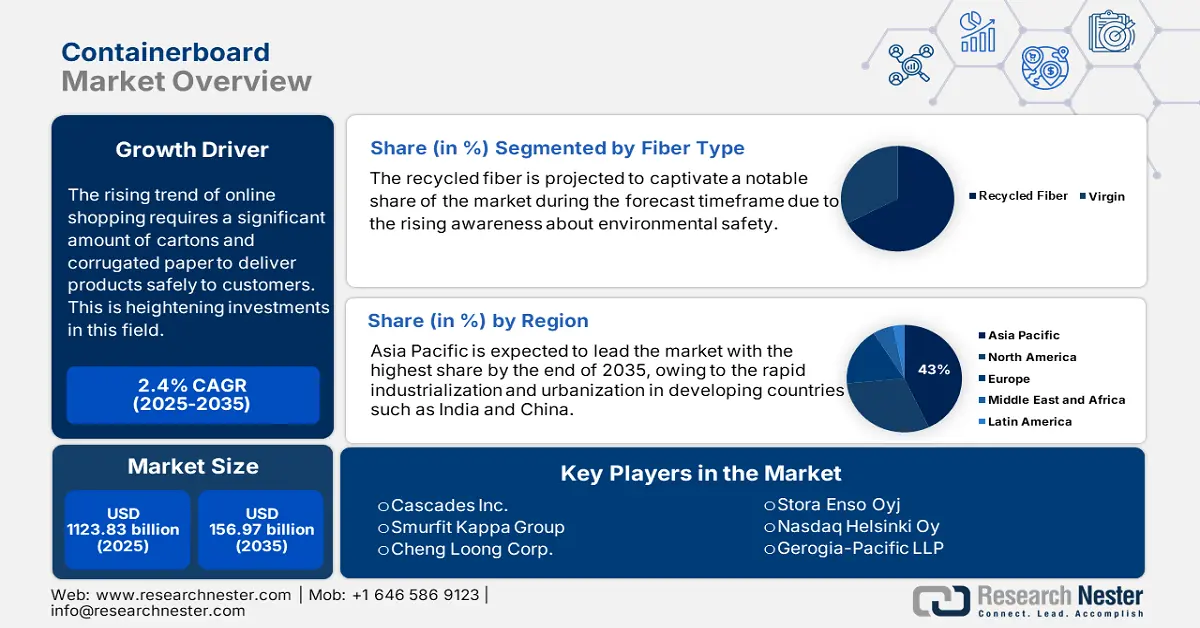
Containerboard Market size was valued at USD 123.83 Billion in 2025 and is expected to reach USD 156.97 Billion by 2035, registering around 2.4% CAGR during the forecast period i.e., between 2026-2035. In the year 2026, the industry size of containerboard is evaluated at USD 126.5 Billion.
The current sustainability measures in the packaging industry have led to a rise in paper recycling and pulp-based cardboard production. The future quantity and prices of waste resources and byproducts are anticipated to be influenced by population growth, resource competition amongst industries, supporting government regulations (e.g. zero-waste initiatives, organic waste ban), and technology development. Waste generation resources are somewhat fixed and often do not respond to shifts in demand for the material or market price. For a conventional commodity market, if the market spikes, supply is likely to swell in response.
As waste resources directly correlate with animal and human populations, their supply is unaffected in response to drivers such as containerboard market demand. While supply dynamics for waste resources are complex, alteration in the utilization of capacity affects their prices. Overall supply and prices of paper and cardboard waste resources in a mature-market scenario are presented in the following table.
Annual Paper and Cardboard Waste Resources in Near-Term and Mature-Market Scenarios in 2022
|
Waste Resources and Byproducts |
Near-Term Total Annual Average Resources |
Near-Term Available Annual Average Resources |
Mature-Market Low/Medium/High Total Annual Average Resources |
2022 Average Price in $/Wet Ton |
2022 Average Price in $/MMBtu |
|||||||
|
|
Million Wet Tons/yr (Million Dry Tons/yr) |
Energy Content (TBtu) |
Million Wet Tons/yr (Million Dry Tons/yr) |
Energy Content (TBtu) |
Million Wet Tons/yr (Million Dry Tons/yr) |
Energy Content (TBtu) |
Near Term |
Mature-Market Low/Medium |
Mature-Market High |
Near Term |
Mature-Market Low/Medium |
Mature-Market High |
|
Paper and cardboard |
121 (114) |
1,624 |
68 (64) |
910 |
142 (134) 1 |
1,903 |
$93 |
$93 |
$110 |
$7 |
$7 |
$8 |
Source: U.S. DOE
Paper and cardboard recycling rate have showcased a steep rise in the last few years. According to the American Forest & Paper Association, the U.S. paper recycling rate surpassed 65-69%, an equivalent of 46 million tons of paper (126,000 tons/day) and the cardboard recycling rate was estimated between 71-76%, which is roughly 33 million tons (90,000 tons/day) in 2023. It is noteworthy that 79% of U.S. citizens are part of community residential-curbside upcycle programs to manufacture containerboards. The AFPA mentioned that 50% of the overall recycled paper was used for containerboards, 15% went into making boxboards, 10% for tissues, 6% in miscellaneous products, and roughly 30% for global exports.
Key Containerboard Market Insights Summary:
Regional Highlights:
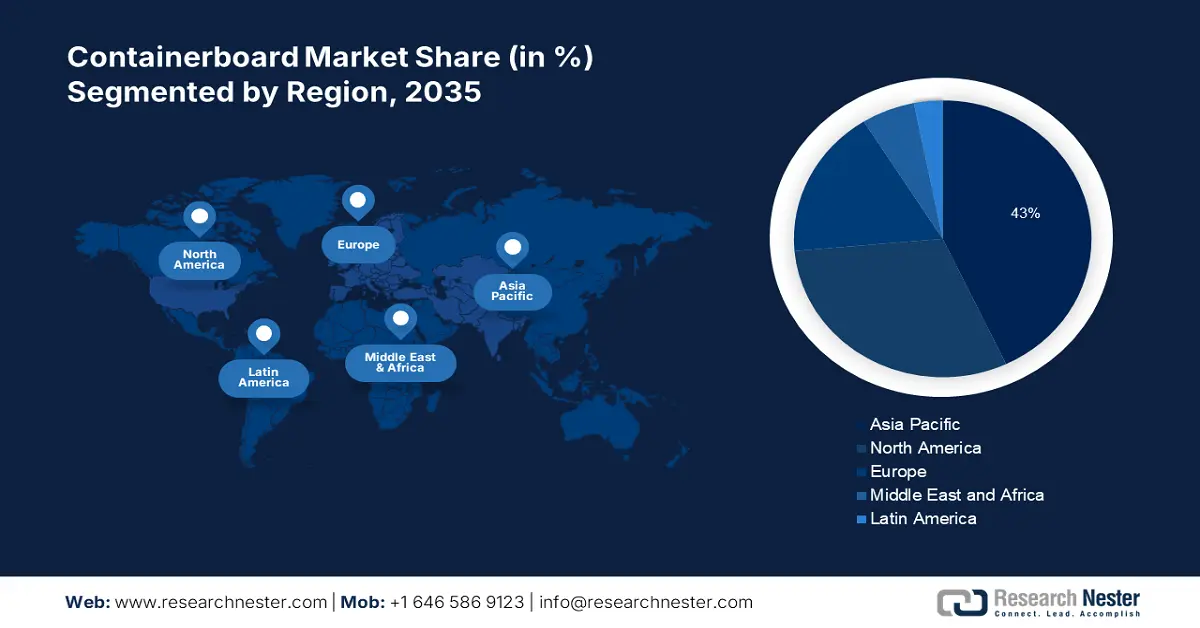
- Asia Pacific containerboard market is predicted to capture 43% share by 2035, driven by rising demand for packaged food and industrialization.
- North America market will account for significant revenue share by 2035, attributed to thriving e-commerce, logistics, and high capital investments.
Segment Insights:
- The food & beverage segment in the containerboard market is projected to secure a prominent revenue share by 2035, driven by regulatory pressure for sustainable packaging and PFAS bans.
- The recycled fiber segment in the containerboard market is forecasted to achieve noteworthy growth during 2026-2035, attributed to increasing climate awareness and high recycling rates globally.
Key Growth Trends:
- Exponential growth in global trade
- Massive boom in online shopping and end-to-end logistics
Major Challenges:
- Exponential growth in global trade
- Massive boom in online shopping and end-to-end logistics
Key Players: International Paper Company, Smurfit Kappa Group, Mondi Group, WestRock Company, Nine Dragons Paper (Holdings) Limited, DS Smith Plc, Lee & Man Paper Manufacturing Ltd., Stora Enso Oyj, Oji Holdings Corporation, Georgia-Pacific LLC.
Global Containerboard Market Forecast and Regional Outlook:
Market Size & Growth Projections:
- 2025 Market Size: USD 123.83 Billion
- 2026 Market Size: USD 126.5 Billion
- Projected Market Size: USD 156.97 Billion by 2035
- Growth Forecasts: 2.4% CAGR (2026-2035)
Key Regional Dynamics:
- Largest Region: Asia Pacific (43% Share by 2035)
- Fastest Growing Region: Asia Pacific
- Dominating Countries: China, United States, Japan, Germany, Sweden
- Emerging Countries: China, India, Japan, South Korea, Thailand
Last updated on : 10 September, 2025
Containerboard Market Growth Drivers and Challenges:
Growth Drivers
- Exponential growth in global trade: Cartons, corrugated paper or board, and cases amounted to a trade value of USD 11.4 billion in 2022 and China (USD 1.7 billion) was the biggest exporter and the U.S. (USD 966 million) was the top importer. It ranked as the 340th most procured product out of 4648 items, representing 0.048% of the worldwide trade.
Containerboard (including cartons & corrugated paper) Global Trade, 2022
|
Top Exporter |
Export Value |
Top Importer |
Import Value |
|
China |
$ 1.7 billion |
The U.S. |
$ 966 million |
|
Germany |
$ 1.45 billion |
Netherlands |
$ 925 million |
|
The U.S. |
$ 1.43 billion |
Germany |
$ 916 million |
|
Poland |
$ 667 million |
Mexico |
$ 812 million |
|
Italy |
$ 610 million |
France |
$ 716 million |
Source: OEC
The U.S. pulp and paper machinery export exhibited a flat trajectory of USD 166 million between October 2024 and November 2024. In terms of other connected markets, the corrugated paper was worth USD 2.51 billion in world trade and a CAGR of 2.62% in 2022. The U.S. (USD 582 million) was the top country denoting outbound trade and Mexico (USD 319 million) was the key importer. Corrugated paper’s highest import potential is Germany, with a gap of USD 3.49 million; export potential is China, underpinning a gap of USD 4.24 million. In 2022, paper containers were the 45th most traded item and valued at USD 32.8 million. The industry grew by 8.57% between 2021 and 2022, denoting 0.14% of the overall world trade.
- Massive boom in online shopping and end-to-end logistics: It was estimated that more than 2.5 billion individuals purchased necessary goods online in 2020. According to the International Trade Administration (ITA), the global B2B e-commerce has a 14.5% CAGR and is projected at USD 36,163 billion by the end of 2026. Heavy industry including advanced manufacturing, healthcare, energy, and business product and services segments contribute to the majority of this B2B sales. Asia Pacific held 79.7% of e-commerce GMV in 2025 and is projected to comprise 80.0% B2B market share by 2026.
November 2024 quarterly retail e-commerce sales report (all seasonally adjusted) by the Census Bureau of the Department of Commerce suggests that U.S. retail e-commerce sales for Q3 2024, was USD 300.1 billion, a 2.6% surge from Q2. Cumulative retail sales in Q3 stood at USD 1,849.9 billion, a 1.3% rise from the previous quarter. Also, the e-commerce upsurge in Q3 was 7.4% higher than Q3 2023, while retail sales grew by 2.1% in the same stipulated timeframe. Furthermore, the World Bank’s logistics performance index (LPI) showcases the performance of trade logistics that determine the containerboard market positioning.
Global LPI Ranking of Key Countries, 2023
|
Country |
LPI Score |
Customs Score |
Infrastructure Score |
International Shipment Score |
Logistics Competence Score |
Tracking & Tracking Score |
Timeliness Score |
|
China |
3.7 |
3.3 |
4 |
3.6 |
3.8 |
3.8 |
3.7 |
|
India |
3.4 |
3 |
3.2 |
3.5 |
3.5 |
3.4 |
3.6 |
|
The U.S. |
3.8 |
3.7 |
3.9 |
3.4 |
3.9 |
4.2 |
3.8 |
|
UK |
3.7 |
3.5 |
3.7 |
3.5 |
3.7 |
4 |
3.7 |
|
Japan |
3.9 |
3.9 |
4.2 |
3.3 |
4.1 |
4 |
4 |
Source: The World Bank
The logistics subsector has created numerous employment opportunities. As per the U.S. Bureau of Labor Statistics, the number of logisticians in 2023 was 237,100, and a CAGR of 19% between 2023 and 2033. The employment change in the same timeframe is estimated at 45,800. About 26,100 new job opportunities are expected by the end of 2033. As of May 2023, the logisticians' median yearly wages in top industries included federal government (USD 95,890), manufacturing (USD 82,410), companies and enterprises management (USD 81,890), scientific, professional, and technical services (USD 80,160), and wholesale trade (USD 72,200).
Containerboard Market Size and Forecast:
| Report Attribute | Details |
|---|---|
|
Base Year |
2025 |
|
Forecast Period |
2026-2035 |
|
CAGR |
2.4% |
|
Base Year Market Size (2025) |
USD 123.83 Billion |
|
Forecast Year Market Size (2035) |
USD 156.97 Billion |
|
Regional Scope |
|
Containerboard Market Segmentation:
Fiber Type Segment Analysis
The recycled fiber segment in containerboard market is projected to witness noteworthy growth over the forecast period. The growth of the segment can be attributed to the rising awareness of the global population toward climate change. As of 2020, the rate of cardboard recycling was estimated to be around 85%. The development of containerboard uses more than 50% of the recovered fiber that is used to make paper and paperboard, as stated by the American Forest and Paper Association. The EPA in 2022 discussed the volume of fiber recycled in the U.S. (42 million tons), comprising cardboard waste (29 million tons) and newspaper (3 million tons).
End use Segment Analysis
The food & beverage segment in containerboard market is poised to garner a prominent revenue share by 2035. This segment dynamics can be ascribed to stringent government reforms to ensure food packaging safety. In December 2022, the Department of Environmental Conservation issued a prohibition on intentionally adding Per- and polyfluoroalkyl substances (PFAS) in food and beverage packaging. This law is applicable on containers used for pizza, pastry, soup cups, sandwich wrappers, etc. The Senate Bill Plastic Pollution Prevention and Packaging Producer Responsibility Act was released in January 2025 and promotes the use of paper and fiber over other covered material category (CMC) lists such as glass and plastics. The efforts are in line with minimizing landfill waste and single-use plastic food service.
Our in-depth analysis of the global containerboard market includes the following segments:
|
Fiber Type |
|
|
Type |
|
|
End user |
|

Vishnu Nair
Head - Global Business DevelopmentCustomize this report to your requirements — connect with our consultant for personalized insights and options.
Containerboard Market Regional Analysis:
Asia Pacific containerboard market is predicted to account for largest revenue share of 43% by 2035, ascribed to the prominent trend of ready-to-make packaged food purchases. The region’s cumulative revenue generated by the ready-to-eat meals industry was roughly USD 300 billion in 2022. Furthermore, the Korea home meal replacement (HMR) market has showcased a 15.2% y-o-y growth, reaching USD 2.78 billion in 2020. In China, the pre-made dishes (PMDs) have gained traction, due to social factors, particularly the prevalence of a fast-paced lifestyle and shrinking household sizes. Moreover, a significant surge in industrialization is further estimated to hike the expansion of the market during the projected period. The China pre-made dishes (PMD) market, a key paper packaging end user reached USD 56.88 billion in 2022 and had 64,000 PMD companies in the country. NCBI’s sales forecasts underscore that the industry will grow at 20% annually by the end of 225 and is anticipated to value at 146.86 billion in 2026.
Containerboard market in India has a staggering potential as a result of shortage of shortage of softwood and wooden packing cases. Presently, more than 80% of industrial packaging is done using carbon boxes and paper, finds Office of Development Commissioner, Ministry of Micro, Small and Medium Enterprises (MSME). It also estimates that annually 8 million tonnes of containerboard boxes are generated, with a total market worth of USD 3.75 billion.
North America Market Insights
North America containerboard market is poised to garner a significant revenue share by the end of 2035 owing to the thriving e-commerce and logistics segments. This subsector comprises outbound and inbound transportation and fleet management, materials handling, warehousing, order fulfillment, logistics network design, supply and demand planning, and third-party logistics management. In the U.S. there were 50,04 logistics services industry establishments as of 2022. By mid-2024, 854,000 workers were employed in the industry, and foreign-owned businesses rendered 114,200 jobs in 2022. Recent express delivery services (EDS) industry growth was driven by an exponential expansion in electronic commerce. There were 17,033 businesses in the couriers and messenger subsector and by June 2024 1.1 million individuals were employed in EDS.
Containerboard market in the U.S. is fueled by the high capital investments by the domestic players and supportive government regulatory framework that supports paper and biomass recycling. A 2024 Recycling Partnership report suggests that households that participate in curbside programs capture and recycle 81% of cardboard and only 19% is trashed. Materials recovery facilities (MRFs) capture 90% of cardboard waste and 90% of mixed paper. On a yearly basis, about 7,509,483 tons of cardboard waste is generated and 2,371,572 tons is reprocessed, denoting a rate of 32%, and is highest in the overall material category that includes glass containers, steel, pet bottles, etc. In terms of investments, the country has demonstrated a high expenditure capability on boosting production capacity.
Alabama’s Industry Investments in 2023
|
Company |
New/Expanding |
City |
NAICS |
Business Activity |
Capital Investment |
|
BBLU Inc. |
Expanding |
Vinemont |
322211 |
Corrugated and Solid Fiber Box Manufacturing |
$3,000,000 |
|
Rusken Packaging |
Expanding |
Cullman |
322211 |
Corrugated and Solid Fiber Box Manufacturing |
$2,500,000 |
|
WestRock Packaging |
Expanding |
Cullman |
322211 |
Corrugated Packaging |
$700,000 |
Source: The Office of Alabama Governor
Containerboard Market Players:
- Cascades Inc.
- Company Overview
- Business Strategy
- Key Product Offerings
- Financial Performance
- Key Performance Indicators
- Risk Analysis
- Recent Development
- Regional Presence
- SWOT Analysis
- Smurfit Kappa Group
- Cheng Loong Corp.
- Svenska Cellulosa Aktiebolaget SCA
- Stora Enso Oyj
- Nasdaq Helsinki Oy
- Georgia-Pacific LLC
- Molex, LLC
- International Paper Company
- Mondi plc
The industry players are seeking to capitalize on the expanding e-commerce and packaging sectors. Companies are implementing strategic initiatives such as new product launches, collaborations, and geographical expansions, with a primary focus on decarbonizing goals. Some of the key players operating in the containerboard market include:
Recent Developments
- In September 2024, Solenis and Heidelberger Druckmaschinen AG collaborated to advance barrier coatings for paper packaging for industrial and shipping container applications. Also, it will cater to e-commerce and fresh food corrugated packaging eliminating the need for traditional paraffin wax and polyethylene (PE) lamination.
- In August 2024, Green Bay Packaging announced its plans to expand its operations in Arizona. The company’s new box factory will strengthen its position in the U.S. and the global supply chain.
- In March 2024, 3M launched the 3M Padded Automatable Curbside Recyclable (PACR) Mailer Material product line and aims to redefine the packaging and logistics subsectors. It aligns with the company’s sustainability efforts and meets stringent government performance requirements.
- Report ID: 4507
- Published Date: Sep 10, 2025
- Report Format: PDF, PPT
- Explore a preview of key market trends and insights
- Review sample data tables and segment breakdowns
- Experience the quality of our visual data representations
- Evaluate our report structure and research methodology
- Get a glimpse of competitive landscape analysis
- Understand how regional forecasts are presented
- Assess the depth of company profiling and benchmarking
- Preview how actionable insights can support your strategy
Explore real data and analysis
Frequently Asked Questions (FAQ)
Containerboard Market Report Scope
Free Sample includes current and historical market size, growth trends, regional charts & tables, company profiles, segment-wise forecasts, and more.
Connect with our Expert


Copyright @ 2026 Research Nester. All Rights Reserved.
