Commercial Aircraft Aftermarket Parts Market Outlook:
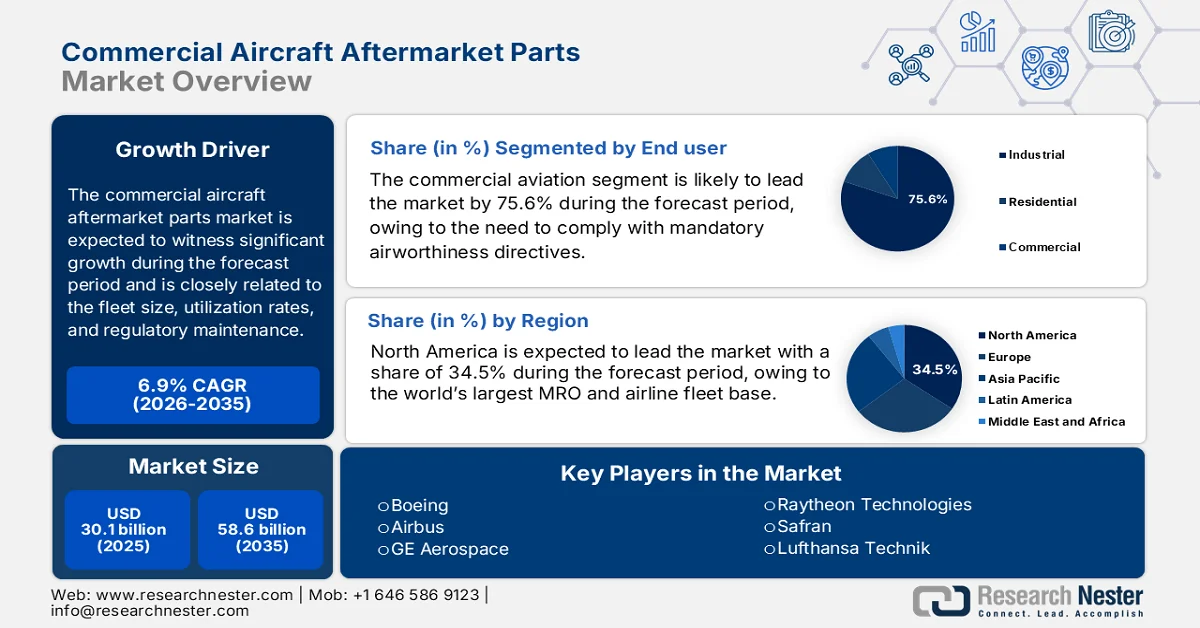
Commercial Aircraft Aftermarket Parts Market size was valued at USD 30.1 billion in 2025 and is projected to reach USD 58.6 billion by the end of 2035, rising at a CAGR of 6.9% during the forecast period, i.e., 2026-2035. In 2026, the industry size of commercial aircraft aftermarket parts is estimated at USD 32.1 billion.
The global commercial aircraft aftermarket parts market is closely related to fleet size, utilization rates, and the regulatory maintenance requirements set by civil aviation authorities. According to the Indian Aerospace & Defense Bulletin September 2025 report, the global commercial aircraft fleet exceeded 28,000 aircraft in service with sustained utilization driven by the post pandemic traffic recovery and long-haul capacity restoration. Besides, the Airport Council International data in September 2023 indicates that the global scheduled passenger traffic reached 9.4 billion in 2024, directly increasing the demand for replacement parts, rotable components, and consumables required to meet mandatory airworthiness and continuing maintenance standards. Additionally, regulatory oversight from authorities such as the FAA and EASA mandates strict compliance with airworthiness directives and life-limited part replacement schedules, ensuring narrowbody and widebody fleets.
Further, the aging aircraft supports the demand for the market. As per the IATA December 2024 report, the global fleet average age has risen to a record 14.8 years, an increase from the 13.6 years average for 1990 to 2024. This indicates that the component replacement frequency rises materially due to fatigue limits and inspection findings. Moreover, the industry-wide maintenance, repair, and overhaul activity, of which parts procurement is the largest cost element, remains a priority for airlines and lessors. The IATA 2024 data estimates that the MRO expenditure is high, representing USD 104 billion in 2024, reflecting both high material prices and supply chain normalization efforts. Overall, the combination of MRO spending and the aging fleet is driving the sustained growth in the market.
Global MRO Spend vs Total Expenses and Revenues (2019-2024)
|
|
2019 |
2020 |
2021 |
2022 |
2023 |
2024 |
|
Global MRO Spend (USD Billion) |
82 |
50 |
62 |
79 |
94 |
104 |
|
% of Global Expenses |
10% |
10% |
11% |
11% |
11.1% |
11.5% |
|
% of Global Revenues |
10% |
13% |
12% |
11% |
10.3% |
10.8% |
Source: IATA 2024