Automated Container Terminal Market Outlook:
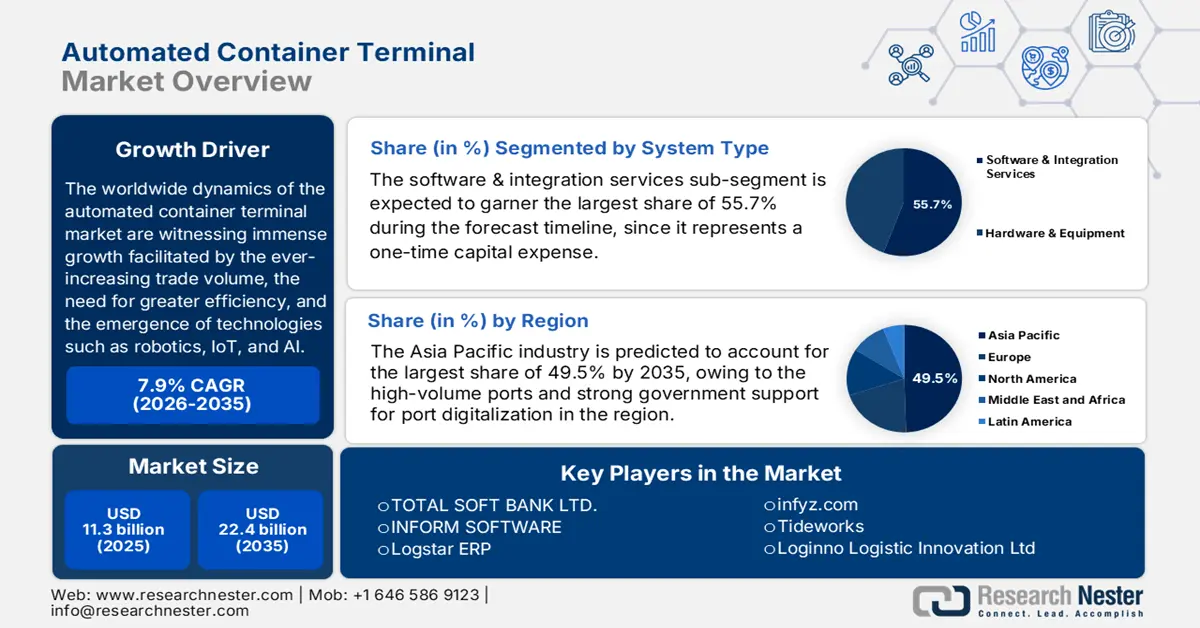
Automated Container Terminal Market size was valued at USD 11.3 billion in 2025 and is projected to reach USD 22.4 billion by the end of 2035, rising at a CAGR of 7.9% during the forecast period, i.e., 2026-2035. In 2026, the industry size of automated container terminal is estimated at USD 12.1 billion.
The worldwide dynamics of the automated container terminal market are witnessing immense growth facilitated by the ever-increasing trade volume, the need for greater efficiency, and the emergence of technologies such as robotics, IoT, and AI. These container terminals for a critical node in terms of the maritime supply chain, wherein the ingredients such as stacking cranes, remotely‑operated systems, and automated vehicles must be sourced, assembled, and maintained properly. The Bureau of Transportation Statistics in 2025 disclosed that the U.S. container port is dominated by the presence of a small number of major gateways, wherein the top 25 container ports handled 96% of all loaded twenty-foot equivalent units in 2022. In addition, the Port Authority of New York and New Jersey led this with 6.66 million TEUs, followed by the West Coast ports of Los Angeles with 6.42 million and Long Beach with 6.09 million.
The report also underscored that infrastructure critical for automation, whereas container cranes, is heavily concentrated at these top ports, which collectively operated 570 ship-to-shore gantry cranes as of December 2024. Out of these, 248 were super post-panamax cranes, which are capable of serving the largest vessels and represent the most advanced and productive equipment, regarded as a key area for automation investment. In addition, landside connectivity is a focus, with 17% of the top 25 container ports having on-dock rail transfer facilities, which helps reduce port congestion and is often integrated with automated terminal operations. Hence, these transported containers contribute to B2B trade, thereby positively impacting automated container terminal market growth.
Key Operational Metrics Influencing Automation Investment at U.S. Container Ports
|
Metric |
Statistic |
Details |
|
Total U.S. Loaded TEUs (2022) |
45.7 million TEUs |
Defines the total annual market size and volume potential that automated systems are deployed to handle. |
|
Ports Handling Containers |
110 U.S. Ports |
Indicates the number of potential sites for automation, though investment is likely concentrated in the highest-volume locations. |
|
TEU Handling by Coast (2022) |
East Coast: 47% |
Shows the competitive balance and regional market share, guiding where automation investments are most strategic. |
|
Key Infrastructure: Channel Depth |
West Coast ports have the deepest channels (e.g., natural harbors of LA/LB). |
Deep channels accommodate the largest vessels, which are primary users of highly automated terminals. |
|
Impact of External Disruption |
Port of Baltimore imports dropped 70% month-over-month after the Key Bridge collapse. |
Highlights the vulnerability of supply chains and the value of resilient, automated operations that can adapt and reroute cargo. |
Source: Bureau of Transportation Statistics