Advanced Visualization Market Outlook:
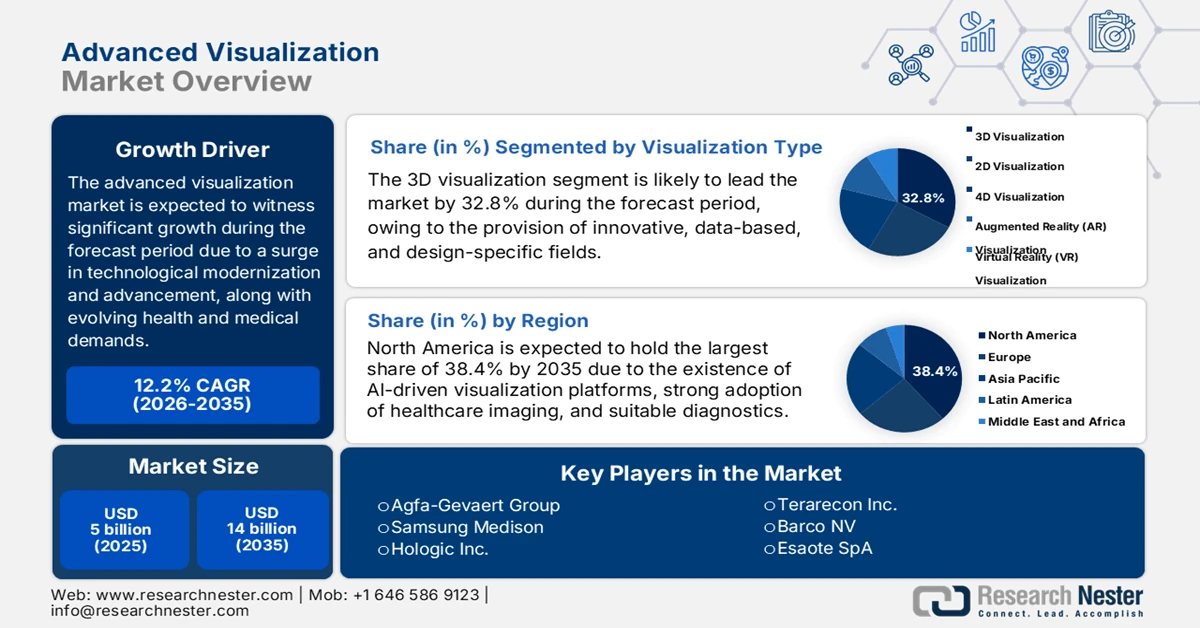
Advanced Visualization Market size was over USD 5 billion in 2025 and is estimated to reach USD 14 billion by the end of 2035, expanding at a CAGR of 12.2% during the forecast timeline, i.e., 2026-2035. In 2026, the industry size of advanced visualization is assessed at USD 5.6 billion.
The worldwide advanced visualization market is proactively entering into a transformative phase, effectively shaped by technological innovation, cross-industrial adoption, and evolving healthcare demands. According to official statistics published by the World Bank Organization in August 2023, there has been a generous investment of nearly USD 4 billion in digitalized health, such as infrastructure, identification systems, digital governance, and health information systems. Besides, in India, digital innovations, including tele-consultations, have reached over 140 million people and provide efficient, cost-effective, and accessible healthcare for the total population. Moreover, evidence-specific digital and people-centric investments tend to assist governments in saving almost 15% of health expenses, thereby making it suitable for bolstering the advanced visualization market globally.
Furthermore, the integration with digital twins, sustainability-driven visualization platforms, and cross-industrial convergence are other drivers that are uplifting the advanced visualization market across different economies. As stated in an article published by NLM in February 2025, the emerging industry for medical digital twins is expected to reach USD 183 billion by the end of 2031, resulting in different industrial efforts to implement and develop digital twins for healthcare internationally. In addition, through this technological adoption, the analysis of temporal disease trajectories of more than 200 million people in America was conducted, thus revealing 10 constellations of comorbid disorders. Besides, a health record of more than 480,000 individuals in the U.S. denoted that different combinations of environmental and genetic factors play a crucial role in schizophrenia risk, thus enhancing the market’s demand.
Key Advanced Visualization Market Insights Summary:
Regional Highlights:
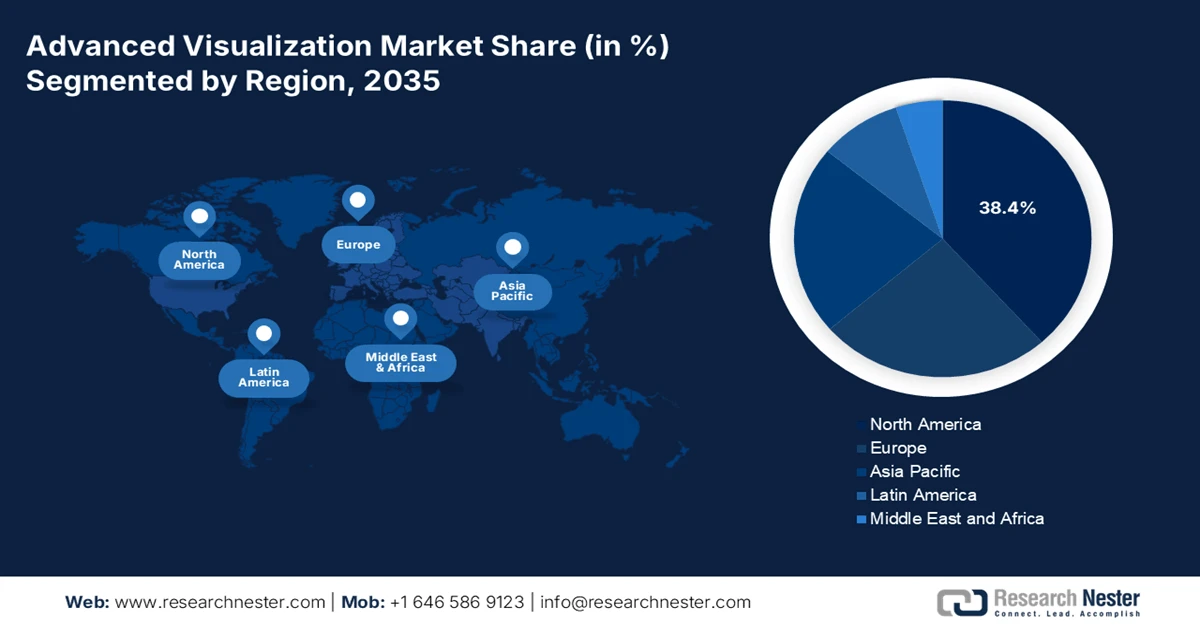
- North America is expected to secure a dominant 38.4% share by 2035 in the advanced visualization market, reinforced by strong uptake of AI-enabled visualization platforms, oncology-focused diagnostics, and widespread adoption of healthcare imaging.
- Asia Pacific is projected to register the fastest expansion over the forecast period 2026–2035, accelerated by rising demand for precision diagnostics, rapid healthcare digitalization, and supportive government-led AI initiatives.
Segment Insights:
- The 3D visualization segment within the visualization type is forecast to account for a 32.8% share by 2035 in the advanced visualization market, strengthened by its expanding use in transforming complex datasets into interactive and actionable 3D models.
- The healthcare segment is anticipated to represent the second-largest share over the forecast period 2026–2035, propelled by the increasing global cancer burden and the growing need for precision diagnostics.
Key Growth Trends:
- Regulatory push for interoperability
- Rise in the demand for personalized medicine
Major Challenges:
- Increased implementation expenses
- Data privacy and security concerns
Key Players: GE Healthcare, Siemens Healthineers, Philips Healthcare, Fujifilm Holdings Corporation, Canon Medical Systems Corporation, Hitachi Medical Systems, Toshiba Medical Systems, Carestream Health, Agfa-Gevaert Group, Samsung Medison, Hologic Inc., Terarecon Inc., Barco NV, Esaote SpA.
Global Advanced Visualization Market Forecast and Regional Outlook:
Market Size & Growth Projections:
- 2025 Market Size: USD 5 billion
- 2026 Market Size: USD 5.6 billion
- Projected Market Size: USD 14 billion by 2035
- Growth Forecasts: 12.2% CAGR (2026-2035)
Key Regional Dynamics:
- Largest Region: North America (38.4% Share by 2035)
- Fastest Growing Region: Asia Pacific
- Dominating Countries: United States, China, Germany, Japan, United Kingdom
- Emerging Countries: India, South Korea, Brazil, Canada, Australia
Last updated on : 30 January, 2026
Advanced Visualization Market - Growth Drivers and Challenges
Growth Drivers
- Regulatory push for interoperability: Regulatory and governmental bodies are readily mandating interoperable visualization platforms to enable seamless data exchange across industries, research centers, and hospitals, which is proliferating the advanced visualization market. According to official statistics published by NLM in April 2025, health information exchange (HIE) constitutes a statistically significant association with diminishing emergency departmental visits by 53%, along with a rehospitalization reduction by 61%. Besides, this overall HIE process can be facilitated by accessing and retrieving clinical data to offer equitable, effective, timely, and safe patient-centered care, thereby making it suitable for boosting the market across different nations.
- Rise in the demand for personalized medicine: The advanced visualization market ensures patient-centric treatment and imaging planning that effectively supports precision medicine strategies globally. As per an article published by NLM in February 2023, the aspect of data generation in the healthcare industry is significantly increasing by 48% every year. This expansion in medical data is converted into clinical advantages for patients by deliberately providing suitable predictive diagnoses, personalized care, and treatments to targeted populations and individuals. Besides, according to the 2024 Biomed Pharma Journal Organization article, just 11% of global patients are readily aware of personalized medicine through doctors, and these medicines have made it possible to aid and diagnose rapidly growing diseases, particularly cancer, thus uplifting the market’s growth.
- Expansion in telehealth and remote services: The advanced visualization market is extremely critical, with telemedicine emerging as the mainstream aspect, especially for surgical planning and remote diagnostics. As per a data report published by OECD in 2025, France witnessed that 90% of its citizens have readily utilized telemedicine tools to gain medical care, as well as 70% have significantly activated and used the telemedicine platform. In addition, of this population, 74% are of the opinion that there is a positive impact on telemonitoring and integrated care. Besides, medical specialists constitute an increased uptake of video consultations at 75% and 48% of telehealth consultations by video, thus making it suitable for the market’s growth and expansion across different countries.
Challenges
- Increased implementation expenses: Systems in the advanced visualization market require significant investment in hardware, software, and skilled personnel. Hospitals and diagnostic centers often face budget constraints, making it difficult to justify the upfront costs of adopting these technologies. The expense is compounded by the need for continuous upgrades, integration with existing IT infrastructure, and training programs for medical staff. Smaller healthcare facilities, particularly in emerging markets, struggle to afford these solutions, leading to uneven adoption across regions. Additionally, the cost of maintaining cloud-based visualization platforms and ensuring cybersecurity compliance adds financial pressure. Vendors are attempting to mitigate this challenge by offering subscription-based models and hybrid deployment options, but affordability remains a barrier.
- Data privacy and security concerns: The availability of systems in the advanced visualization market relies heavily on patient data, including sensitive medical imaging records. With the increasing adoption of cloud-based platforms and AI-driven visualization, concerns about data privacy and cybersecurity have intensified. Healthcare providers must comply with stringent regulations such as HIPAA in the U.S. and GDPR in Europe, which mandate strict data protection standards. Breaches or unauthorized access to patient data can lead to severe legal, financial, and reputational consequences. Moreover, the complexity of integrating visualization systems with legacy IT infrastructure often exposes vulnerabilities, making them attractive targets for cyberattacks.
Advanced Visualization Market Size and Forecast:
| Report Attribute | Details |
|---|---|
|
Base Year |
2025 |
|
Forecast Year |
2026-2035 |
|
CAGR |
12.2% |
|
Base Year Market Size (2025) |
USD 5 billion |
|
Forecast Year Market Size (2035) |
USD 14 billion |
|
Regional Scope |
|
Advanced Visualization Market Segmentation:
Visualization Type Segment Analysis
The 3D visualization segment, part of the visualization type, is anticipated garner the largest share of 32.8% in the advanced visualization market by the end of 2035. The segment’s upliftment is highly driven by its importance in design-oriented, data-driven, and advanced fields for transforming complicated data into actionable and interactive 3D models. According to official statistics published by NLM in September 2025, the level-of-detail (LOD) control techniques have the capability to collectively reduce model load times by an estimated 25%. These particular techniques can significantly simplify 3D model geometry without effective loss of fidelity, and meanwhile, localized caching mechanisms can diminish repeated API calls. Therefore, with the availability of such technologies, there is a huge growth opportunity for the segment within the market globally.
Industry Application Segment Analysis
The healthcare segment in the advanced visualization market is projected to account for the second-largest share during the forecast period. The segment’s growth is highly fueled by the rising global cancer burden and the need for precision diagnostics. Advanced visualization tools enable clinicians to interpret complex imaging data from CT, MRI, PET, and ultrasound scans with greater accuracy, supporting early detection, staging, and treatment planning. Multi-dimensional visualization, including 3D and 4D imaging, allows oncologists to assess tumor morphology, monitor progression, and evaluate therapeutic outcomes in real time. Besides, the integration with AI algorithms further enhances diagnostic accuracy by identifying subtle patterns that may be missed by traditional imaging.
Deployment Model Segment Analysis
The cloud-based sub-segment, which is part of the deployment model segment, is expected to hold the third-largest share in the advanced visualization market. The sub-segment’s development is highly attributed to the most preferred choice for advanced visualization solutions, offering scalability, cost efficiency, and accessibility. Unlike on-premises systems, cloud platforms enable healthcare providers and enterprises to access visualization tools remotely, supporting telemedicine, collaborative diagnostics, and global research initiatives. Cloud deployment reduces the need for expensive hardware infrastructure, shifting costs toward subscription-based models that are more affordable for smaller hospitals and clinics. It also facilitates seamless integration with electronic health records (EHRs) and other digital health platforms, ensuring interoperability across diverse healthcare systems.
Our in-depth analysis of the advanced visualization market includes the following segments:
|
Segment |
Subsegments |
|
Visualization Type |
|
|
Industry Application |
|
|
Deployment Model |
|
|
Imaging Modality |
|
|
Solution Type |
|
|
Data Type |
|

Vishnu Nair
Head - Global Business DevelopmentCustomize this report to your requirements — connect with our consultant for personalized insights and options.
Advanced Visualization Market - Regional Analysis
North America Market Insights
North America advanced visualization market is anticipated to garner the highest share of 38.4% by the end of 2035. The market’s upliftment in the region is highly driven by AI-based visualization platforms, oncology diagnostics, and a robust adoption of healthcare imaging. According to official statistics published by the AJR Organization in June 2022, the population in the U.S. is projected to surge by 18%, deliberately expanding from the present total of 331 million individuals to 389 million. This eventually denotes demographic modifications that tend to impact the future expenditure on imaging in populations that are covered by employer-sponsored insurance (ESI). Besides, a clinical study was conducted on 26,158,337 individuals, aged between 0 and 64 years, as well as 1,077,565 individuals aged between 65 and 118 years, regarding the medical imaging payer’s pricing demonstration. Therefore, the yearly spending for male and female neonates and infants amounted to USD 299 and USD 270, respectively. After a year’s gap, the spending reduced to USD 116 and USD 102, thus driving the advanced visualization market’s demand.
The advanced visualization market in the U.S. is growing significantly, owing to suitable reimbursement policies, federal healthcare budget allocations, an increase in elderly patient demand, and strong biotech partnerships. Based on government investments published by the CMS Government in January 2026, the national health expenditure (NHE) in the country upsurged by 7.2% to USD 5.3 trillion as of 2024 or USD 15,474 per person, thereby accounting for 18.0% of the gross domestic product (GDP). Besides, the Medicare expenditure also grew by 7.8%, amounting to USD 1,118.0 billion, which is 21% of the overall NHE, while the Medicaid spending increased by 6.6% to USD 931.7 billion, which is 18% of the total NHE. Moreover, there has also been an increase in private health insurance by 8.8% to USD 1,644.6 billion, thereby denoting a huge growth opportunity for the market.
The existence of provincial and federal healthcare investments, adoption of visualization technologies for cardiology and oncology, government-driven investments, and collaboration between pharmaceutical firms are readily uplifting the advanced visualization market in Canada. As per an article published by the Canada Drug Agency in August 2024, over 9.5 million innovative imaging exams have been significantly conducted in the country between 2022 and 2023, denoting a 12% increase. Besides, between 10% and 25% of medical imaging evaluations are conducted every year in the country. Moreover, the approximate 5-year expense associated with low-value scanning in early-stage breast cancer was roughly between USD 4.4 million and USD 6.8 million. Therefore, with all such developments of imaging technologies and evaluations, there is a huge demand for the market in the country.
APAC Market Insights
The Asia Pacific advanced visualization market is expected to emerge as the fastest-growing region during the forecast period. The market’s development is highly propelled by an increase in the patient demand for precision diagnostics, rapid healthcare digitalization, and government-based AI strategies. According to official statistics published by LabMed Discovery in December 2024, the radiopharmaceutical landscape for precision medicine in the region demonstrates the highest growth potential, with a 12.8% growth rate that has exceeded the international average. Besides, the radiopharmaceutical industry in China has reached USD 840.9 million as of 2024, which is further projected to grow at 12.3% by the end of 2031, significantly surpassing the worldwide average of 10.8%. Therefore, with this continuous growth in this industry, the market is poised to gain exposure in the overall region.
The presence of government healthcare digitalization programs, massive patient base, AI-based integration in imaging, hospital infrastructure expansion, and growth in government spending are readily proliferating the advanced visualization market in China. Based on government estimates published by NMPA in July 2024, the country effectively unveiled 9 rounds of bulk drug procurement programs to cover 500 medications for carrying out pilot price reforms of medical services. Besides, long-lasting wait duration for registration, settling hospital bills, and medical examinations are grievances among patients in the country. However, to overcome this, more than 5,500 wide-ranging hospitals currently offer one-stop services, thus ensuring 77.7% of hospitalized patients can significantly settle their medical bills on discharge days, thus bolstering the market in the country.
The advanced visualization market in India is also developing, owing to the existence of digitalized health approaches, cost-effective accessibility programs, private sector collaboration, an increase in patient demand, and government-based medical investments. As stated in an article published by the ITA in January 2024, the country’s population is continuously growing at a 1.6% rate and comprises an elderly population of more than 100 million. Besides, the nation’s healthcare sector has reached more than USD 370 million as of 2022, and it is further predicted to reach more than USD 610 billion by the end of 2026. In addition, the domestic healthcare accessibility and quality index score has optimized and further increased from 44.8 to 67.3. Furthermore, the public expenditure on healthcare stood at 2% of the GDP as of 2022, which is suitable for boosting the market.
Europe Market Insights
Europe advanced visualization market is projected to witness considerable growth by the end of the stipulated duration. The market’s growth in the region is highly fueled by comprehensive digitalized health strategies, cloud-based visualization platforms, and AI-specific imaging. According to official statistics published by the Open Access Government Organization in April 2025, the Europe Digital Innovation Hubs have significantly supported the digitalization of almost 9,000 small and medium-sized enterprises (SMEs) as well as 800 public sector entities. Besides, an active and widespread network readily covers 90% of regional economies and has successfully organized more than 5,000 events, reaching over 200,000 participants. Moreover, the ongoing supply of MRI machines is also effectively bolstering the medical imaging technology in the overall region.
2023 MRI Machine Export and Import Analysis in Europe
|
Countries |
Export (USD) |
Import (USD) |
|
Netherlands |
72 million |
37 million |
|
Germany |
9.9 million |
37.4 million |
|
France |
3.3 million |
997,000 |
|
Spain |
1.2 million |
325,000 |
|
Poland |
1.2 million |
- |
|
UK |
397,000 |
607,000 |
Source: OEC
The aspects of advanced hospital infrastructure, robust government expenditure, and increased priority on AI-driven interoperability are factors that are boosting the advanced visualization market in Germany. As per an article published by NLM in May 2025, the country’s actual healthcare spending amounted to EUR 415 billion, which further increased to EUR 498 billion as of 2022, denoting a 20% rise. Besides, an estimated 88% of the working population is significantly covered by statutory health insurance, and following this pattern, employees and their employers presently pay 7.3% of their respective gross wages as contributions on a parity basis. Moreover, the mean valuation of medical payments surged from EUR 136.0 per month to EUR 178.6 per month, thereby denoting a huge growth opportunity for the market in the overall country.
The advanced visualization market in the UK is also growing, owing to the support provided by NHS-funded modernization programs, a rise in cancer diagnostics, and an increase in healthcare budgets. Based on government estimates published by the Office for National Statistics in May 2024, the country’s healthcare spending was nearly £292 billion as of 2023. In addition, the healthcare expenditure as a share of GDP slightly decreased to 10.9% in the same year since GDP expansion surpassed healthcare spending growth. Besides, the overall spending surged by 5.6% in case of nominal terms in the same year, and meanwhile, government-backed healthcare cost was nearly £239 billion. Moreover, the country’s overall pharmaceutical spending lowered by 16.6% in real terms, and despite this fluctuation, the market is continuously growing in the country.
Key Advanced Visualization Market Players:
- GE Healthcare (U.S.)
- Siemens Healthineers (Germany)
- Philips Healthcare (Netherlands)
- Fujifilm Holdings Corporation (Japan)
- Canon Medical Systems Corporation (Japan)
- Hitachi Medical Systems (Japan)
- Toshiba Medical Systems (Japan)
- Carestream Health (U.S.)
- Agfa-Gevaert Group (Belgium)
- Samsung Medison (South Korea)
- Hologic Inc. (U.S.)
- Terarecon Inc. (U.S.)
- Barco NV (Belgium)
- Esaote SpA (Italy)
- Medtronic (Ireland)
- Brainlab AG (Germany)
- Lantheus Holdings (U.S.)
- Optasia Medical (UK)
- ClariPi Inc. (South Korea)
- 4D Medical (Australia)
- Company Overview
- Business Strategy
- Key Product Offerings
- Financial Performance
- Key Performance Indicators
- Risk Analysis
- Recent Development
- Regional Presence
- GE Healthcare is a global leader in medical imaging and advanced visualization solutions, with strong adoption in radiology and oncology. Its focus on AI-powered visualization platforms and cloud integration positions it as a dominant player in precision diagnostics.
- Siemens Healthineers readily drives innovation in advanced visualization through its syngo platform and AI-enabled imaging. The company’s strength lies in integrating visualization into clinical workflows, particularly in cardiology and neurology, supported by strong European healthcare partnerships.
- Philips Healthcare emphasizes patient-centric visualization technologies, offering advanced 3D and 4D imaging solutions. Its IntelliSpace platform enhances diagnostic accuracy and efficiency, making Philips a key player in digital health transformation across Europe and beyond.
- Fujifilm Holdings Corporation leverages its expertise in imaging to deliver advanced visualization solutions for oncology and radiology. The company’s Synapse platform integrates AI-driven visualization, expanding its footprint in Asia-Pacific and global healthcare markets.
- Canon Medical Systems Corporation focuses on advanced visualization in CT and MRI imaging, with strong research and development investments in AI. Its Aquilion series and visualization software are widely adopted in hospitals, reinforcing its leadership in diagnostic imaging.
Here is a list of key players operating in the global advanced visualization market:
The worldwide advanced visualization market is highly competitive, dominated by multinational corporations from the U.S., Europe, and the Asia Pacific. Companies such as GE Healthcare, Siemens Healthineers, and Philips Healthcare lead with strong portfolios and global distribution networks. Japanese firms, including Fujifilm and Canon Medical Systems, are expanding through AI-driven imaging solutions, while South Korea and Australia contribute innovative niche technologies. Strategic initiatives include mergers and acquisitions, research and development investments in AI-powered visualization, and partnerships with hospitals and research institutions. Besides, in December 2025, Philips demonstrated its newest innovations in artificial intelligence and advanced visualization, which has been designed to simplify radiology workflows. The ultimate purpose is to enhance diagnostic confidence and assist clinicians in focusing on providing high-quality patient care, thereby skyrocketing the advanced visualization industry globally.
Corporate Landscape of the Advanced Visualization Market:
Recent Developments
- In April 2025, Konica Minolta Healthcare Americas, Inc. introduced the next-generation of the Exa Platform with the most innovative version of Exa PACS| RIS, featuring the newest API platform for integrating with tactical partners.
- In February 2025, Fujitsu Limited declared the launch of a suitable software analysis as well as visualization service, intended to support organizational and enterprise modernization by analyzing and investigating software.
- In January 2025, Samsung Electronics unveiled Samsung Vision AI, suitable for delivering a personal AI-driven screen to enrich regular life, along with introducing the newest flagship Neo QLED 8K QN990F and achieving updates for its Lifestyle TVs and future display technologies.
- Report ID: 8372
- Published Date: Jan 30, 2026
- Report Format: PDF, PPT
- Explore a preview of key market trends and insights
- Review sample data tables and segment breakdowns
- Experience the quality of our visual data representations
- Evaluate our report structure and research methodology
- Get a glimpse of competitive landscape analysis
- Understand how regional forecasts are presented
- Assess the depth of company profiling and benchmarking
- Preview how actionable insights can support your strategy
Explore real data and analysis
Frequently Asked Questions (FAQ)
Advanced Visualization Market Report Scope
Free Sample includes current and historical market size, growth trends, regional charts & tables, company profiles, segment-wise forecasts, and more.
Connect with our Expert


Copyright @ 2026 Research Nester. All Rights Reserved.
