관리 서비스 시장 전망:
매니지드 서비스 시장 규모는 2025년 3,803억 3천만 달러로 평가되었으며, 2035년까지 1조 2,700억 달러를 돌파할 것으로 예상됩니다. 2026년부터 2035년까지 예측 기간 동안 12.8% 이상의 연평균 성장률(CAGR)을 기록할 것으로 예상됩니다. 2026년 매니지드 서비스 산업 규모는 4,241억 4천만 달러로 추산됩니다.
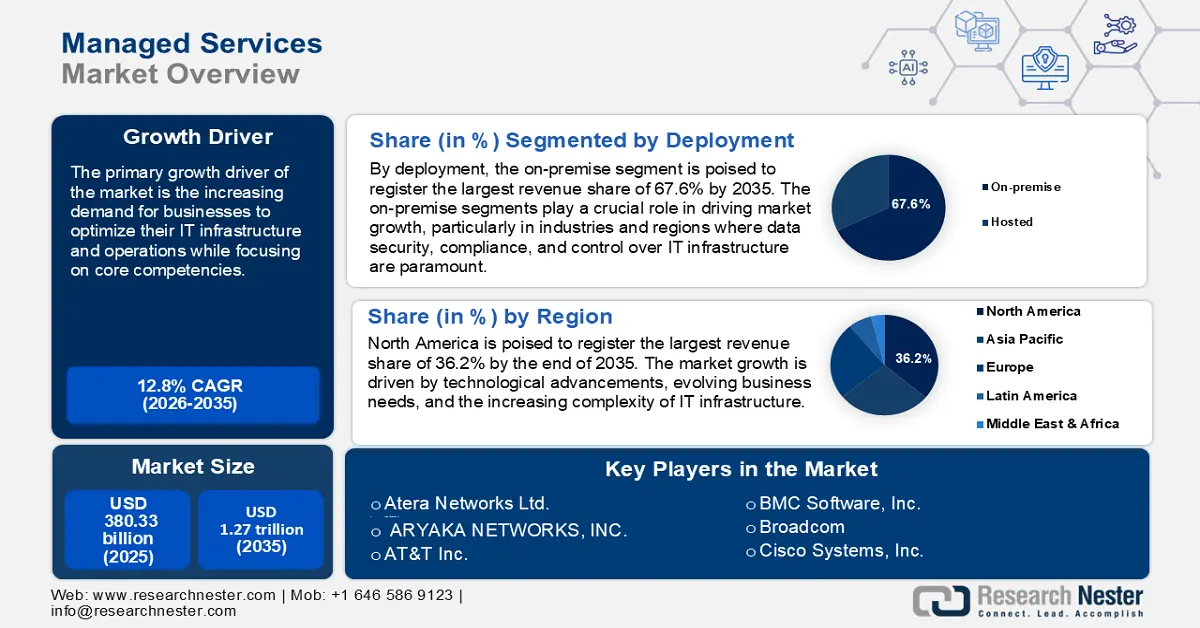
매니지드 서비스 시장의 주요 성장 동력은 기업이 핵심 역량에 집중하면서 IT 인프라와 운영을 최적화하려는 수요 증가입니다. 기업들은 네트워크 관리, 사이버 보안, 클라우드 운영 등의 업무를 매니지드 서비스 제공업체(MSP)에 아웃소싱하여 IT 운영 비용을 절감하고자 합니다. 매니지드 서비스는 기업이 자본 지출(CapEx)에서 예측 가능한 운영 지출(OpEx)로 전환하여 예산 계획을 개선하는 데 도움을 줍니다.
더욱이 클라우드 기반 솔루션으로의 전환은 마이그레이션, 유지 관리 및 최적화를 포함한 관리형 클라우드 서비스에 대한 수요를 증가시키고 있습니다. 2024년 5월 기준, 전 세계 기업의 약 94%가 운영에 클라우드 컴퓨팅을 사용하고 있습니다. 기업들은 원활한 통합과 확장성을 위해 MSP(Managed Service Provider)가 멀티 클라우드 및 하이브리드 환경을 관리해 줄 것을 요구합니다. MSP는 IoT, AI, 엣지 컴퓨팅 과 같은 신기술의 구축 및 관리를 지원하는 데 핵심적인 역할을 합니다.
키 관리 서비스 시장 통찰 요약:
지역별 주요 내용:
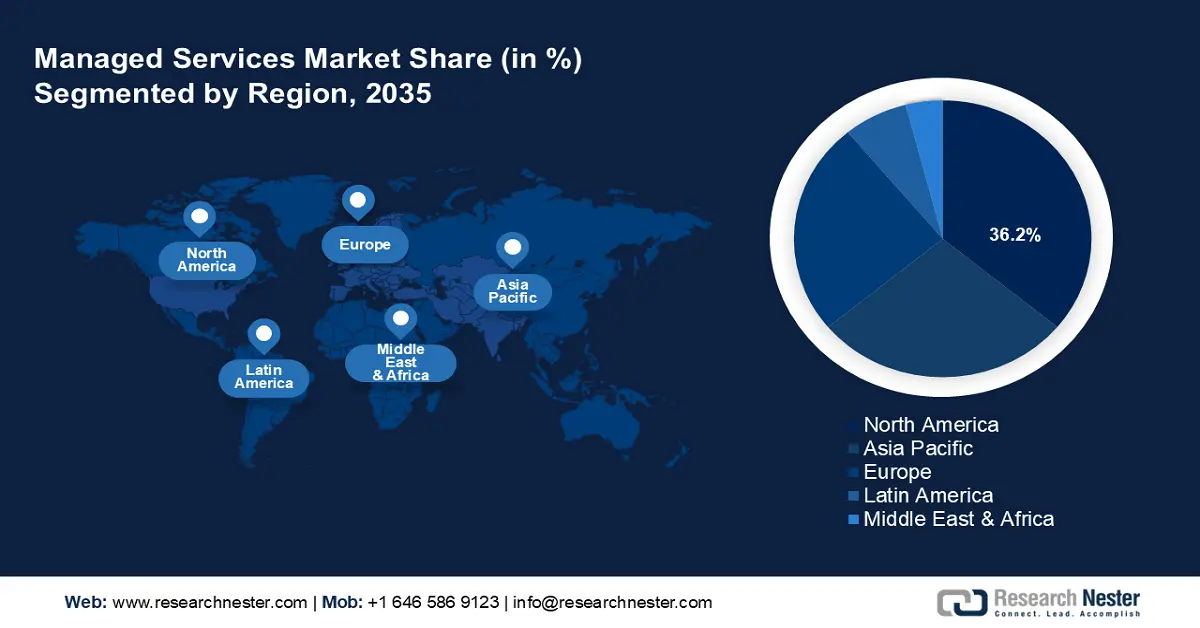
- 북미 지역은 기술 발전, 변화하는 비즈니스 요구, 그리고 IT 인프라의 복잡성 증가에 힘입어 매니지드 서비스 시장의 36.2%를 차지하며 2026년부터 2035년까지 시장 선도 자리를 굳건히 지킬 것입니다.
- 아시아 태평양 지역의 매니지드 서비스 시장은 디지털 혁신과 클라우드 컴퓨팅 도입 증가에 힘입어 2035년까지 빠르게 성장할 것으로 예상됩니다.
세그먼트 인사이트:
- 온프레미스 부문은 규제 대상 산업의 데이터 보안 요구 및 규정 준수에 힘입어 2035년까지 67.6% 이상의 시장 점유율을 차지할 것으로 예상됩니다.
- 관리형 서비스 시장의 대기업 부문은 확장 가능한 IT 및 관리형 보안 서비스에 대한 요구로 인해 2035년까지 60%의 시장 점유율을 차지할 것으로 예상됩니다.
주요 성장 추세:
- 사이버 보안 우려 증가
- 사물 인터넷(IoT) 및 엣지 컴퓨팅의 성장
주요 과제:
- 높은 초기 설정 비용
- 기업의 인지도 및 전문성 부족
- 주요 기업:Atera Networks Ltd., Allegro MicroSystems, Inc., ARYAKA NETWORKS, INC., AT&T Inc., BMC Software, Inc., Broadcom, Cisco Systems, Inc.
글로벌 관리 서비스 시장 예측 및 지역 전망:
시장 규모 및 성장 전망:
- 2025년 시장 규모: 3,803억 3천만 달러
- 2026년 시장 규모: 4,241억 4천만 달러
- 예상 시장 규모: 2035년까지 1조 2,700억 달러
- 성장 전망: 12.8% CAGR (2026-2035)
주요 지역 역학:
- 가장 큰 지역: 북미(2035년까지 점유율 36.2%)
- 가장 빠르게 성장하는 지역: 아시아 태평양
- 지배 국가: 미국, 캐나다, 영국, 독일, 일본
- 신흥국: 중국, 인도, 일본, 한국, 싱가포르
Last updated on : 25 August, 2025
관리 서비스 시장 성장 동인 및 과제:
성장 동력
사이버 보안 우려 증가: 맬웨어, 피싱, 랜섬웨어, 지능형 지속 위협(APT)과 같은 일반적인 사이버 위협이 증가함에 따라 기업의 사이버 보안 강화는 필수적입니다. 사이버 보안 통계에 따르면 매일 2,200건의 사이버 공격이 발생하며, 평균 39초마다 한 건씩 발생합니다. 미국에서는 2023년 기준 데이터 유출로 인한 피해액이 평균 944만 달러에 달하며, 사이버 범죄로 인한 피해액은 8조 달러에 달합니다. 워너크라이 랜섬웨어 공격과 대기업 데이터 유출과 같은 대규모 사이버 공격은 강력한 사이버 보안 조치의 중요성에 대한 인식을 높였습니다. 따라서 기업들은 24시간 위협 탐지, 취약성 평가, 사고 대응 서비스를 제공하는 매니지드 서비스 제공업체를 찾고 있습니다.
조직은 민감한 데이터를 보호하기 위한 강력한 보안 조치를 구현하도록 요구하는 다양한 데이터 개인정보 보호 규정(예: GDPR, HIPAA, CCPA)을 준수해야 합니다. 매니지드 서비스는 필요한 보안 프로토콜, 도구 및 감사를 마련하여 기업이 이러한 규정 준수 요건을 충족하도록 지원합니다.- 사물 인터넷(IoT)과 엣지 컴퓨팅의 성장: 2023년 말까지 연결된 IoT 기기는 166억 대에 달했습니다(2022년 대비 15% 증가). IoT는 방대한 양의 데이터를 생성하며, 기능, 효율성, 보안을 보장하기 위해 정교한 관리가 필요합니다.
IoT 기기와 엣지 컴퓨팅의 확산은 IT 환경의 복잡성을 증가시키고 있으며, 기업들은 모니터링 및 관리를 위해 MSP(Managed Service Provider)를 활용하고 있습니다. MSP는 대규모 IoT 및 엣지 컴퓨팅 인프라 관리에 대한 전문 지식을 제공하여 최적의 성능과 보안을 보장합니다. 또한, 엣지 컴퓨팅은 로컬 데이터 처리, 지연 시간 단축, IoT 애플리케이션의 실시간 의사 결정 향상에 필수적입니다. - 디지털 혁신에 대한 집중도 증가: 기업이 디지털 혁신을 추진함에 따라, 매니지드 서비스는 AI, 머신러닝, 자동화와 같은 신기술의 성공적인 구축에 필요한 IT 지원을 제공합니다. 매니지드 서비스를 통해 기업은 대규모 사내 IT 팀 없이도 이러한 기술을 활용할 수 있습니다.
또한, COVID-10 팬데믹으로 가속화된 원격 근무로의 전환 증가는 디지털 혁신의 핵심 요소입니다. 기업은 MSP(Managed Service Provider)에게 안전하고 안정적인 원격 액세스 및 협업 도구를 제공해야 합니다. 세계경제포럼(WEF)이 발표한 2024년 보고서에 따르면, 2030년까지 전 세계적으로 원격으로 어디서든 수행할 수 있는 디지털 일자리가 약 25% 증가하여 약 9,200만 개에 이를 것으로 예상됩니다.
도전 과제
높은 초기 구축 비용: 기업은 관리형 서비스 구현, 특히 레거시 시스템에서 클라우드 기반 또는 최신 인프라로 전환하는 데 높은 초기 비용을 부담할 수 있습니다. 맞춤형 관리형 서비스는 추가적인 맞춤 설정이 필요한 경우가 많아 초기 비용이 증가합니다. 이로 인해 예산이 부족한 중소기업(SME)은 관리형 서비스 도입을 꺼릴 수 있습니다.
- 기업의 인지도 및 전문성 부족: 많은 기업, 특히 중소기업은 매니지드 서비스의 이점과 역량에 대한 이해가 부족합니다. 기존의 사내 IT 관리를 선호하거나 새로운 서비스 모델 도입을 꺼리는 것은 시장 침투를 저해할 수 있습니다. 인지도 부족은 특히 신흥 매니지드 서비스 시장에서 잠재 고객 기반을 감소시킵니다.
관리 서비스 시장 규모 및 예측:
| 보고서 속성 | 세부정보 |
|---|---|
|
기준 연도 |
2025 |
|
예측 기간 |
2026-2035 |
|
연평균 성장률 |
12.8% |
|
기준 연도 시장 규모(2025년) |
3,803억 3천만 달러 |
|
예측 연도 시장 규모(2035년) |
1조 2,700억 달러 |
|
지역 범위 |
|
관리 서비스 시장 세분화:
배포(온프레미스 및 호스팅)
2035년까지 온프레미스 부문은 관리형 서비스 시장 점유율 67.6% 이상을 차지할 것으로 예상됩니다. 온프레미스 부문은 특히 데이터 보안, 규정 준수, 그리고 IT 인프라에 대한 통제가 중요한 산업 및 지역에서 시장 성장을 견인하는 데 중요한 역할을 합니다. 금융, 의료, 정부와 같은 산업은 엄격한 현지 규정을 준수하기 위해 민감한 데이터를 온프레미스에 저장하고 관리해야 하는 경우가 많습니다. 온프레미스 솔루션을 통해 기업은 보안 프로토콜을 완벽하게 제어하고 클라우드 환경과 관련된 취약점을 줄일 수 있습니다.
온프레미스 부문은 특히 규제 준수와 데이터 주권이 중요한 일본을 포함한 아시아 태평양 지역에서 여전히 중요한 위치를 차지하고 있습니다. 클라우드 도입이 증가하고 있는 가운데, 온프레미스 관리형 서비스 시장 부문은 중요하고 규제가 엄격한 산업 분야에서의 중요성으로 인해 꾸준한 성장세를 유지할 것으로 예상됩니다.
기업 규모 [중소기업(SME) 및 대기업]
기업 규모별로 보면, 대기업 부문은 예측 기간 동안 관리형 서비스 시장에서 수익성 있는 매출 점유율을 기록할 것으로 예상됩니다. 대기업은 여러 지역과 산업에 걸쳐 사업을 운영하고 있으며, 다양한 운영을 관리하기 위해 확장 가능한 IT 솔루션이 필요합니다. 이러한 조직은 사이버 공격의 빈번한 표적이 되기 때문에 민감한 정보를 보호하기 위해 관리형 보안 서비스 에 투자하고 있습니다. 대기업은 전체 관리형 IT 서비스 점유율의 60%를 차지합니다.
더욱이, 대기업들은 하이브리드 및 멀티 클라우드 환경을 점점 더 많이 도입하고 있으며, 이는 MSP의 전문적인 관리를 필요로 합니다. 전 세계 대기업의 70% 이상이 2025년까지 하이브리드 클라우드 솔루션을 도입할 것으로 예상되며, 이러한 환경 관리에서 매니지드 서비스가 핵심적인 역할을 할 것입니다.
관리 서비스 시장에 대한 심층 분석에는 다음 세그먼트가 포함됩니다.
해결책 |
|
관리 정보 서비스(MIS) |
|
전개 |
|
기업 규모 |
|
최종 사용 |
|

Vishnu Nair
글로벌 비즈니스 개발 책임자이 보고서를 귀하의 요구에 맞게 맞춤화하세요 — 맞춤형 인사이트와 옵션을 위해 당사의 컨설턴트와 상담하십시오.
관리 서비스 시장 지역 분석:
북미 시장 전망
북미 산업은 2035년까지 매출 점유율 36.2%를 차지하며 과반을 차지할 것으로 예상됩니다. 매니지드 서비스 시장의 성장은 기술 발전, 진화하는 비즈니스 요구, 그리고 IT 인프라의 복잡성 증가에 의해 주도됩니다. 이 지역 기업들은 확장성과 유연성을 향상시키기 위해 하이브리드 및 멀티 클라우드 모델을 포함한 클라우드 환경으로 빠르게 마이그레이션하고 있습니다. MSP는 이러한 클라우드 환경의 관리, 최적화 및 보안에 중요한 역할을 합니다.
미국 에서는 기업들이 하이브리드 및 멀티 클라우드 환경을 점점 더 많이 도입하고 있으며, 이로 인해 MSP의 전문적인 관리가 요구되고 있습니다. 미국 기업의 65% 이상이 운영을 위해 매니지드 클라우드 서비스를 활용하고 있습니다. 또한, 미국은 사이버 공격이 빈번하게 발생하고 있어 기업들은 사이버 보안 관리를 아웃소싱하고 있습니다. HIPAA, CCPA, SOX와 같은 법률은 엄격한 보안 규정 준수를 의무화하고 있어 기업들이 MSP와 협력하는 것을 장려하고 있습니다.
캐나다 기업들은 AI, 머신러닝, IoT 솔루션을 운영에 점점 더 많이 도입하고 있으며, 통합, 관리 및 보안을 위한 매니지드 서비스를 필요로 하고 있습니다. 많은 지역 기업들이 경쟁력 유지를 위해 디지털 혁신에 투자하고 있으며, 클라우드 컴퓨팅, 인프라 관리, 데이터 분석 등의 서비스를 위해 MSP를 활용하고 있습니다. 개인정보보호 및 전자문서법(PIPEDA)과 같은 캐나다 법률은 기업들이 사이버 보안 및 규정 준수 관리를 MSP에 아웃소싱하도록 장려하고 있습니다.
APAC 시장 분석
아시아 태평양 지역의 매니지드 서비스 시장은 2035년까지 가장 빠른 매출 성장을 기록할 것으로 예상됩니다. 디지털 혁신의 가속화, 클라우드 컴퓨팅 도입 증가, 그리고 중소기업의 성장이 시장 성장을 견인하고 있습니다. 이 지역 기업들이 기술 발전에 적응함에 따라 매니지드 IT 서비스에 대한 수요도 급증하고 있습니다.
중국 에서는 여러 기업이 빠르게 성장하는 시장을 선점하기 위해 매니지드 서비스 상품을 출시하고 확장하고 있습니다. 예를 들어, 2021년 7월, 디지털 경험 기업인 Acquia는 중국 최고의 매니지드 Drupal 서비스를 통해 현지 소비자에게 디지털 경험을 제공하는 새로운 중국 매니지드 서비스 상품을 출시했습니다. 다국적 기업은 중국에서 사업을 운영하는 동안 Acquia의 세계적인 수준의 지원과 Drupal 전문 지식을 활용할 수 있습니다.
인도 의 매니지드 서비스 시장은 디지털 혁신, 중소기업의 성장, 그리고 증가하는 사이버 보안 수요에 힘입어 탄탄한 성장을 이룰 것으로 예상됩니다. 디지털 인디아(Digital India)와 같은 강력한 정부 정책과 AI, IoT, 5G와 같은 첨단 기술의 도입으로 시장은 지속적으로 성장할 것입니다. 국내외 기업들은 비용 효율적이고 확장 가능한 IT 솔루션에 대한 증가하는 수요를 활용할 수 있는 유리한 입지를 갖추고 있습니다.
주요 관리 서비스 시장 참여자:
- 액센추어
- 회사 개요
- 사업 전략
- 주요 제품 제공
- 재무 성과
- 핵심 성과 지표
- 위험 분석
- 최근 개발
- 지역적 존재감
- SWOT 분석
- 아테라 네트웍스 유한회사
- 아리아카 네트웍스 주식회사
- AT&T 주식회사
- BMC 소프트웨어 주식회사
- 브로드컴
- 시스코 시스템즈 주식회사
- 로지칼리스 그룹
- MSP 주식회사
- DXC 테크놀로지 회사
- 인터내셔널 비즈니스 머신즈 코퍼레이션
- 스케일패드 소프트웨어 주식회사
주요 업체들은 클라우드 관리, 사이버 보안, IT 인프라, 네트워크 관리 등 광범위한 서비스를 제공합니다. 이러한 기업들은 다양한 산업에 맞춰 AI, 자동화, 그리고 맞춤형 솔루션에 투자하고 있습니다.
관리 서비스 시장의 주요 업체는 다음과 같습니다.
최근 동향
- 차세대 디지털 관리 서비스를 제공하는 전 세계 기술 서비스 공급업체인 Logicalis는 2023년 9월, Private 5G, SD-WAN, SASE, SSE, SD-Access, ACI 데이터 센터를 포함하는 솔루션 제품군인 Cisco 기반 Intelligent Connectivity 출시를 발표했습니다.
- 2023년 5월, 알파 캐피털(Alfar Capital)과 월터 캐피털 파트너스(Walter Capital Partners)는 캐나다의 유명 매니지드 서비스 제공업체(MSP Corp)를 1억 달러 이상에 인수했습니다. 인수 후, MSP Corp는 기술 및 사이버 보안 솔루션 분야의 유명 매니지드 서비스 제공업체인 그룹 액세스(Groupe Access)와 합병하게 됩니다. 합병된 MSP Corp는 디지털 혁신, 클라우드 컴퓨팅, 사이버 보안 분야에서 업계를 선도할 캐나다의 국가적 매니지드 서비스 플랫폼을 구축합니다.
- Report ID: 6742
- Published Date: Aug 25, 2025
- Report Format: PDF, PPT
- 주요 시장 트렌드 및 인사이트 미리보기를 탐색하세요
- 샘플 데이터 테이블 및 세그먼트 분류를 검토하세요
- 시각적 데이터 표현의 품질을 경험해 보세요
- 보고서 구조 및 연구 방법론을 평가하세요
- 경쟁 환경 분석을 살짝 엿보세요
- 지역별 전망이 어떻게 제시되는지 이해하세요
- 기업 프로파일링 및 벤치마킹의 깊이를 평가하세요
- 실행 가능한 인사이트가 전략을 어떻게 지원할 수 있는지 미리 살펴보세요
실제 데이터와 분석을 탐색하세요
자주 묻는 질문 (FAQ)
관리 서비스 시장 보고서 범위
무료 샘플에는 현재 및 과거 시장 규모, 성장 추세, 지역별 차트 및 표, 기업 프로필, 세그먼트별 전망 등이 포함되어 있습니다.
전문가와 상담하기


저작권 © 2026 리서치 네스터. 모든 권리 보유.
