Waterborne Coating Market Outlook:
Waterborne Coating Market size was valued at USD 1.5 billion in 2025 and is projected to reach USD 3.1 billion by the end of 2035, rising at a CAGR of 7.8 % from 2026-2035. In 2026, the industry size of waterborne coatings is assessed at USD 1.6 billion.
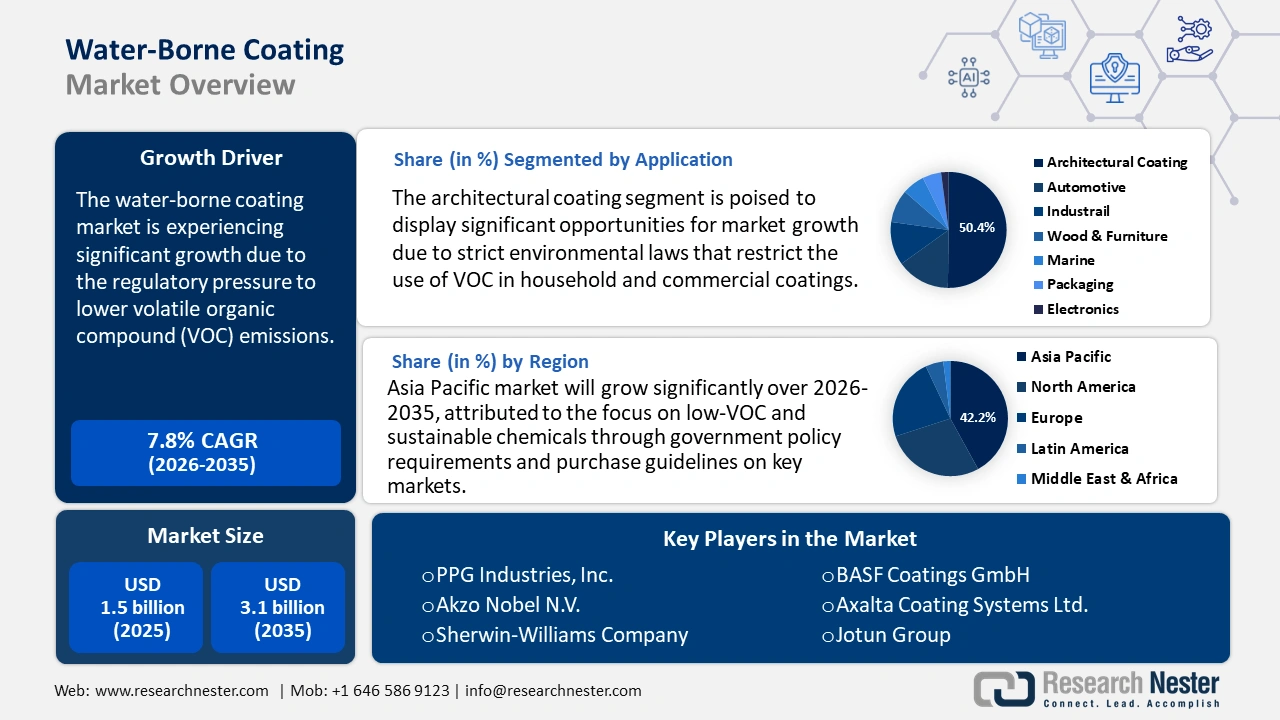
The expansion of the waterborne coating market is primarily influenced by heightened environmental regulations and an increasing demand for low-VOC (volatile organic compounds) solutions. Global regulatory authorities, particularly in North America and Europe, are implementing strict limits on solvent emissions, which is encouraging manufacturers to shift towards waterborne formulations. The trends of urbanization and infrastructure development in areas such as the Asia-Pacific are further driving the need for durable and sustainable architectural and industrial coatings.
Moreover, advancements in waterborne chemistries (including adhesion, weather resistance, and drying time) are contributing to the reduction of the historical performance disparity with solvent-based coatings. A notable instance from the concrete industry is Arkema, which has launched a waterborne polyvinylidene fluoride (PVDF) product line known as Kynar Aquatec. As reported by the Adhesives & Sealants Council, Arkema’s waterborne PVDF range has received the “Solar Impulse Efficient Solution” label due to its remarkable sustainability performance: these coatings provide 300-400% greater durability compared to conventional cool-roof chemistries and achieve a 90% decrease in lifetime VOC emissions.
Key Waterborne Coating Market Insights Summary:
Regional Insights:
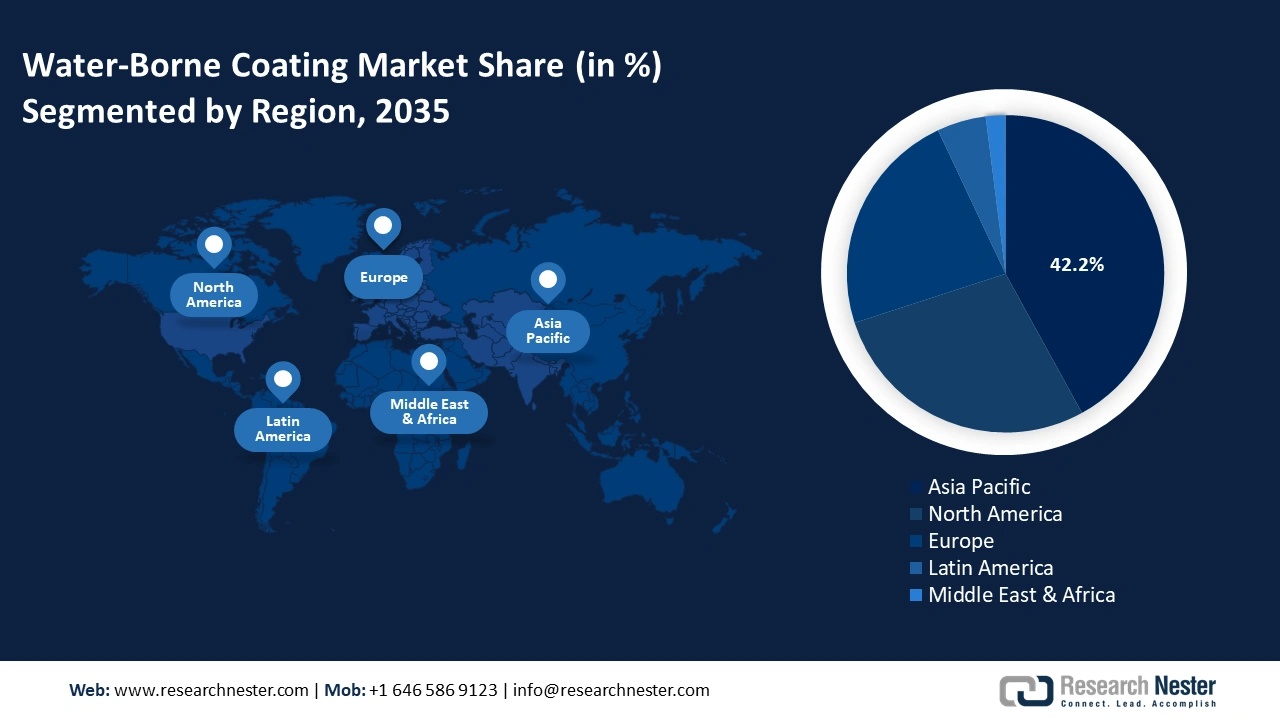
- The Asia Pacific Waterborne Coating Market is projected to command the largest 42.2% share by 2035, driven by rapid urbanization, stringent VOC regulations, and growing adoption of sustainable, low-emission coating technologies.
- North America is anticipated to secure a substantial revenue share by 2035, owing to the surging demand for low-VOC coatings and the enforcement of environmental standards such as the Clean Air Act and TSCA.
Segment Insights:
- The Architectural Coatings segment is anticipated to account for 50.4% share of the Waterborne Coating Market by 2035, influenced by stringent VOC regulations promoting the adoption of low- and zero-VOC formulations to support sustainable construction practices.
- The Acrylic Resin Water-borne System segment is expected to witness robust expansion through 2035, propelled by its superior weatherability, gloss retention, and compliance with EPA and ECHA sustainability standards.
Key Growth Trends:
- High technology adoption in chemical production
- Green chemicals market growth
Major Challenges:
- Performance limitations in harsh conditions
- Compatibility with substrates and formulations
Key Players: PPG Industries, Inc.,Akzo Nobel N.V.,Sherwin-Williams Company,BASF Coatings GmbH,Axalta Coating Systems Ltd.,Jotun Group,Asian Paints Ltd.,RPM International Inc.,DuluxGroup Ltd.,Axalta Coating Systems Ltd.,Berger Paints India Ltd.,Noroo Paint & Coatings Co., Ltd.,KCC Corporation,Nippon Paint Holdings Co., Ltd.,Kansai Paint Co., Ltd.,SK Kaken Co., Ltd.,Shin-Etsu Chemical
Global Waterborne Coating Market Forecast and Regional Outlook:
Market Size & Growth Projections:
- 2025 Market Size: USD 1.5 billion
- 2026 Market Size: USD 1.6 billion
- Projected Market Size: USD 3.1 billion by 2035
- Growth Forecasts: 7.8% CAGR (2026-2035)
Key Regional Dynamics:
- Largest Region: Asia Pacific (42.2% Share by 2035)
- Fastest Growing Region: Europe
- Dominating Countries: China, United States, Germany, Japan, India
- Emerging Countries: South Korea, Brazil, Indonesia, Mexico, Vietnam
Last updated on : 7 October, 2025
Waterborne Coating Market - Growth Drivers and Challenges
Growth Drivers
- High technology adoption in chemical production: Advanced catalytic processes and bio-based chemical technologies have led to a 20% rise in production efficiencies, according to data from the U.S. Department of Energy's Office of Energy Efficiency & Renewable Energy. For coating manufacturers, these advancements reduce operational costs and greenhouse gas emissions. Dow's Renuva polyols decrease CO₂ emissions by 54% compared to traditional polyols and are capable of recycling up to 200,000 mattresses each year, thereby fostering circularity, enhancing resource efficiency, and minimizing environmental impact. Notably, the trend of using less harmful techniques in resin synthesis, such as water-borne acrylic emulsions and polyurethane dispersion, is becoming popular in industrialized plants. This has enabled manufacturers to supply their automotive, architectural, and general industries with low-VOC, compliance coatings at an affordable price range. Continuous-flow processes and catalytic depolymerization also increase throughput to reduce wastes and energy consumption. These innovations assist businesses in attaining both the EPA sustainability measures and the Scope 3 emissions target.
- Green chemicals market growth: The global green chemical market is set for considerable growth between 2026 and 2035, propelled by the increasing use of bio-based solvents, coatings, and dispersants in water-borne formulations. European governments are implementing more stringent decarbonization regulations, while initiatives in the United States are encouraging sustainable chemistry within the coatings industry. Manufacturers of resins are progressively utilizing renewable feedstocks such as vegetable oils and alcohols derived from sugar to produce low-VOC, compliant coatings across various sectors. Green Chemicals Co., Ltd. (GCC) indicates that its biomass-based process decreases CO₂ emissions by around 70% in comparison to petroleum-based production. In 2020, GCC reached fermentation productivity levels using orange juice lees residue that are comparable to those of traditional glucose feedstocks.
- Availability of feedstock and raw materials: Bio-based feedstocks such as bio-alcohols, including ethanol, isobutanol, bio-solvents including ethyl lactate, and biopolymers like PLA, PHA have become more common; the usage of petrochemical inputs derived from fossil fuels in coatings has reduced. In the waterborne coatings value chain, feedstock diversification boosts resilience and helps maintain price stability. The output of bio-based chemicals grew 7% annually in 2023, due to rising crude oil volatility and federal incentives, according to the U.S. Department of Agriculture (USDA). Additionally, according to the U.S. Bio Preferred Program, there are now over 10,000 certified bio-based products, many of which are used in coating formulations, indicating a considerable growth in waterborne coating market adoption. Further, the EU's Renewable Energy Directive (RED II) promotes the use of agricultural waste and forestry residues as industrial inputs. This trend has made it possible for formulators to comply with stricter eco-label and ECHA REACH compliance requirements. Governments' and OEMs' progressive procurement regulations further enhance the demand for renewable raw materials in coatings.
Challenges
- Performance limitations in harsh conditions: Waterborne coatings frequently encounter issues with durability when exposed to extreme conditions, such as elevated humidity or low temperatures. Their extended drying times and susceptibility to moisture during application can impede performance in industrial and automotive environments. These constraints present a significant challenge in substituting solvent-based coatings, where enhanced weather resistance and rapid curing are essential.
- Compatibility with substrates and formulations: Achieving robust adhesion and finish quality on non-porous or oily surfaces continues to be a technical challenge for waterborne coatings. Manufacturers encounter difficulties in developing resins that bond effectively to metals, plastics, or previously coated substrates. This problem limits the universal application of water-borne technologies, particularly in industries that demand multi-surface coating solutions with high chemical or mechanical resistance.
Waterborne Coating Market Size and Forecast:
| Report Attribute | Details |
|---|---|
|
Base Year |
2025 |
|
Forecast Year |
2026-2035 |
|
CAGR |
7.8% |
|
Base Year Market Size (2025) |
USD 1.5 billion |
|
Forecast Year Market Size (2035) |
USD 3.1 billion |
|
Regional Scope |
|
Waterborne Coating Market Segmentation:
Application Segment Analysis
Architectural coatings are anticipated to capture 50.4% of the waterborne coating market by 2035, influenced by stringent regulations that restrict VOC content in both residential and commercial applications. This transition is encouraging manufacturers to develop low- and zero-VOC alternatives, thereby enhancing indoor air quality and aligning with global sustainability initiatives and green building standards. Sherwin-Williams’ ProMar 200 Zero VOC Interior Latex provides six sheen options and a full spectrum of colors, adheres to MPI 53 and 143 standards, is GREENGUARD certified for low emissions, and meets LEED v4 requirements along with rigorous VOC regulations.
Resin Type Segment Analysis
The acrylic resin water-borne system is projected to experience significant growth until 2035, propelled by its outstanding weather resistance, gloss retention, rapid drying capabilities, broad compatibility, and sustainability. In accordance with EPA and ECHA regulations, acrylic resins in well-formulated waterborne systems meet the thresholds for non-hazardous substances. A prominent company in this sector is Sherwin-Williams: its Water-borne Acrylic Alkyd Technology incorporates recycled PET and soybean oil, reduces VOC emissions by approximately 60%, and has successfully eliminated over 800,000 pounds of VOCs in 2010.
Product Type Segment Analysis
Emulsion or dispersion coatings are poised to generate significant revenue owing to their extensive applicability across decorative, industrial, and protective sectors. These water-borne systems offer durability, low VOC emissions, and superior adhesion, rendering them suitable for infrastructure, machinery, and architectural surfaces. Celanese operates global emulsion polymer plants that produce both high-pressure (VAE) and conventional emulsions. With its advanced product portfolio and substantial, efficient production capacity, Celanese is positioned among the leaders in the supply of waterborne emulsion coatings on a global scale.
Our in-depth analysis of the waterborne coating market includes the following segments:
|
Segment |
Subsegment |
|
Product Type |
|
|
Resin Type |
|
|
Application |
|
|
Functional Components |
|

Vishnu Nair
Head - Global Business DevelopmentCustomize this report to your requirements — connect with our consultant for personalized insights and options.
Waterborne Coating Market - Regional Analysis
Asia Pacific Market Insights
The Asia Pacific waterborne coating market is anticipated to hold the dominant position with the largest share of 42.2% in 2035, driven by the high rate of urbanization, strict environmental regulations, and the high level of production of the industries, particularly automobiles and the building sectors. Low-VOC and sustainable chemicals are being focused on through government policy requirements and purchase guidelines on key markets, further boosting the importance of water-borne resin systems. In addition, innovation of the region through clean chemistry and bio-based technology enhances development in waterborne coating market growth. The reach of the export markets is also rising, with the Asia-Pacific producers scaling up to global low-emission levels. Investments in the local capacity and facilitation of trade assist competitiveness through supply chains.
China is anticipated to dominate the waterborne coating market in the Asia Pacific, with significant growth projected by 2035, driven by rising demand in the architectural and industrial infrastructure sectors. The nation's focus on sustainable construction practices and stringent environmental regulations is further propelling the uptake of waterborne coatings, establishing it as a crucial factor in the regional market forecast. AkzoNobel China has recently enhanced its operations by introducing a 2,500‑m² water‑based texture paint production line at its facility in Songjiang, Shanghai, in 2022, as part of its extensive decorative paints.
India’s waterborne coating market is anticipated to experience consistent growth, driven by the swift development of the chemical, construction, and manufacturing sectors. The rise in environmental regulations and the increasing demand for sustainable solutions are significant factors contributing to this trend. JSW Paints is facilitating this growth with its water-borne decorative paint facility in Vijayanagar, Karnataka, which has a capacity of 200,000 KLPA and emphasizes eco-friendly product lines.
North America Market Insights
North America is accounted for a substantial revenue share of the waterborne coating market by 2035, owing to the rising demand for low-VOC coatings in the architecture, industrial, and transportation industries. Regulatory measures such as the Clean Air Act and TSCA are further accelerating the adoption. The key facilitators are the infrastructure projects in the U.S. and low-emission mandates in Canada. Additionally, EPA investments of over USD 19 million and tools developed by NIST that focus on compliance facilitate the development of eco-friendly products in the region. Moreover, federal policies and programs are also coordinated related to industrialized adaptation to environmental aims, enhancing the strength of regional markets.
The U.S. leads the North American market for waterborne coatings, propelled by strict EPA regulations and sustainability criteria established by the Clean Air Act, which restricts VOC emissions. These regulations encourage manufacturers to develop environmentally friendly coatings. For instance, PPG Industries provides low-VOC and zero-VOC waterborne coatings that adhere to these standards, thereby promoting sustainable construction and industrial uses throughout the nation.
Canada’s is expected to experience consistent growth in the waterborne coating market, driven by strict federal emissions regulations and incentives promoting sustainable construction practices. These elements are increasing the demand for environmentally friendly, low-VOC coatings in both residential and commercial sectors. In 2024, BASF's Coatings division reported global sales of around €4.3 billion, demonstrating its dedication to sustainable and high-performance coatings. These efforts highlight BASF Canada's contribution to the advancement of eco-friendly coating technologies in the area.
North America’s Trade Volume (2023)
|
Leading Exporter |
Global Share |
Leading Importer |
Global Share |
|
U.S. |
44.2% |
U.S. |
61.5% |
|
Mexico |
42.3% |
Mexico |
22.3% |
|
Canada |
13% |
Canada |
15% |
Source: OEC
Europe Market Insights
The European waterborne coating market has demonstrated significant growth in recent years, primarily driven by demand in the architectural segment, which was the leading market in 2022. The automotive OEM sector is projected to be the fastest-growing application segment during the forecast period, propelled by the rise of sustainability regulations and the adoption of eco-friendly coating technologies across various industries.
Germany’s waterborne coating market is experiencing consistent growth, fueled by robust demand in the architectural segment, which continues to be the largest revenue contributor. Furthermore, coil coatings are anticipated to be the fastest-growing application, bolstered by industrial advancements and stricter environmental regulations that encourage sustainable coating solutions. Hesse GmbH, a German company that specializes in high-quality waterborne coatings, is dedicated to developing innovative, eco-friendly products for a range of industrial applications.
The UK waterborne coating market is observing steady growth, with the architectural segment at the forefront of revenue generation. The automotive OEM sector is expected to be the fastest-growing application, driven by the increasing demand for sustainable and low-VOC coatings in vehicle manufacturing and maintenance. PPG Industries UK is a leader in waterborne coatings, providing sustainable products such as AQUAPON® WB Epoxy and Envirobase® High Performance. Operating on a global scale, PPG was recognized as the top paint manufacturer in the 2024 Corporate Knights Clean200 list due to its commitment to innovation and environmental sustainability.
Key Waterborne Coating Market Players:
- PPG Industries, Inc.
- Company Overview
- Business Strategy
- Key Product Offerings
- Financial Performance
- Key Performance Indicators
- Risk Analysis
- Recent Development
- Regional Presence
- SWOT Analysis
- Akzo Nobel N.V.
- Sherwin-Williams Company
- BASF Coatings GmbH
- Axalta Coating Systems Ltd.
- Jotun Group
- Asian Paints Ltd.
- RPM International Inc.
- DuluxGroup Ltd.
- Axalta Coating Systems Ltd.
- Berger Paints India Ltd.
- Noroo Paint & Coatings Co., Ltd.
- KCC Corporation
- Nippon Paint Holdings Co., Ltd.
- Kansai Paint Co., Ltd.
- SK Kaken Co., Ltd.
- Shin-Etsu Chemical
The waterborne coating market is very competitive, with the top players being multinational companies such as PPG Industries, Akzo Nobel, and Sherwin-Williams, among others, capturing more than 19% of the global share. These players are increasing R&D in the direction of durable coating with low-VOC levels and extended wear. Japanese firms such as Nippon Paint and Kansai Paint are taking advantage of regional domination and expanding to Southeast Asia. New entrants in India and South Korea are investing in green technologies and local scale-up. Strategic initiatives include joint ventures, innovations in green chemistry, and M&A specialty coatings in anticipation of the new environmental safety measures and changes in consumer preferences.
Top Global Manufacturers in the Waterborne Coating Market:
Recent Developments
- In November 2024, CRX Coatings introduced water-borne marine bottom paint with graphene enhancement. This product serves corrosion resistance and biofouling issues in the recreational boating industry, as well as provides an environmentally friendly alternative to solvent-based marine paints. The formulation has high barrier performance, strength, and low environmental toxicity leveraged from graphene. The launch also enhances regulatory standards on coastal emissions and wastewater standards. The evolution of CRX is associated with the wider trend toward performance-upgraded waterborne coatings in marine and heavy-duty market segments.
- In March 2024, Covestro launched a range of new waterborne and waterborne-UV resins intended for industrial use in furniture, flooring, and wound cabinet coverings. These resins provide better surface durability, a more rapid drying time, and meet low-VOC regulatory requirements. The launch was aimed at the increasing demand of manufacturers for sustainable alternatives to the solvent-based coatings. These products of Covestro are specialized in applications in both the spray and the roll-coat systems, and the launch aligns with the wider industry trends towards energy conservation and green formulation.
- Report ID: 3887
- Published Date: Oct 07, 2025
- Report Format: PDF, PPT
- Explore a preview of key market trends and insights
- Review sample data tables and segment breakdowns
- Experience the quality of our visual data representations
- Evaluate our report structure and research methodology
- Get a glimpse of competitive landscape analysis
- Understand how regional forecasts are presented
- Assess the depth of company profiling and benchmarking
- Preview how actionable insights can support your strategy
Explore real data and analysis
Frequently Asked Questions (FAQ)
Waterborne Coating Market Report Scope
Free Sample includes current and historical market size, growth trends, regional charts & tables, company profiles, segment-wise forecasts, and more.
Connect with our Expert


Copyright @ 2026 Research Nester. All Rights Reserved.
