Trichlorosilane Market Outlook:
Trichlorosilane Market size was valued at USD 6.8 billion in 2025 and is projected to reach USD 20.9 billion by the end of 2035, rising at a CAGR of 9.4% during the forecast period, i.e., 2026-2035. In 2026, the industry size of trichlorosilane is evaluated at USD 7.6 billion.
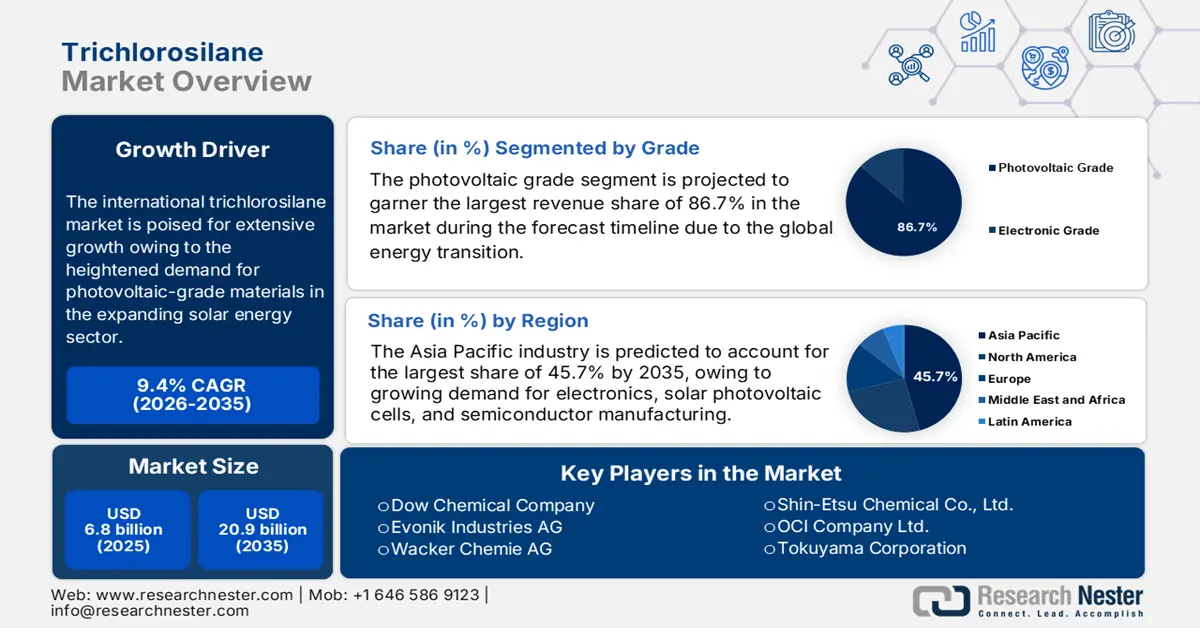
The international market is poised for extensive growth owing to the heightened demand for photovoltaic-grade materials in the expanding solar energy sector. Also, the escalating efforts for more clean and sustainable energy intensify the need for high-purity trichlorosilane, essential in solar panel manufacturing, which also continues to rise. SEIA in September 2025 reported that solar accounted for 56% of all new electricity-generating capacity added to the U.S. grid in the first half of 2025, wherein the solar and storage combined made up 82% of new capacity. Texas led in installations, which were closely followed by California, Indiana, and Arizona.
Furthermore, the existence of supportive government initiatives and large-scale investments in clean energy infrastructure is appreciably accelerating the adoption of solar technologies across all nations, thereby fueling market expansion. For instance, in April 2021, the U.S. Department of Energy announced six new international initiatives to boost global clean energy innovation, support the Biden Administration’s goals for 100% clean electricity by the end of 2035, and net-zero emissions by 2050. It also stated that key efforts include partnerships with India on renewable deployment, a global consortium to cut power sector emissions, and a forum with major oil and gas producers to develop pragmatic net-zero strategies.
Key Trichlorosilane Market Insights Summary:
Regional Insights:
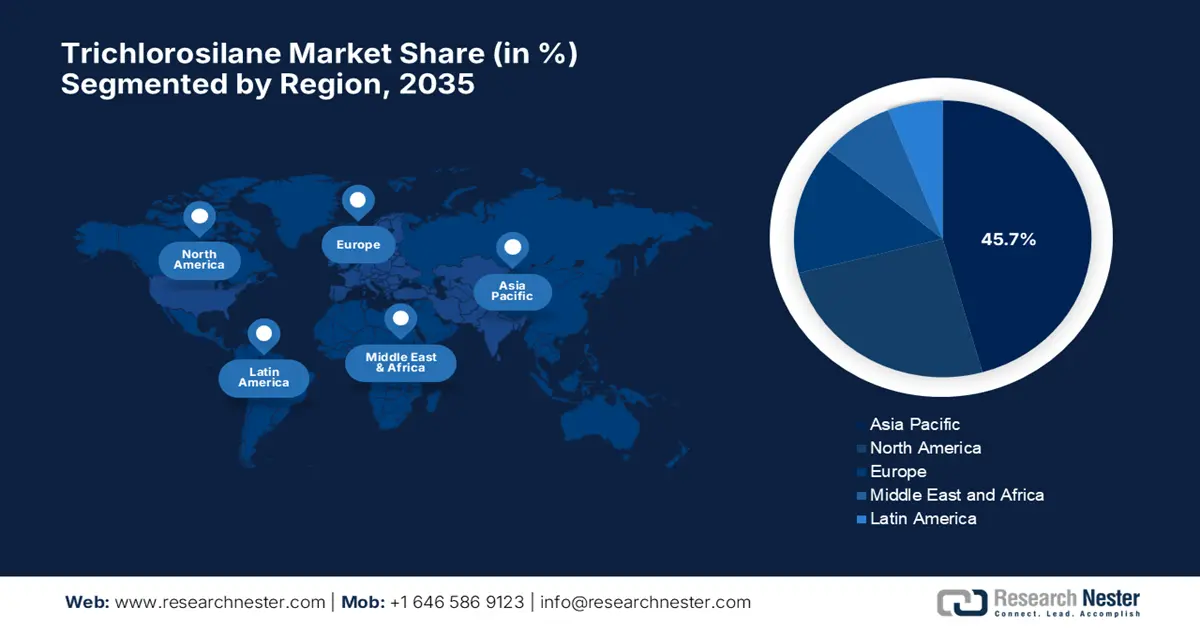
- The Asia Pacific region is expected to lead the Trichlorosilane Market with a 45.7% share by 2035, propelled by rapid industrialization and the growing demand for electronics, solar photovoltaic cells, and semiconductor manufacturing.
- North America is projected to maintain a robust position by 2035, fueled by rising demand for high-purity silicon-based materials and escalating investments in sustainable production methods.
Segment Insights:
- The photovoltaic grade segment of the Trichlorosilane Market is projected to command the largest revenue share of 86.7% by 2035, propelled by the global energy transition and advancements in future power generation.
- The polysilicon for the solar PV segment is anticipated to secure a substantial share by 2035, supported by its extensive utilization across multiple sectors.
Key Growth Trends:
- Rise in semiconductor manufacturing
- Expansion of electronics and consumer goods sector
Major Challenges:
- Environmental compliance costs
- Pricing pressures and market access barriers
Key Players: Dow Chemical Company (U.S.), Evonik Industries AG (Germany), Wacker Chemie AG (Germany), Shin-Etsu Chemical Co., Ltd. (Japan), OCI Company Ltd. (South Korea), Tokuyama Corporation (Japan), Anabond Limited (India), Gelest Inc. (U.S.), Momentive Performance Materials Inc. (U.S.), SiVance, LLC (U.S.), American Elements (U.S.), 3M (U.S.), Linde plc (U.K./Germany), PCC SE (Germany), Schill+Seilacher "Struktol" GmbH (Germany), CHT Group (Germany), Mitsui Chemicals, Inc. (Japan), OCI Company Ltd. Malaysia (Malaysia), OCI Company Ltd. Australia (Australia), Iota Corporation (U.S.).
Global Trichlorosilane Market Forecast and Regional Outlook:
Market Size & Growth Projections:
- 2025 Market Size: USD 6.8 billion
- 2026 Market Size: USD 7.6 billion
- Projected Market Size: USD 20.9 billion by 2035
- Growth Forecasts: 9.4% CAGR (2026-2035)
Key Regional Dynamics:
- Largest Region: Asia Pacific (45.7% Share by 2035)
- Fastest Growing Region: North America
- Dominating Countries: China, Japan, United States, Germany, South Korea
- Emerging Countries: India, Malaysia, Vietnam, Mexico, Poland
Last updated on : 22 October, 2025
Trichlorosilane Market - Growth Drivers and Challenges
Growth Drivers
- Rise in semiconductor manufacturing: Since there has been a rise in integration of electronics in everyday devices and advancements in technologies such as 5G, artificial intelligence, and IoT, the need for ultra-pure silicon wafers has also increased. For instance, in November 2023, Canadian Solar announced the establishment of a 5 GW solar PV wafer manufacturing facility in Chonburi, Thailand, which will initially supply wafers to their existing Thailand TOPCon cell factory and later support their U.S. cell factory in Indiana.
- Expansion of electronics and consumer goods sector: This aspect has increased the consumption of silicon-based components at a notable pace, wherein the emergence of devices such as smartphones, computers, and other electronic gadgets requires silicon-based semiconductors, which are heavily dependent on trichlorosilane as a precursor. In June 2024, onsemi announced a substantial USD 2 billion investment to establish a silicon carbide power semiconductor manufacturing facility in the Czech Republic, which will produce advanced energy-efficient chips for electric vehicles, renewables, and AI data centers.
- Advancements in chemical processing technologies: This has significantly improved the efficiency and purity of trichlorosilane production. Elkem ASA in September 2025 announced a successful proof of concept for a new mechanical recycling process, which focuses on high-consistency rubbers and enables the recycling of crosslinked silicone rubber waste. Hence, such breakthroughs boost production and allow over 50% recycled material reintegration with strong mechanical properties, enabling its support to scalable circular solutions for silicone elastomers.
Strategic Activities Impacting the Silicon and Trichlorosilane Supply Chain
|
Company |
Event |
Significance for Silicon-Based Materials |
Year |
|
Renesas & Wolfspeed |
10-year SiC wafer supply agreement signed |
Shows a shift toward silicon carbide; affects polysilicon trends |
2023 |
|
WACKER |
Announced silicone production expansion |
Involves trichlorosilane use; strengthens the silicone value chain |
2022 |
Source: Company Official Press Releases
Challenges
- Environmental compliance costs: International trichlorosilane producers are facing persistent obstacles in terms of environmental regulation and expenses. In Europe, the REACH regulation by the European Chemicals Agency involves rigorous testing and reporting, ultimately slowing down the market reports, which results in production stoppages, higher operational expenses, and longer innovation periods. Therefore, these environmental compliance requirements restrict market sensitivity, thereby raising the cost of products and restricting market entry.
- Pricing pressures and market access barriers: Global price volatility for this element and trade barriers restrict the market growth. These factors raise the upfront costs and reduce profit margins for the manufacturers, making it challenging for manufacturers to integrate supply chains. Also, the variations in terms of regulations and certification requirements hinder cross-border trade, compelling the producers in this field to comply with multiple production standards and increasing operational overhead. Cumulatively, these market access and price barriers lower global trade adaptability and create hesitation for new investment in manufacturing.
Trichlorosilane Market Size and Forecast:
| Report Attribute | Details |
|---|---|
|
Base Year |
2025 |
|
Forecast Year |
2026-2035 |
|
CAGR |
9.4% |
|
Base Year Market Size (2025) |
USD 6.8 billion |
|
Forecast Year Market Size (2035) |
USD 20.9 billion |
|
Regional Scope |
|
Trichlorosilane Market Segmentation:
Grade Segment Analysis
Based on grade photovoltaic grade segment is projected to garner the largest revenue share of 86.7% during the forecast timeline. The global energy transition, future power generation are the key factors behind the subtype’s dominance. For instance, in June 2025, LONGi and Solar Solutions Group reported that they had signed a strategic cooperation agreement to deliver advanced Back-Contact solar technology across all nations. Therefore, this partnership merges LONGi's innovation with the brand power of Solar Solutions, which markets AEG, Electrolux, and Duracell solar products, hence denoting a wider segment scope.
Application Segment Analysis
In terms of application, the polysilicon for the solar PV segment is expected to attain a lucrative share by the end of 2035, owing to the widespread utilization in different sectors. For instance, in August 2025, Oxford PV, in collaboration with Fraunhofer ISE, launched the world’s most efficient industrial-format solar panel, achieving 25% efficiency using perovskite-on-silicon tandem technology. The firms also underscored that this will surpass the typical 21% to 23% efficiency of standard commercial panels. Also, the record-setting panel produced 421 watts from 1.68 m², using mass-production-ready processes and calibration by CalLab PV Modules.
End user Segment Analysis
Based on end user solar energy segment is anticipated to grow, capturing a considerable share during the analyzed timeframe. The growth in the segment is effectively propelled by the aggressive national policies and solar industry expansion. Besides the growing investments in clean energy under initiatives such as the Inflation Reduction Act of 2022 also drives the progression of this subtype. Furthermore, the increased demand for high-purity trichlorosilane supports expanding solar panel production, coupled with government-backed loan programs, further accelerating solar infrastructure development and technology adoption.
Our in-depth analysis of the global market includes the following segments:
| Segment | Subsegment |
|
Grade |
|
|
Application |
|
|
End user |
|
|
Production Method |
|
|
Distribution Channel |
|

Vishnu Nair
Head - Global Business DevelopmentCustomize this report to your requirements — connect with our consultant for personalized insights and options.
Trichlorosilane Market - Regional Synopsis
APAC Market Insights
The Asia Pacific region is expected to dominate the trichlorosilane market with the largest share of 45.7% by the end of 2035. Rapid industrialization and a growing demand for electronics, solar photovoltaic cells, and semiconductor manufacturing are a few factors driving the adoption of this market in this region. In July 2025, Tokuyama Corporation announced that it had established a joint venture along with OCI TerraSus, called OCI Tokuyama Semiconductor Materials Sdn. Bhd., in Sarawak, Malaysia, to produce semiconductor-grade polycrystalline silicon. Therefore, this move supports growing semiconductor demand with clean-energy-based production, thereby driving upstream demand for key raw materials such as trichlorosilane.
China stands at the forefront of the regional market, effectively propelled by its large-scale solar panel production and semiconductor industries. In December 2022, Daqo New Energy notified that it is expanding its Phase 5B polysilicon project in Inner Mongolia, aiming to boost total production capacity to 305,000 MT. Along with this, the firm is planning to build 300,000 MT of metallurgical silicon capacity to strengthen raw material self-sufficiency. Hence, these expansions are expected to enhance production scale and secure upstream inputs such as trichlorosilane in the polysilicon manufacturing process.
India is also one of the most powerful players in the Asia Pacific’s market, successfully backed by the government policies supporting renewable energy targets and initiatives to boost domestic semiconductor production are key drivers. For instance, in December 2022, Adani Solar introduced the country’s first-ever large-sized monocrystalline silicon ingot at its Mundra facility, marking a major step toward full vertical integration in solar manufacturing. Therefore, this supports the production of high-efficiency PV modules (21% to 24%) and will scale to 10 GW capacity, hence strengthening the country’s self-reliance in the silicon value chain.
Daqo New Energy Corp: Baotou, Inner Mongolia, Polysilicon and Silicon Metal Project Phases and Capacities
|
Phase |
Project Description |
Construction Completed |
Production Start |
Full Capacity Reached |
Annual Capacity (MT) |
|
Phase 5A |
Polysilicon for solar |
Apr 2023 |
Apr 2023 (pilot) |
Jun 2023 |
Increased to 205,000 MT |
|
Phase 5B |
Expansion of 5A |
Expected Q2 2024 |
Q2 2024 (pilot) |
H2 2024 |
Expected 305,000 MT |
|
Semiconductor Polysilicon (1st proj.) |
1,000 MT for semiconductor |
Began Mar 2022 |
Q2 2024 (pilot) |
TBD |
1,000 MT |
|
Future Semiconductor Projects |
Additional semi-grade poly |
Planned |
- |
- |
21,000 MT total planned |
|
Silicon Metal Projects |
Full silicon metal capacity |
Planned |
- |
- |
300,000 MT total planned |
Source: Daqo New Energy Corp
North America Market Insights
North America in the trichlorosilane market is maintaining a strong position backed by the heightened demand for high-purity silicon-based materials, primarily for the semiconductor and solar photovoltaic industries. Besides the advances in renewable energy adoption and semiconductor manufacturing continues to escalate the need for trichlorosilane as a key raw material in producing polysilicon and silicone products. Furthermore, the increasing investments in sustainable production methods are also bolstering upliftment across the region.
The U.S. is augmenting its leadership in the trichlorosilane market since its manufacturers are focusing on innovations that improve the purity and efficiency of silicon precursors to support next-generation electronics and photovoltaic technologies. In January 2025, the U.S. Department of Commerce reported that it had awarded Hemlock Semiconductor up to USD 325 million under the CHIPS Act to build a new facility in Michigan for producing hyper-pure polysilicon. As the only U.S.-owned manufacturer of semiconductor-grade polysilicon, HSC plays a vital role in strengthening domestic chip supply chains, thereby enhancing the demand for trichlorosilane, essential in polysilicon production.
The growing clean technology and semiconductor industries are efficiently stimulating growth in Canada’s trichlorosilane market. The country also benefits from its abundant natural resources and strong industrial base to support the production of high-quality silicon materials. For instance, in April 2025, the Canadian International Trade Tribunal extended its anti-dumping and countervailing duties on silicon metal imports from China, citing ongoing harm to Canada’s domestic industry. Therefore, this decision supports the protection of Canadian producers of high-purity silicon metal, a key material in the supply chain for trichlorosilane and polysilicon production, hence suitable for standard market growth.
Distribution of Major Markets for U.S. Polysilicon Imports: Downstream Demand Indicators (Unit: USD 10,000)
|
Market |
2022 |
2023 |
2024 |
|
Total |
16,970.1 |
11,793.4 |
10,345.4 |
|
Germany |
5,697.1 |
5,385.5 |
5,251.5 |
|
Taiwan, China |
8,514.6 |
3,578.6 |
2,466.6 |
|
Japan |
904.4 |
687.6 |
865.5 |
|
China |
1,634.9 |
1,780.4 |
697.8 |
|
South Korea |
30.7 |
12.4 |
431.5 |
|
Finland |
34.7 |
173.8 |
225.7 |
|
Malaysia |
0.9 |
100.0 |
206.0 |
|
Denmark |
58.1 |
13.9 |
150.1 |
|
Vietnam |
0.0 |
4.9 |
29.4 |
|
Norway |
54.9 |
24.6 |
12.1 |
Source: CCEME
Europe Market Insights
Europe represents a highly influential landscape for the trichlorosilane market, wherein the expansion is facilitated by its strong semiconductor, electronics, and renewable energy sectors. Besides, the increase in in-house production of semiconductors and solar materials is deliberately rising the demand for high-purity silicone precursors. On the other hand, the stringent environmental regulations are appreciably driving innovations in greener manufacturing processes and circular economy initiatives, hence fostering a favorable business environment.
Germany is a leader in chemical manufacturing and advanced engineering, which is efficiently benefiting the trichlorosilane market. The country is proactively making investments in local supply chains for silicon materials. For instance, in July 2025, Wacker Chemie AG notified that it has commissioned its new Etching Line Next at the Burghausen site, marking its largest investment in the past decade to produce ultra-pure semiconductor-grade polysilicon. Further, this expansion will increase production capacity by over 50%, supporting next-generation chip manufacturing for high-tech applications.
The U.K. in the trichlorosilane market is readily blistering growth owing to the government’s focus on boosting high-tech manufacturing and renewable energy adoption. The country also encourages partnerships between industry and academia to foster innovation in silicon chemistry and thereby supports long-term market growth. Brenntag Essentials in August 2024 acquired Monarch Chemicals, which is a leading UK distributor known for its liquid and powder blending facilities. The move strengthens Brenntag’s service capabilities across the country.
Corporate Landscape of the Trichlorosilane Market:
- Dow Chemical Company (U.S.)
- Company Overview
- Business Strategy
- Key Product Offerings
- Financial Performance
- Key Performance Indicators
- Risk Analysis
- Recent Development
- Regional Presence
- SWOT Analysis
- Evonik Industries AG (Germany)
- Wacker Chemie AG (Germany)
- Shin-Etsu Chemical Co., Ltd. (Japan)
- OCI Company Ltd. (South Korea)
- Tokuyama Corporation (Japan)
- Anabond Limited (India)
- Gelest Inc. (U.S.)
- Momentive Performance Materials Inc. (U.S.)
- SiVance, LLC (U.S.)
- American Elements (U.S.)
- 3M (U.S.)
- Linde plc (U.K./Germany)
- PCC SE (Germany)
- Schill+Seilacher "Struktol" GmbH (Germany)
- CHT Group (Germany)
- Mitsui Chemicals, Inc. (Japan)
- OCI Company Ltd. Malaysia (Malaysia)
- OCI Company Ltd. Australia (Australia)
- Iota Corporation (U.S.)
- Dow Chemical Company is the central player in the production of trichlorosilane, which is bolstering the market through large-scale manufacturing and supply chain optimization. Besides, the company’s expertise ensures high-purity trichlorosilane production, which is highly essential for the semiconductor along solar industries, supporting technological innovation, thereby meeting growing industrial demand.
- Wacker Chemie AG also stands out as one of the crucial players in this field, which is currently offering high-quality silicon-based chemical products. The company also drives upliftment in this sector by integrating advanced chemical synthesis techniques and focusing on sustainable manufacturing processes, thereby catering to the needs of electronics, photovoltaic, and chemical sectors as well.
- OCI Company Ltd. is recognized as one of the most prominent forces in the trichlorosilane industry, which is supplying large volumes of the compound essential for polysilicon production. Along with this, the firm’s strategic investments in manufacturing capacity and logistics infrastructure have strengthened regional market accessibility, enabling a highly enhanced support for solar energy and semiconductor industries.
- Shin-Etsu Chemical Co., Ltd. has established a benchmark for its chemical solutions, which also includes a high-purity trichlorosilane; the firm is productively amplifying through its continuous innovation in refining processes and stringent quality control. The organization’s capability in desired performance for silicon wafer production is readily enabling advancements in electronics and renewable energy sectors.
- Mitsui Chemicals, Inc. has significantly contributed to the global industry expansion in recent years by delivering reliable and consistent products that are tailored to numerous industrial applications. Besides, their commitment to research and development has fostered great improvements in chemical stability and environmental compliance, thus supporting sustainable growth in semiconductor and photovoltaic manufacturing.
Here is a list of key players operating in the global market:
The global trichlorosilane market is extremely competitive, which is led by the pioneers such as Wacker Chemie AG, Shin-Etsu Chemical, and OCI Company Ltd., who dominate through large-scale production and advanced purification technologies. Besides, these firms are also readily making investments in expanding capacity and improving product purity to serve the growing demands in the semiconductor as well as photovoltaic sectors. In October 2024, Evonik announced the expansion of its precipitated silica production capacity by 50% at its Charleston, South Carolina, site, majorly influenced by the strong demand from the U.S. tire industry, especially for green tires.
Corporate Landscape of the Trichlorosilane Market:
Recent Developments
- In October 2025, WACKER showcased its high-tech silicones at K 2025, highlighting innovations for energy, electromobility, digitalization, and sustainability. Key products include POWERSIL 1900 A/B, which is for cost-effective hollow-core insulators, and ELASTOSIL R 531/60, a fire-protective busbar insulation for EV batteries
- In January 2025, Evonik announced the launch of its Smart Effects, merging its Silica and Silanes business lines to enhance solutions across automotive, electronics, and sustainability sectors, wherein it aims to deliver innovative, circular technologies.
- Report ID: 7852
- Published Date: Oct 22, 2025
- Report Format: PDF, PPT
- Explore a preview of key market trends and insights
- Review sample data tables and segment breakdowns
- Experience the quality of our visual data representations
- Evaluate our report structure and research methodology
- Get a glimpse of competitive landscape analysis
- Understand how regional forecasts are presented
- Assess the depth of company profiling and benchmarking
- Preview how actionable insights can support your strategy
Explore real data and analysis
Frequently Asked Questions (FAQ)
About this Report
Connect with our Expert

Report, 2026-2035


Copyright @ 2026 Research Nester. All Rights Reserved.
