Advanced Ceramics Market Outlook:
Advanced Ceramics Market size was valued at USD 118.36 billion in 2025 and is expected to reach USD 235.02 billion by 2035, registering around 7.1% CAGR during the forecast period i.e., between 2026-2035. In the year 2026, the industry size of advanced ceramics is evaluated at USD 125.92 billion.
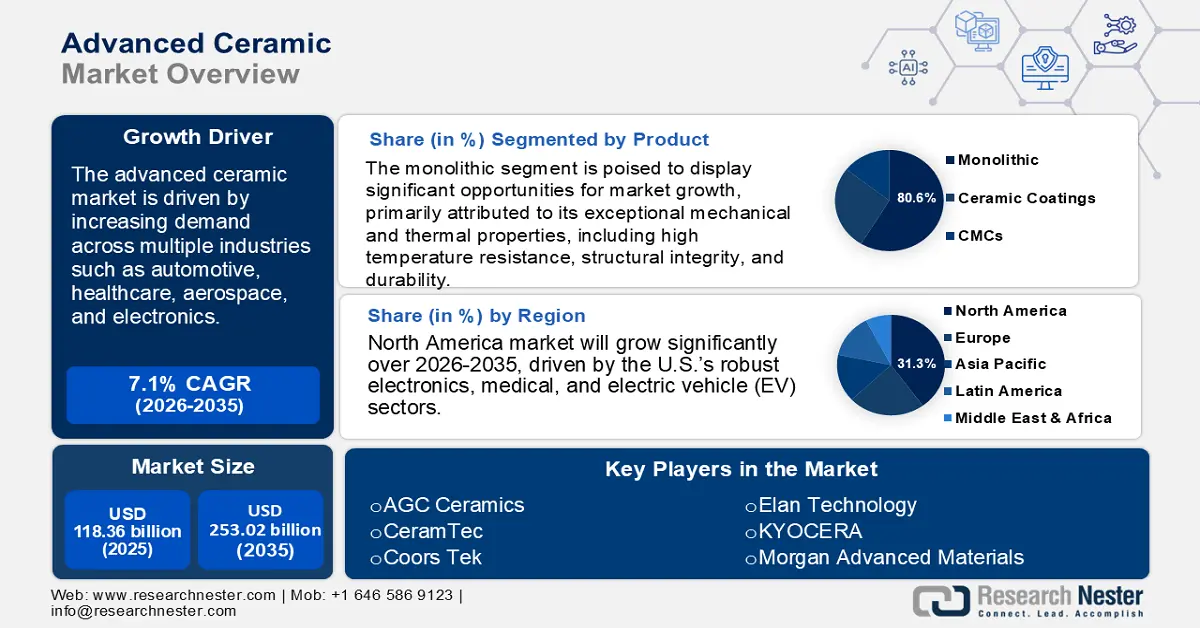
The advanced ceramics market is witnessing strong growth, driven by increasing demand across multiple industries such as automotive, healthcare, aerospace, and electronics. These ceramics offer superior mechanical, thermal, and electrical properties, including high-temperature resistance, wear durability, and biocompatibility, making them essential in high-performance applications. In the automotive sector, advanced ceramics are utilized in engine components, braking systems, and exhaust assemblies due to their ability to withstand extreme conditions. With the rise of electric vehicles (EVs), their use is expanding into battery technologies and power electronics, further bolstering market growth.
In the healthcare industry, the aging global population and increasing demand for durable, biocompatible materials are fueling the adoption of ceramics in dental implants, prosthetics, and joint replacements. These materials closely mimic natural bone properties, improving patient outcomes and extending device longevity. Electronics remains a significant market driver, where advanced ceramics are vital in the production of capacitors, insulators, and sensors. Their excellent dielectric properties and thermal stability support the miniaturization and performance requirements of modern electronic devices like smartphones and laptops.
MO SCI crop acquired 3M’s advanced materials division in February 2023, enhancing its technical capabilities by integrating over 350 specialized equipment and intellectual property. Similarly, XJet Ltd. introduced commercial alumina ceramic parts in August 2023 using its NanoParticles Jetting technology, reflecting material innovation. The Midlands Industrial Ceramics in the UK has successfully secured USD 22.8 million. In July 2021 to accelerate ceramic technology research, highlighting regional investment in transformative ceramic applications.
Key Advanced Ceramics Market Insights Summary:
Regional Highlights:
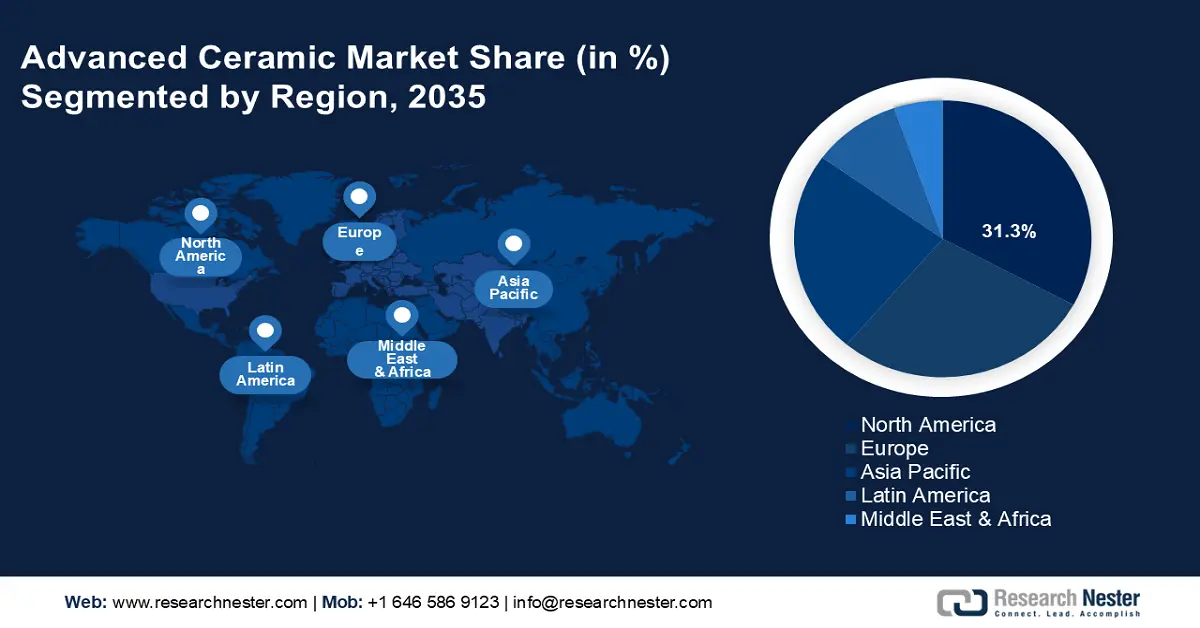
- The North America advanced ceramics market is forecasted to achieve a 31.30% share by 2035, driven by robust electronics, medical, and electric vehicle sectors boosting demand for advanced ceramics.
Segment Insights:
- The monolithic segment in the advanced ceramics market, holding an 80.60% share, is poised for substantial growth by 2026-2035, driven by its exceptional mechanical and thermal properties ideal for electronics and automotive use.
- The electrical & electronic sector segment in the advanced ceramics market is expected to maintain a considerable share by 2035, supported by unique properties like superconductivity and piezoelectricity.
Key Growth Trends:
- Rising need from electronics and medical industries
- Defense & Aerospace Applications
Major Challenges:
- Rising need from electronics and medical industries
- Defense & Aerospace Applications
Key Players: AGC Ceramics Co., Ltd., CeramTec GmbH, CoorsTek Inc., Elan Technology, Morgan Advanced Materials, Murata Manufacturing Co., Ltd., Nishimura Advanced Ceramics Co., Ltd., Ortech Advanced Ceramics, Saint-Gobain.
Global Advanced Ceramics Market Forecast and Regional Outlook:
Market Size & Growth Projections:
- 2025 Market Size: USD 118.36 billion
- 2026 Market Size: USD 125.92 billion
- Projected Market Size: USD 235.02 billion by 2035
- Growth Forecasts: 7.1% CAGR (2026-2035)
Key Regional Dynamics:
- Largest Region: North America (31.3% Share by 2035)
- Fastest Growing Region: Asia Pacific
- Dominating Countries: China, United States, Japan, Germany, India
- Emerging Countries: China, Japan, South Korea, India, Singapore
Last updated on : 8 September, 2025
Advanced Ceramics Market Growth Drivers and Challenges:
Growth Drivers
- Rising need from electronics and medical industries: There is a notable surge for advanced ceramics in the medical industry due to their exceptional biocompatibility, chemical inertness, and resistance to high temperatures and wear. These materials are increasingly utilized in critical applications such as orthopedic implants, dental restorations, pacemakers, drug delivery devices, and surgical tools. Their ability to perform reliably in harsh biological environments without causing adverse reactions makes them indispensable in modern medical technology. In dentistry, advanced ceramics provide aesthetic appeal and durability, mimicking natural teeth and enhancing patient outcomes.
The global aging population and rise in chronic disease continue to fuel this demand, prompting manufacturers to expand their specialized ceramic offerings tailored to medical needs. Morgan Advanced Materials, a leading player in the advanced ceramics market, exemplifies innovation in this space. The company develops a wide range of bioceramics for orthopedic and dental use, offering components that meet stringent regulatory standards and deliver high performance in clinical applications. Their ongoing research and development investment underscores the growing importance of ceramics in healthcare advancement.
- Defense & Aerospace Applications: Advanced ceramics play a critical role in the defense and aerospace sectors due to their exceptional mechanical strength, lightweight nature, and ability to withstand extreme temperatures. These properties make them ideal for use in ballistic armor, where ceramic plates are integrated into body armor and vehicle protection systems to absorb and dissipate impact energy effectively. In aerospace applications, advanced ceramics are utilized in heat shields, engine components, and radar systems due to their high thermal resistance, electrical insulation, and durability under stress. Their use enhances performance, safety, and fuel efficiency in both military and commercial aviation sectors.
A notable instance is CoorsTek Inc., the U.S.-based company known for its high-performance ceramic components used in military armor and aerospace systems. CoorsTek provides ceramic armor for the protection of personnel and aircraft components designed for harsh conditions, highlighting the critical role of advanced ceramics in contemporary defense technologies and aerospace advancements.
Challenges
- Brittleness & design limitations: Although ceramics are strong under compression, they are brittle and can fracture under tensile stress or impact, limiting their use in dynamic environments unless carefully engineered. This fragility limits their direct application in dynamic environments such as automotive, aerospace, and structural components, where materials are routinely subjected to varying loads and vibrations. To overcome these limitations, engineers must employ meticulously designed strategies, such as incorporating composite reinforcements, optimizing component geometry, or using hybrid materials that combine the benefits of ceramics with metals or polymers.
Additionally, specialized processing techniques like hot isostatic pressing or toughening additives are being explored to enhance fracture resistance. While their excellent thermal, wear, and corrosion resistance make advanced ceramics desirable, their brittleness requires careful engineering consideration to ensure safety and performance, especially in high-stress or high-impact industrial applications.
- Material standardization issues: The lack of consistent material standards across applications and industries can hinder widespread adoption and interoperability. The absence of universally accepted standards for ceramic materials encompassing composition, processing methods, mechanical properties, and performance metrics creates an inconsistency in quality, reliability, and interoperability. This variability complicates material selection for engineers and manufacturers, especially in sectors requiring high precision, such as aerospace, medical devices, and electronics. Without clear benchmarks, product validation, regulatory compliance, and cross-industry integration become time-consuming and cost-intensive. Additionally, inconsistent standards can lead to challenges in global supply chains, affecting procurement and scalability.
Advanced Ceramics Market Size and Forecast:
| Report Attribute | Details |
|---|---|
|
Base Year |
2025 |
|
Forecast Period |
2026-2035 |
|
CAGR |
7.1% |
|
Base Year Market Size (2025) |
USD 118.36 billion |
|
Forecast Year Market Size (2035) |
USD 235.02 billion |
|
Regional Scope |
|
Advanced Ceramics Market Segmentation:
Products Segment Analysis
The monolithic segment in advanced ceramics market is predicted to gain the largest revenue share of 80.6% during the projected period in 2035. This dominance is primarily attributed to its exceptional mechanical and thermal properties, including high temperature resistance, structural integrity, and durability. These features make monolithic ceramics indispensable in high-performance applications across the electronics and automotive industries. In electronic devices, they serve as insulators, substrates, and capacitors, enhancing reliability and efficiency. In automotive systems, they are utilized in engine components, sensors, and exhaust systems to improve longevity and performance under harsh conditions.
One notable instance is Maruwa Co., Ltd., a Japanese firm with a rich history in fine porcelain manufacturing. In recent years, Maruwa has strategically transitioned into producing specialized ceramics for the technology sector, capitalizing on its expertise to meet the growing demand for high-performance materials. The company’s advanced ceramic components are integral to electronic devices and vehicles, offering exceptional high-temperature resistance, reliability, and durability. These properties enhance the performance and longevity of end products, making Maruwa a key player in the monolithic ceramics market.
End use Segment Analysis
The electrical and electronic sector constitutes the most significant end use segment in the advanced ceramics market, commanding a considerable portion of total revenue by the year 2035. This dominance is driven by the unique properties of advanced ceramics such as superconductivity, semiconductivity, piezoelectricity, and magnetism, which make them indispensable for a wide array of electronic components. This encompasses inductors, spark plugs, capacitors, semiconductor substrates, resistors, and circuit protection devices. The increasing miniaturization of electronic devices, rising demand for high-performance components, and ongoing advancements in 5G, IoT, and AI technologies further propel market growth.
A notable instance is Murata Manufacturing Co., Ltd., a leading Japanese electronics company, which is a prominent player in the advanced ceramics market for electrical and electronics applications. Murata specializes in ceramic-based components such as capacitors, filters, and sensors. These products are essential for smartphones, automotive electronics, and IoT devices, offering superior miniaturization, thermal stability, and performance in high-frequency environments.
Our in-depth analysis of the global market includes the following segments:
|
Product |
|
|
End use |
|
|
Application |
|
|
Material |
|

Vishnu Nair
Head - Global Business DevelopmentCustomize this report to your requirements — connect with our consultant for personalized insights and options.
Advanced Ceramics Market Regional Analysis:
North America Market Insights
North America’s advanced ceramics market is poised to hold a 31.3% share by the end of 2035, with the U.S. leading growth due to its robust electronics, medical, and electric vehicle (EV) sectors. The increasing demand for high-performance semiconductors is critical for ultra-high frequency signal transmission, and enhanced connectivity is a key driver in the region. Furthermore, technological advancements and a surge in applications across healthcare devices and EV components, where durability, thermal resistance, and miniaturization are essential.
Canada also contributes to the regional advanced ceramics market growth, with expanding investments in healthcare infrastructure and sustainable transportation, fueling the demand for biocompatible and high-efficiency ceramic components. For instance, CeramTec GmbH, though headquartered in Germany, has a strong presence in North America, supplying advanced ceramic components for the medical, automotive, and electronics industries. The company is known for its biocompatible ceramics used in joint replacements and piezoceramics for sensors and actuators, supporting high-performance applications across critical U.S. markets.
Europe Market Insights
The European region is expected to secure a substantial share of the global advanced ceramics market during the forecast period. Germany and the UK play a pivotal role in the growth of the market in Europe, driven by technological innovation, regulatory frameworks, and diverse industrial applications. Germany stands out due to its strong manufacturing base and leadership in automotive engineering. Advanced ceramics are increasingly used in German automotive applications, such as engine components, exhaust systems, and braking technologies, due to their high thermal stability, strength, and lightweight properties. Germany’s commitment to renewable energy and sustainability further propels the integration of ceramics in environmental and energy-efficient technologies.
The UK market also demonstrates strong potential, especially in the medical and aerospace sectors. British industries increasingly adopt advanced ceramics for their biocompatibility and resistance to extreme environments, aligning with the country’s emphasis on high-performance, sustainable solutions. NGK Spark Plug Europe GmbH, with operations in both Germany and the UK, exemplifies industry leadership. The company supplies advanced technical ceramics for automotive and industrial applications, supporting innovation and environmental compliance across both nations’ high-tech sectors.
Advanced Ceramics Market Players:
- 3M
- Company Overview
- Business Strategy
- Key Product Offerings
- Financial Performance
- Key Performance Indicators
- Risk Analysis
- Recent Development
- Regional Presence
- SWOT Analysis
- AGC Ceramics Co., Ltd.
- CeramTec GmbH
- NGK Spark Plug Europe GmbH
- CoorsTek Inc.
- Rauschert Steinbach GmbH (Germany)
- Elan Technology
- Morgan Advanced Materials
- Nishimura Advanced Ceramics Co., Ltd.
- Ortech Advanced Ceramics
- Saint-Gobain
Key players in the advanced ceramic market leverage technologies such as precision sintering, nanostructuring, and additive manufacturing to enhance performance, reduce material defects, and customize complex components. These innovations enable superior mechanical, thermal, and electrical properties, positioning companies at the forefront of high-demand sectors like electronics, aerospace, and healthcare.
Recent Developments
- In February 2023, MO SCI Corp. finalized the acquisition of 3M's advanced materials division. This strategic decision involves the transfer of over 350 specialized pieces of equipment along with related intellectual property. By the conclusion of the fourth quarter of 2023, all acquired assets, including both equipment and technology, will be completely integrated and functional at MO SCI Corp.
- In June 2022, CoorsTek invested over USD 50 million to develop a state-of-the-art advanced materials manufacturing campus covering 230,000 square feet. This strategic initiative is designed to foster innovation across various markets. The expansion signifies a significant commitment by CoorsTek to improve its Benton facility, representing a crucial milestone in the company's sustained long-term investment strategy in Arkansas.
- Report ID: 977
- Published Date: Sep 08, 2025
- Report Format: PDF, PPT
- Explore a preview of key market trends and insights
- Review sample data tables and segment breakdowns
- Experience the quality of our visual data representations
- Evaluate our report structure and research methodology
- Get a glimpse of competitive landscape analysis
- Understand how regional forecasts are presented
- Assess the depth of company profiling and benchmarking
- Preview how actionable insights can support your strategy
Explore real data and analysis
Frequently Asked Questions (FAQ)
Advanced Ceramics Market Report Scope
Free Sample includes current and historical market size, growth trends, regional charts & tables, company profiles, segment-wise forecasts, and more.
Connect with our Expert


Copyright @ 2026 Research Nester. All Rights Reserved.
