Tableau Services Market Outlook:
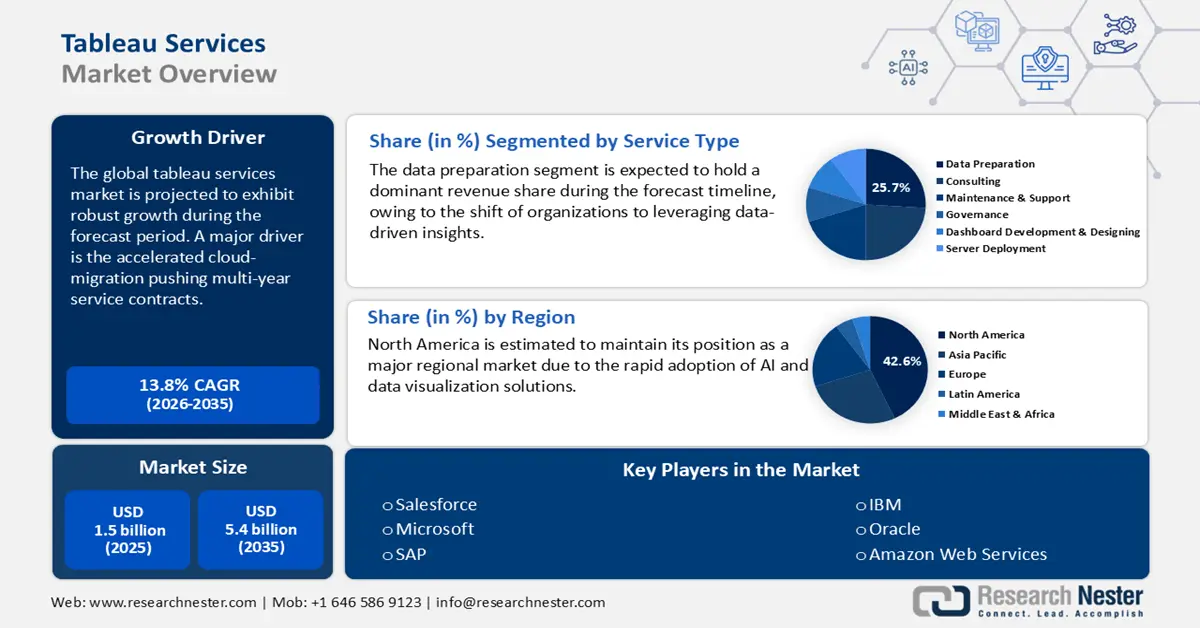
Tableau Services Market size was USD 1.5 billion in 2025 and is estimated to reach USD 5.4 billion by the end of 2035, expanding at a CAGR of 13.8% during the forecast period 2026-2035. In 2026, the industry size of tableau services is estimated at USD 1.7 billion.
The ongoing digital transformation initiatives are estimated to fuel the sales of tableau solutions in the years ahead. Many industries moving towards data-centered strategies are making the market more competitive. According to the International Trade Administration’s (ITU) report, Qatar’s Ministry of Communications and Information Technology (MCIT) is guiding its country through introducing the National Digital Agenda 2030. This is focused on expanding the country’s digital economy through advanced technologies, sustainability initiatives, and economic diversification. Thus, the robust shift towards digitalization across the globe is set to accelerate the demand for tableau services in the coming years.
The U.S. General Services Administration revealed that in October 2024, the Technology Modernization Fund’s (IMF) latest round of investments totaled USD 50.2 million. This is set to modernize critical services across 2 federal organizations. The hefty public investments in technology upgradations are also expected to open lucrative doors for tableau service providers during the study period.
Key Tableau Services Market Insights Summary:
Regional Highlights:
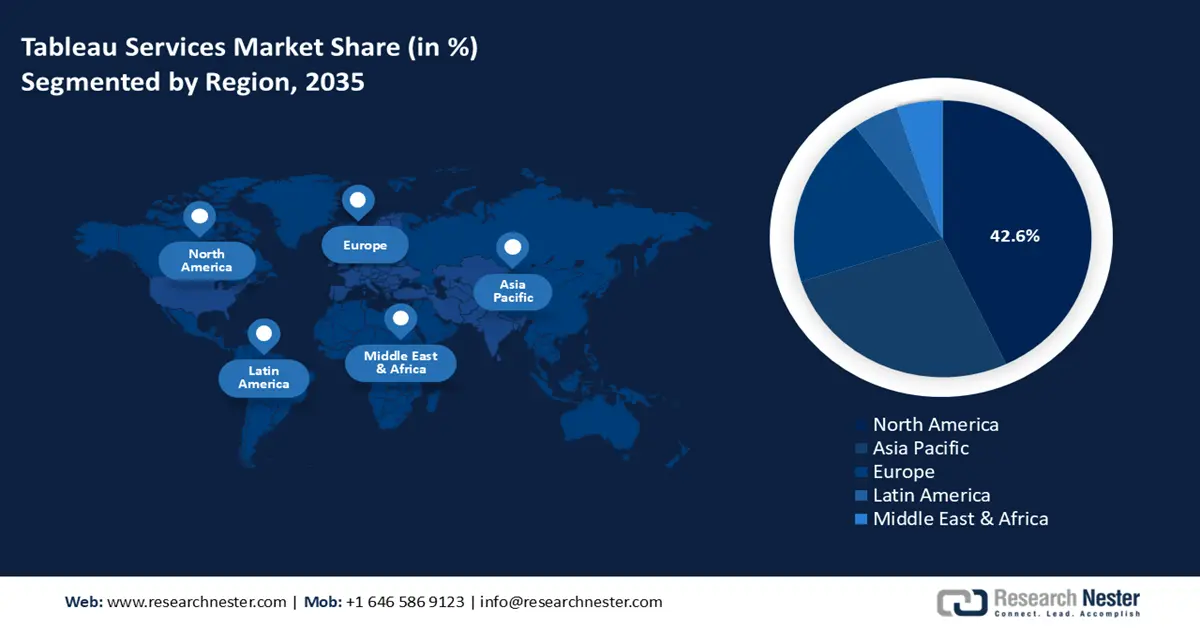
- North America tableau services market is projected to command a 42.6% revenue share by 2035, owing to the strong adoption of cloud-based analytics and AI-driven data visualization solutions.
- Asia Pacific market is estimated to witness a CAGR of 14% during 2026-2035, supported by increasing investments in smart manufacturing, IoT, and AI-enabled analytics solutions.
Segment Insights:
- The data preparation segment of the tableau services market is projected to account for a 25.7% revenue share during 2026-2035, propelled by the growing organizational shift toward data-driven insights and the integration of AI & ML into data workflows.
- The large enterprises segment is anticipated to hold a dominant 65.4% share by 2035, fueled by extensive adoption of Tableau’s analytics tools among corporations seeking to strengthen data-driven decision-making.
Key Growth Trends:
- Accelerated cloud migration driving multi-year service contracts
- Vertical-specific demand surge from manufacturing, healthcare, and BFSI
Major Challenges:
- Integration with legacy systems
- Competition from alternatives
Key Players: Salesforce, Microsoft, SAP, IBM, Oracle, Google Cloud, Amazon Web Services, Tableau (Salesforce), Domo, Qlik, Teradata, MicroStrategy, Hitachi Vantara, Tata Consultancy Services (TCS), SoftBank.
Global Tableau Services Market Forecast and Regional Outlook:
Market Size & Growth Projections:
- 2025 Market Size: USD 1.5 billion
- 2026 Market Size: USD 1.7 billion
- Projected Market Size: USD 5.4 billion by 2035
- Growth Forecasts: 13.8% CAGR (2026-2035)
Key Regional Dynamics:
- Largest Region: North America (42.6% Share by 2035)
- Fastest Growing Region: Asia Pacific
- Dominating Countries: United States, Germany, United Kingdom, China, Japan
- Emerging Countries: India, South Korea, Singapore, Australia, Brazil
Last updated on : 26 September, 2025
Tableau Services Market - Growth Drivers and Challenges
Growth Drivers
- Accelerated cloud migration driving multi-year service contracts: The heightened enterprise migration to cloud platforms due to the post-pandemic digital mandates has reshaped analytics implementation models. The report by Nextwork discloses that the end-user spending on cloud services reached USD 723.4 billion in 2025. This trend has been a direct contributor to the surge in demand for tableau services in cloud-native environments. Companies that are adopting AWS, Snowflake, and Azure are integrating tableau in digital journeys. Additionally, the higher rate of adoption has compounded the growth vector for the service ecosystem.
- Vertical-specific demand surge from manufacturing, healthcare, and BFSI: The expansion in tableau services is being disproportionately driven by data-intensive sectors, such as manufacturing, healthcare, and BFSI. In manufacturing, nearly half of new tableau service engagements involved integration with IoT and MES systems. Additionally, AI-led diagnostics have triggered complex visual workflows built on tableau, and the shift toward vertical-specific use cases has bolstered the total contract values and deepened implementation complexity.
- Technological advancements: The tableau services market is influenced by technological innovations, improving the analysis and interpretation of data. Key trends include the integration of AI-driven analytics and the rapid adoption of blockchain technology. Since tableau integrates seamlessly with industrial IoT platforms, manufacturers have experienced efficiency gains. Additionally, industries such as telecom and banking are increasingly relying on cloud-scale BI architecture, doubling the revenues of key players.
Challenges
- Integration with legacy systems: A major issue consistently plaguing the vendors offering tableau services is the difficulty in integration with existing legacy systems. For instance, the large enterprises are particularly reliant on older data management systems that tend to be incompatible with modern tableau deployments. The use of outdated databases creates a lack of flexibility in integration with tableau’s advanced data analytics.
- Competition from alternatives: The easy availability of alternative solutions such as Microsoft Power BI, Qlik, and Google Looker is emerging as an intense competitor for tableau service providers. The prime factor is the high price, similar to advanced features. Thus, small and new companies are expected to be majorly challenged by the strong presence of alternatives.
Tableau Services Market Size and Forecast:
| Report Attribute | Details |
|---|---|
|
Base Year |
2025 |
|
Forecast Year |
2026-2035 |
|
CAGR |
13.8% |
|
Base Year Market Size (2025) |
USD 1.5 billion |
|
Forecast Year Market Size (2035) |
USD 5.4 billion |
|
Regional Scope |
|
Tableau Services Market Segmentation:
Service Type Segment Analysis
The data preparation segment is poised to register a leading revenue share of 25.7% during the forecast period. A major factor in the segment’s expansion is the trend of organizations shifting to data-driven insights. The opportunities are expected to be rife in sectors dealing with sensitive data, such as the financial and healthcare sectors. Additionally, the rapid integration of AI & ML into data pipelines has positively reinforced demand. Also, the deployment of AI-powered data preparation solutions effectively reduces the manual data cleansing tasks by a higher percentage.
Organization Segment Analysis
Large enterprises are set to offer the most significant deployment opportunities for tableau services during the anticipated timeline. The large enterprises segment is poised to hold 65.4% of the global market share by 2035. A key example is the integration of Tableau’s advanced analytics tools by General Electric (GE) across its global operations to bolster the data-driven decision-making abilities. With large corporations seeking to expand their revenue share in their respective verticals, the segment is slated to remain at the forefront of providing significant opportunities for vendors.
Industry Segment Analysis
The manufacturing segment is estimated to account for the largest market share throughout the study period. Manufacturing organizations create massive volumes of structured and unstructured data, which accelerates the demand for advanced tableau solutions. Many manufacturers are also under constant pressure to enhance operational efficiency and minimize downtime, which contributes to the increasing sales of tableau tools. The rising adoption of Industry 4.0 practices, including predictive maintenance, smart factories, and digital twins, is further opening a lucrative environment for tableau service providers.
Our in-depth analysis of the global tableau services market includes the following segments:
|
Segment |
Subsegments |
|
Service Type |
|
|
Organization |
|
|
Deployment Mode |
|
|
Industry Vertical |
|

Vishnu Nair
Head - Global Business DevelopmentCustomize this report to your requirements — connect with our consultant for personalized insights and options.
Tableau Services Market - Regional Analysis
North America Market Insights
North America market is poised to hold a leading revenue share of 42.6% by the end of 2035. Due to the widespread adoption of cloud-based analytics and AI-powered data visualizations, the regional market remains at the forefront of lucrativeness for vendors providing tableau services. Additionally, the regulatory ecosystem in the region has had a positive impact on the market’s expansion, with the California Consumer Privacy Act (CCPA) contributing favorably to the rising demand for data governance solutions.
The U.S. tableau services market is poised to maintain a major revenue share during the anticipated timeline. A key driver of the market is the rising adoption of tableau services across large enterprises and SMEs. The nationwide digitalization has created ample opportunities for vendors providing tableau services. Additionally, the market has benefited from the early adoption of AI-backed solutions, creating a heightened requirement for data analytics in numerous sectors. The maturation of 5G infrastructure is also projected to drive tableau’s adoption in sectors such as telecom for improved analytics.
The demand for tableau services in Canada is projected to increase at a robust pace due to the increasing digital transformation initiatives. The government incentives promoting analytics adoption are contributing to the market growth. The strong presence of key players is also creating a profitable space in the country. The increasing collaboration with local IT and cloud partners is poised to fuel the expansion of tableau services.
Asia Pacific Market Insights
Asia Pacific market is set to expand at a CAGR of 14% during the forecast period, cementing its status as the fastest-expanding regional market. Trends in the region indicate intensifying investment trends in smart manufacturing, AI-backed analytics, and IoT technologies. In terms of successful use cases by major players in APAC, Tata Consultancy Services has utilized data preparation capabilities to bolster supply chain management. Additionally, economies in APAC have exhibited a push for data sovereignty laws, driving opportunities for providing data governance solutions.
China market is estimated to maintain a considerably large revenue share in APAC. Due to the rising adoption of tableau services bolstered by the digital transformation initiatives, the China market is poised to maintain its growth throughout the study period. Moreover, there have been considerable investments in smart cities, creating a segment where the demand for data analytics has skyrocketed, and creating lucrative opportunities for vendors to provide tableau services.
India market is estimated to increase at a high pace from 2026 to 2035, owing to the growing demand for analytics-enabled decision-making across industries. The rapid digital transformation and cloud adoption in both public & private sectors are also contributing to the market growth. The report by the India Brand Equity Foundation (IBEF) estimates that the country’s Fintech industry is estimated to cross USD 421 billion by 2029. BFSI institutions are increasingly investing in tableau solutions to enhance overall operational efficiency.
Europe Market Insights
Europe market is slated to register robust growth during the anticipated timeline. The market is favorably impacted by the rising data visualization and the proliferation of business intelligence tools across various sectors. A major driver of the regional market is the growing emphasis by the European Union on greater digitalization as a part of the Digital Europe program. Additionally, strict regulatory frameworks such as the General Data Protection Regulations (GDPR) have continued to shape the demand for data visualization in the region.
Germany market is poised to expand at a high pace during the forecast period, due to a deep-rooted emphasis on data-driven decision-making, which has ensured sustained adoption of tableau services solutions. In the industrial sector, the improvements in precision engineering have contributed to the greater adoption of data visualization tools such as tableau. The Digital Strategy 2025 plan of Germany is another major driver of the market, due to its emphasis on the importance of leveraging big data.
The U.K. market for tableau services is growing as many businesses are using cloud technologies and investing in data analytics. The country’s strong IT systems and many skilled data professionals are also increasing the need for tableau services, while government rules such as GDPR are boosting demand for clear and secure reporting tools. Further, strategic partnerships with cloud providers and AI-focused platforms are accelerating market penetration.
Key Tableau Services Market Players:
- Salesforce
- Company Overview
- Business Strategy
- Key Product Offerings
- Financial Performance
- Key Performance Indicators
- Risk Analysis
- Recent Development
- Regional Presence
- SWOT Analysis
- Microsoft
- SAP
- IBM
- Oracle
- Google Cloud
- Amazon Web Services
- Tableau (Salesforce)
- Domo
- Qlik
- Teradata
- MicroStrategy
- Hitachi Vantara
- Tata Consultancy Services (TCS)
- SoftBank
The tableau services market is slated to reach maturity by the end of 2035. The market remains competitive with the presence of major players such as Microsoft, Salesforce, and SAP. Additionally, opportunities are rife for companies in emerging economies to leverage the skilled workforce and offer low-cost tableau services to large enterprises.
Here is a list of key players operating in the market:
Recent Developments
- In April 2025, Salesforce introduced Tableau Next, a new tool that makes business intelligence easier. The AI agents help companies turn data into actions more effectively.
- In February 2024, Tableau announced the launch of Tableau Pulse. The enhanced version offers intelligent, personalized, and contextual insights.
- Report ID: 3815
- Published Date: Sep 26, 2025
- Report Format: PDF, PPT
- Explore a preview of key market trends and insights
- Review sample data tables and segment breakdowns
- Experience the quality of our visual data representations
- Evaluate our report structure and research methodology
- Get a glimpse of competitive landscape analysis
- Understand how regional forecasts are presented
- Assess the depth of company profiling and benchmarking
- Preview how actionable insights can support your strategy
Explore real data and analysis
Frequently Asked Questions (FAQ)
Tableau Services Market Report Scope
Free Sample includes current and historical market size, growth trends, regional charts & tables, company profiles, segment-wise forecasts, and more.
Connect with our Expert


Copyright @ 2026 Research Nester. All Rights Reserved.
