- An Outline of the Submarine Power Cable Market
- Market Definition & Segmentation
- Assumptions and Abbreviations
- Research Methodology & Approach
- Primary Research
- Secondary Research
- Data Triangulation
- SPSS Methodology
- Executive Summary
- Submarine Power Cable Market: Historic Pricing & Market Analysis (2026–2037)
- Detailed Cost Structure Breakdown and Influencing Factors for Offshore Submarine Cables
- Navigating Global
- Japan Offshore Wind Cable Architecture – Project-Level Evidence
- HVDC Projects in Japan – Grid Interconnectors Overview
- Precision in Power: Decoding Japan’s Offshore Cable Dynamics for Future-Ready Wind Projects.
- Submarine Power Cable Market – Key Global & Japanese Suppliers
- Growth Drivers
- Major Roadblocks
- Opportunities
- Prevalent Trends
- Regulatory Framework
- Technological Advancements
- Up-Coming Technologies
- Growth Outlook
- Risk Analysis
- Pricing Benchmarking
- Supply Chain
- Regional Demand
- Recent News
- EXIM
- Type Analysis
- Growth Forecast of Submarine Power Cable Market
- Solutions and Strategic Adjustments for Overcoming Challenges
- Root Cause Analysis (RCA) for discovering problems of the Submarine Power Cable Market
- Application Overview
- Customer Requirements
- Key Stake Holder Analysis
- Comparative Positioning
- Porter Five Forces
- PESTLE
- Competitor SWOT Analysis
- Competitive Landscape: Key Players
- Competitive Model: A Detailed Inside View for Investors
- Market Share of Major Companies Profiled, 2024
- Business Profiles of Key Enterprises
- FURUKAWA ELECTRIC CO., LTD.
- Hellenic Cables
- HENGTONG GROUP CO.,LTD.
- LS Corp. (LS Cable & System Ltd.)
- Nexans
- NKT A/S
- Prysmian S.p.A.
- Sumitomo Electric Industries, Ltd.
- TFKable (JDR Cable Systems Ltd.)
- Tratos
- XLCC
- ZTT
- Global Submarine Power Cable Market Outlook & Projections, Opportunity Assessment, 2026 to 2037,
- Market Overview
- Market Revenue by Value (USD Million), Volume (Million Meter) and Compound Annual Growth Rate (CAGR)
- Year-on-Year (Y-o-Y) Growth Trend Analysis
- Submarine Power Cable Market Segmentation Analysis (2026-2037)
- By Type
- AC (Alternating Current), Market Value (USD Million), CAGR & Y-o-Y Growth Trend, 2026-2037F
- DC (Direct Current), Market Value (USD Million), CAGR & Y-o-Y Growth Trend, 2026-2037
- By Voltage
- High Voltage, Market Value (USD Million), CAGR & Y-o-Y Growth Trend, 2026-2037F
- Medium & Low Voltage, Market Value (USD Million), CAGR & Y-o-Y Growth Trend, 2026-2037F
- By Core Type
- Single Core, Market Value (USD Million), CAGR & Y-o-Y Growth Trend, 2026-2037F
- Multi Core, Market Value (USD Million), CAGR & Y-o-Y Growth Trend, 2026-2037F
- By Insulation Composition
- Oil-Filled Insulated, Market Value (USD Million), CAGR & Y-o-Y Growth Trend, 2026-2037F
- Extruded Plastic Insulated, Market Value (USD Million), CAGR & Y-o-Y Growth Trend, 2026-2037F
- By Material
- Copper, Market Value (USD Million), CAGR & Y-o-Y Growth Trend, 2026-2037F
- Aluminum, Market Value (USD Million), CAGR & Y-o-Y Growth Trend, 2026-2037F
- By Application
- Offshore Wind Power Generation, Market Value (USD Million), CAGR & Y-o-Y Growth Trend, 2026-2037F
- Offshore Oil and Gas, Market Value (USD Million), CAGR & Y-o-Y Growth Trend, 2026-2037F
- Dynamic Cables (Floating Wind), Market Value (USD Million), CAGR & Y-o-Y Growth Trend, 2026-2037F
- Others, Market Value (USD Million), CAGR & Y-o-Y Growth Trend, 2026-2037F
- By Region
- North America, Market Value (USD Million), Volume (Million Meter) and CAGR & Y-o-Y Growth Trend, 2026-2037F
- Europe, Market Value (USD Million), Volume (Million Meter) and CAGR & Y-o-Y Growth Trend, 2026-2037F
- Asia Pacific Excluding Japan, Market Value (USD Million), Volume (Million Meter) and CAGR & Y-o-Y Growth Trend, 2026-2037F
- Japan, Market Value (USD Million), Volume (Million Meter) and CAGR & Y-o-Y Growth Trend, 2026-2037F
- Latin America, Market Value (USD Million), Volume (Million Meter) and CAGR & Y-o-Y Growth Trend, 2026-2037F
- Middle East & Africa, Market Value (USD Million), Volume (Million Meter) and CAGR & Y-o-Y Growth Trend, 2026-2037F
- By Type
- North America Submarine Power Cable Market Demand Outlook & Projections, 2026 to 2037
- Market Overview
- Analysis on the Regional Market Dynamics
- Market Revenue by Value (USD Million), Volume (Million Meter) and Compound Annual Growth Rate (CAGR)
- North America Submarine Power Cable Market Outlook & Projections, Opportunity Assessment, 2026-2037
- By Type
- AC (Alternating Current), Market Value (USD Million), CAGR & Y-o-Y Growth Trend, 2026-2037F
- DC (Direct Current), Market Value (USD Million), CAGR & Y-o-Y Growth Trend, 2026-2037
- By Voltage
- High Voltage, Market Value (USD Million), CAGR & Y-o-Y Growth Trend, 2026-2037F
- Medium & Low Voltage, Market Value (USD Million), CAGR & Y-o-Y Growth Trend, 2026-2037F
- By Core Type
- Single Core, Market Value (USD Million), CAGR & Y-o-Y Growth Trend, 2026-2037F
- Multi Core, Market Value (USD Million), CAGR & Y-o-Y Growth Trend, 2026-2037F
- By Insulation Composition
- Oil-Filled Insulated, Market Value (USD Million), CAGR & Y-o-Y Growth Trend, 2026-2037F
- Extruded Plastic Insulated, Market Value (USD Million), CAGR & Y-o-Y Growth Trend, 2026-2037F
- By Material
- Copper, Market Value (USD Million), CAGR & Y-o-Y Growth Trend, 2026-2037F
- Aluminum, Market Value (USD Million), CAGR & Y-o-Y Growth Trend, 2026-2037F
- By Application
- Offshore Wind Power Generation, Market Value (USD Million), CAGR & Y-o-Y Growth Trend, 2026-2037F
- Offshore Oil and Gas, Market Value (USD Million), CAGR & Y-o-Y Growth Trend, 2026-2037F
- Dynamic Cables (Floating Wind), Market Value (USD Million), CAGR & Y-o-Y Growth Trend, 2026-2037F
- Others, Market Value (USD Million), CAGR & Y-o-Y Growth Trend, 2026-2037F
- By Country
- US, Market Value (USD Million), Volume (Million Meter) and CAGR, 2026-2037F
- Canada, Market Value (USD Million), Volume (Million Meter) and CAGR, 2026-2037F
- By Type
- Europe Submarine Power Cable Market Demand Outlook & Projections, 2026 to 2037
- Market Overview
- Analysis on the Regional Market Dynamics
- Market Revenue by Value (USD Million), Volume (Million Meter) and Compound Annual Growth Rate (CAGR)
- Europe Submarine Power Cable Market Outlook & Projections, Opportunity Assessment, 2026-2037
- By Type
- By AC (Alternating Current), Market Value (USD Million), CAGR & Y-o-Y Growth Trend, 2026-2037F
- DC (Direct Current), Market Value (USD Million), CAGR & Y-o-Y Growth Trend, 2026-2037
- By Voltage
- High Voltage, Market Value (USD Million), CAGR & Y-o-Y Growth Trend, 2026-2037F
- Medium & Low Voltage, Market Value (USD Million), CAGR & Y-o-Y Growth Trend, 2026-2037F
- By Core Type
- Single Core, Market Value (USD Million), CAGR & Y-o-Y Growth Trend, 2026-2037F
- Multi Core, Market Value (USD Million), CAGR & Y-o-Y Growth Trend, 2026-2037F
- By Insulation Composition
- Oil-Filled Insulated, Market Value (USD Million), CAGR & Y-o-Y Growth Trend, 2026-2037F
- Extruded Plastic Insulated, Market Value (USD Million), CAGR & Y-o-Y Growth Trend, 2026-2037F
- By Material
- Copper, Market Value (USD Million), CAGR & Y-o-Y Growth Trend, 2026-2037F
- Aluminum, Market Value (USD Million), CAGR & Y-o-Y Growth Trend, 2026-2037F
- By Application
- Offshore Wind Power Generation, Market Value (USD Million), CAGR & Y-o-Y Growth Trend, 2026-2037F
- Offshore Oil and Gas, Market Value (USD Million), CAGR & Y-o-Y Growth Trend, 2026-2037F
- Dynamic Cables (Floating Wind), Market Value (USD Million), CAGR & Y-o-Y Growth Trend, 2026-2037F
- Others, Market Value (USD Million), CAGR & Y-o-Y Growth Trend, 2026-2037F
- By Country
- UK, Market Value (USD Million), Volume (Million Meter) and CAGR, 2026-2037F
- Germany, Market Value (USD Million), Volume (Million Meter) and CAGR, 2026-2037F
- France, Market Value (USD Million), Volume (Million Meter) and CAGR, 2026-2037F
- Italy, Market Value (USD Million), Volume (Million Meter) and CAGR, 2026-2037F
- Spain, Market Value (USD Million), Volume (Million Meter) and CAGR, 2026-2037F
- BENELUX, Market Value (USD Million), Volume (Million Meter) and CAGR, 2026-2037F
- Poland, Market Value (USD Million), Volume (Million Meter) and CAGR, 2026-2037F
- Russia, Market Value (USD Million), Volume (Million Meter) and CAGR, 2026-2037F
- Rest of Europe, Market Value (USD Million), Volume (Million Meter) and CAGR, 2026-2037F
- By Type
- Projections, 2026 to 2037
- Market Overview
- Analysis on the Regional Market Dynamics
- Market Revenue by Value (USD Million), Volume (Million Meter) and Compound Annual Growth Rate (CAGR)
- Asia Pacific Excluding Japan Submarine Power Cable Market Outlook & Projections, Opportunity Assessment, 2026-2037
- By Type
- By AC (Alternating Current), Market Value (USD Million), CAGR & Y-o-Y Growth Trend, 2026-2037F
- DC (Direct Current), Market Value (USD Million), CAGR & Y-o-Y Growth Trend, 2026-2037
- By Voltage
- High Voltage, Market Value (USD Million), CAGR & Y-o-Y Growth Trend, 2026-2037F
- Medium & Low Voltage, Market Value (USD Million), CAGR & Y-o-Y Growth Trend, 2026-2037F
- By Core Type
- Single Core, Market Value (USD Million), CAGR & Y-o-Y Growth Trend, 2026-2037F
- Multi Core, Market Value (USD Million), CAGR & Y-o-Y Growth Trend, 2026-2037F
- By Insulation Composition
- Oil-Filled Insulated, Market Value (USD Million), CAGR & Y-o-Y Growth Trend, 2026-2037F
- Extruded Plastic Insulated, Market Value (USD Million), CAGR & Y-o-Y Growth Trend, 2026-2037F
- By Material
- Copper, Market Value (USD Million), CAGR & Y-o-Y Growth Trend, 2026-2037F
- Aluminum, Market Value (USD Million), CAGR & Y-o-Y Growth Trend, 2026-2037F
- By Application
- Offshore Wind Power Generation, Market Value (USD Million), CAGR & Y-o-Y Growth Trend, 2026-2037F
- Offshore Oil and Gas, Market Value (USD Million), CAGR & Y-o-Y Growth Trend, 2026-2037F
- Dynamic Cables (Floating Wind), Market Value (USD Million), CAGR & Y-o-Y Growth Trend, 2026-2037F
- Others, Market Value (USD Million), CAGR & Y-o-Y Growth Trend, 2026-2037F
- By Country
- China, Market Value (USD Million), Volume (Million Meter) and CAGR, 2026-2037F
- India, Market Value (USD Million), Volume (Million Meter) and CAGR, 2026-2037F
- Indonesia, Market Value (USD Million), Volume (Million Meter) and CAGR, 2026-2037F
- South Korea, Market Value (USD Million), Volume (Million Meter) and CAGR, 2026-2037F
- Malaysia, Market Value (USD Million), Volume (Million Meter) and CAGR, 2026-2037F
- Australia, Market Value (USD Million), Volume (Million Meter) and CAGR, 2026-2037F
- Singapore, Market Value (USD Million), Volume (Million Meter) and CAGR, 2026-2037F
- Vietnam, Market Value (USD Million), Volume (Million Meter) and CAGR, 2026-2037F
- Thailand, Market Value (USD Million), Volume (Million Meter) and CAGR, 2026-2037F
- New Zealand, Market Value (USD Million), Volume (Million Meter) and CAGR, 2026-2037F
- Rest of Asia Pacific excluding Japan, Market Value (USD Million), Volume (Million Meter) and CAGR, 2026-2037F
- By Type
- Japan Submarine Power Cable Market Demand Outlook & Projections, 2026 to 2037
- Market Overview
- Analysis on the Regional Market Dynamics
- Market Revenue by Value (USD Million), Volume (Million Meter) and Compound Annual Growth Rate (CAGR)
- Japan Submarine Power Cable Market Outlook & Projections, Opportunity Assessment, 2026-2037
- By Type
- By AC (Alternating Current), Market Value (USD Million), CAGR & Y-o-Y Growth Trend, 2026-2037F
- DC (Direct Current), Market Value (USD Million), CAGR & Y-o-Y Growth Trend, 2026-2037
- By Voltage
- High Voltage, Market Value (USD Million), CAGR & Y-o-Y Growth Trend, 2026-2037F
- Medium & Low Voltage, Market Value (USD Million), CAGR & Y-o-Y Growth Trend, 2026-2037F
- By Core Type
- Single Core, Market Value (USD Million), CAGR & Y-o-Y Growth Trend, 2026-2037F
- Multi Core, Market Value (USD Million), CAGR & Y-o-Y Growth Trend, 2026-2037F
- By Insulation Composition
- Oil-Filled Insulated, Market Value (USD Million), CAGR & Y-o-Y Growth Trend, 2026-2037F
- Extruded Plastic Insulated, Market Value (USD Million), CAGR & Y-o-Y Growth Trend, 2026-2037F
- By Material
- Copper, Market Value (USD Million), CAGR & Y-o-Y Growth Trend, 2026-2037F
- Aluminum, Market Value (USD Million), CAGR & Y-o-Y Growth Trend, 2026-2037F
- By Application
- Offshore Wind Power Generation, Market Value (USD Million), CAGR & Y-o-Y Growth Trend, 2026-2037F
- Offshore Oil and Gas, Market Value (USD Million), CAGR & Y-o-Y Growth Trend, 2026-2037F
- Dynamic Cables (Floating Wind), Market Value (USD Million), CAGR & Y-o-Y Growth Trend, 2026-2037F
- Others, Market Value (USD Million), CAGR & Y-o-Y Growth Trend, 2026-2037F
- By Type
- Latin America Submarine Power Cable Market Demand Outlook & Projections, 2026 to 2037
- Market Overview
- Analysis on the Regional Market Dynamics
- Market Revenue by Value (USD Million), Volume (Million Meter) and Compound Annual Growth Rate (CAGR)
- Latin America Submarine Power Cable Market Outlook & Projections, Opportunity Assessment, 2026-2037
- By Type
- By AC (Alternating Current), Market Value (USD Million), CAGR & Y-o-Y Growth Trend, 2026-2037F
- DC (Direct Current), Market Value (USD Million), CAGR & Y-o-Y Growth Trend, 2026-2037
- By Voltage
- High Voltage, Market Value (USD Million), CAGR & Y-o-Y Growth Trend, 2026-2037F
- Medium & Low Voltage, Market Value (USD Million), CAGR & Y-o-Y Growth Trend, 2026-2037F
- By Core Type
- Single Core, Market Value (USD Million), CAGR & Y-o-Y Growth Trend, 2026-2037F
- Multi Core, Market Value (USD Million), CAGR & Y-o-Y Growth Trend, 2026-2037F
- By Insulation Composition
- Oil-Filled Insulated, Market Value (USD Million), CAGR & Y-o-Y Growth Trend, 2026-2037F
- Extruded Plastic Insulated, Market Value (USD Million), CAGR & Y-o-Y Growth Trend, 2026-2037F
- By Material
- Copper, Market Value (USD Million), CAGR & Y-o-Y Growth Trend, 2026-2037F
- Aluminum, Market Value (USD Million), CAGR & Y-o-Y Growth Trend, 2026-2037F
- By Application
- Offshore Wind Power Generation, Market Value (USD Million), CAGR & Y-o-Y Growth Trend, 2026-2037F
- Offshore Oil and Gas, Market Value (USD Million), CAGR & Y-o-Y Growth Trend, 2026-2037F
- Dynamic Cables (Floating Wind), Market Value (USD Million), CAGR & Y-o-Y Growth Trend, 2026-2037F
- Others, Market Value (USD Million), CAGR & Y-o-Y Growth Trend, 2026-2037F
- By Country
- Brazil, Market Value (USD Million), Volume (Million Meter) and CAGR, 2026-2037F
- Argentina, Market Value (USD Million), Volume (Million Meter) and CAGR, 2026-2037F
- Mexico, Market Value (USD Million), Volume (Million Meter) and CAGR, 2026-2037F
- Rest of Latin America, Market Value (USD Million), Volume (Million Meter) and CAGR, 2026-2037F
- By Type
- Middle East & Africa Submarine Power Cable Market Demand Outlook & Projections, 2026 to 2037
- Market Overview
- Analysis on the Regional Market Dynamics
- Market Revenue by Value (USD Million), Volume (Million Meter) and Compound Annual Growth Rate (CAGR)
- Middle East & Africa Submarine Power Cable Market Outlook & Projections, Opportunity Assessment, 2026-2037
- By Type
- By AC (Alternating Current), Market Value (USD Million), CAGR & Y-o-Y Growth Trend, 2026-2037F
- DC (Direct Current), Market Value (USD Million), CAGR & Y-o-Y Growth Trend, 2026-2037
- By Voltage
- High Voltage, Market Value (USD Million), CAGR & Y-o-Y Growth Trend, 2026-2037F
- Medium & Low Voltage, Market Value (USD Million), CAGR & Y-o-Y Growth Trend, 2026-2037F
- By Core Type
- Single Core, Market Value (USD Million), CAGR & Y-o-Y Growth Trend, 2026-2037F
- Multi Core, Market Value (USD Million), CAGR & Y-o-Y Growth Trend, 2026-2037F
- By Insulation Composition
- Oil-Filled Insulated, Market Value (USD Million), CAGR & Y-o-Y Growth Trend, 2026-2037F
- Extruded Plastic Insulated, Market Value (USD Million), CAGR & Y-o-Y Growth Trend, 2026-2037F
- By Material
- Copper, Market Value (USD Million), CAGR & Y-o-Y Growth Trend, 2026-2037F
- Aluminum, Market Value (USD Million), CAGR & Y-o-Y Growth Trend, 2026-2037F
- By Application
- Offshore Wind Power Generation, Market Value (USD Million), CAGR & Y-o-Y Growth Trend, 2026-2037F
- Offshore Oil and Gas, Market Value (USD Million), CAGR & Y-o-Y Growth Trend, 2026-2037F
- Dynamic Cables (Floating Wind), Market Value (USD Million), CAGR & Y-o-Y Growth Trend, 2026-2037F
- Others, Market Value (USD Million), CAGR & Y-o-Y Growth Trend, 2026-2037F
- By Country
- GCC, Market Value (USD Million), Volume (Million Meter) and CAGR, 2026-2037F
- Israel, Market Value (USD Million), Volume (Million Meter) and CAGR, 2026-2037F
- South Africa, Market Value (USD Million), Volume (Million Meter) and CAGR, 2026-2037F
- Rest of Middle East & Africa, Market Value (USD Million), Volume (Million Meter) and CAGR, 2026-2037F
- By Type
- About Research Nester
- Our Global Clientele
- We Serve Clients Across World
- Legal Disclaimer
Submarine Power Cable Market Outlook:
Submarine Power Cable Market size was valued at USD 17.65 billion in 2025 and is projected to reach USD 46.58 billion by the end of 2037, rising at a CAGR of 7.7% during the forecast period, i.e., between 2026-2037. In 2026, the industry size of submarine power cable is assessed at USD 20.47 billion.
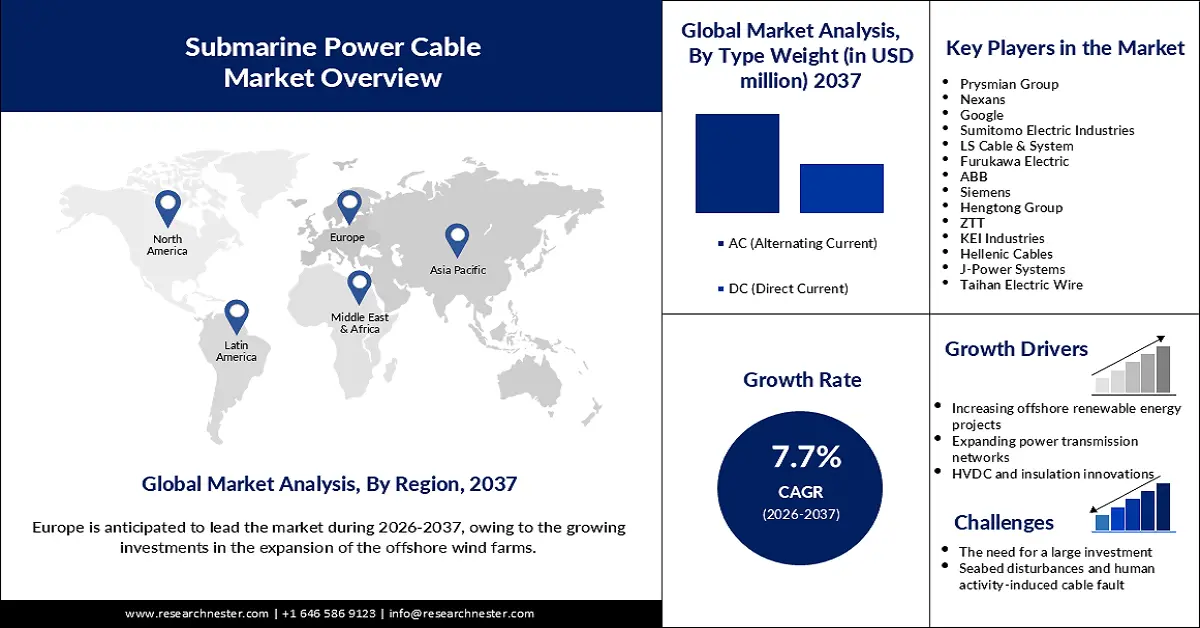
The rapid expansion of offshore wind farms is driving the growth of the market. These cables play a crucial role in transmitting electricity generated by offshore turbines to onshore grids. Increasing investments by energy companies to expand and upgrade offshore wind installations are further fueling demand. For example, in April 2024, Ørsted inaugurated the Greater Changhua 1 and 2a offshore wind farms in Taiwan, the largest in Asia-Pacific, with a combined installed capacity of 900 MW. This development not only enhances Taiwan’s offshore wind capacity but also strengthens the country’s broader offshore wind ecosystem.
Source: WBG
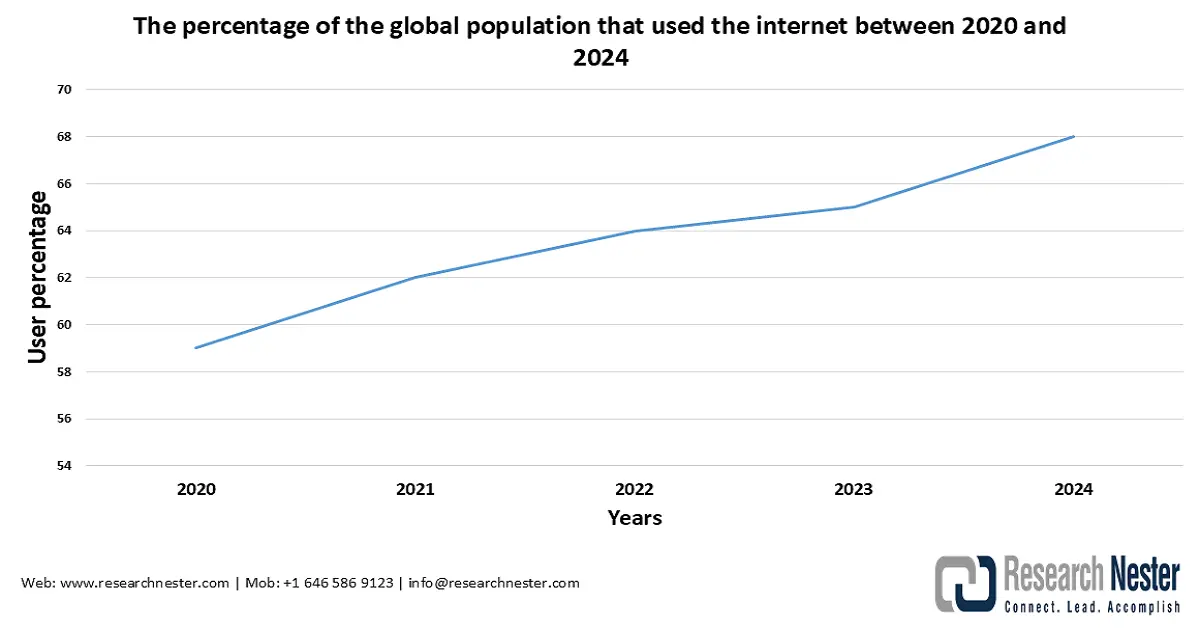
The demand for submarine power cables is expected to increase with growing data traffic globally. According to the International Telecommunication Union (ITU), 69% of the global population was actively using the internet in 2024. The International Energy Agency reported in July 2023 that the internet traffic globally expanded 20-fold, and the number of internet users doubled in the last decade. This influences the need for the proliferation of data centers and cloud services to manage a large pool of internet traffic. As a result, the installation of submarine power cables is likely to surge to establish high-capacity and low-latency connections.
Key Submarine Power Cable Market Insights Summary:
Regional Insights:
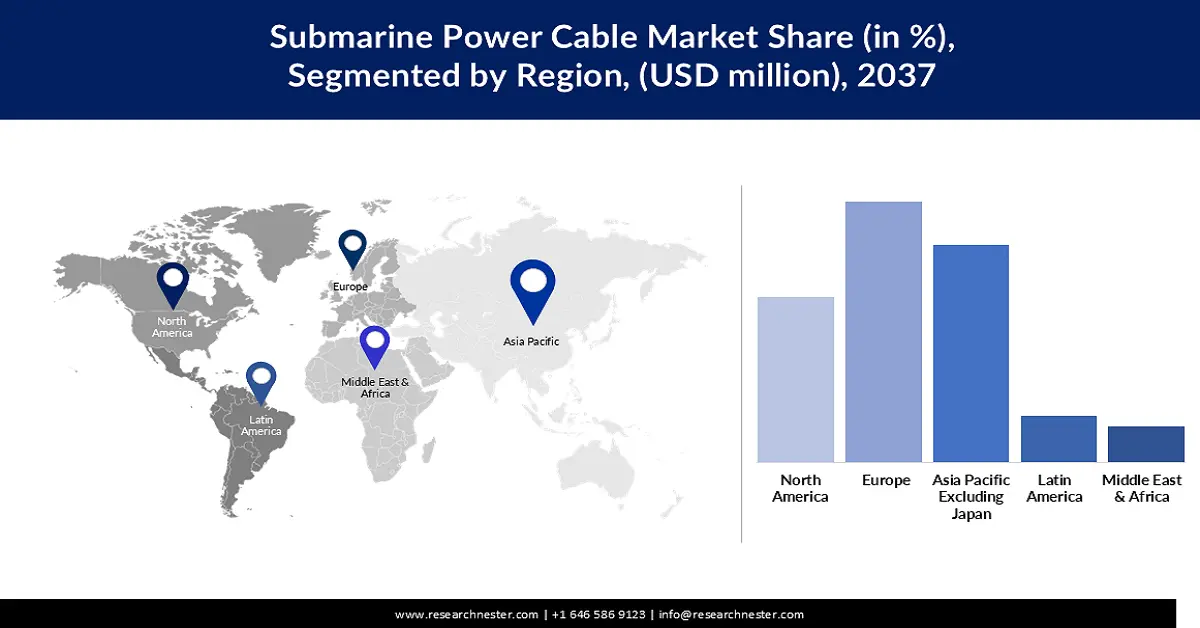
- By 2037, Europe is expected to command a 40.9% share of the submarine power cable market, attributable to expanding offshore wind farm investments.
- Asia Pacific excluding Japan is projected to capture a 31.1% revenue share through 2037, supported by accelerating urbanization and industrial growth.
Segment Insights:
- By 2037, the AC (Alternating Current) segment is set to capture a 68.1% share in the submarine power cable market, owing to the rising demand for renewable energy sources.
- The copper segment is estimated to secure a 78.9% revenue share between 2026 and 2037, propelled by its high tensile strength, electrical conductivity, and reliability in underwater environments.
Key Growth Trends:
- Increasing offshore renewable energy projects
- Expanding power transmission networks
Major Challenges:
- The need for a large investment
- Seabed disturbances and human activity-induced cable fault
Key Players: Prysmian Group (Italy), Nexans (France), Google (U.S.), LS Cable & System (South Korea), ABB (Switzerland), Siemens AG (Germany), Hengtong Group (China), ZTT Group (Jiangsu Zhongtian Technology Co., Ltd.) (China), KEI Industries Ltd. (India), Hellenic Cables S.A. (Greece), Taihan Electric Wire Co., Ltd. (South Korea), Orient Cable (Ningbo Orient Wires & Cables Co., Ltd.) (China)
Global Submarine Power Cable Market Forecast and Regional Outlook:
Market Size & Growth Projections:
- 2025 Market Size: USD 17.65 billion
- 2026 Market Size: USD 20.47 billion
- Projected Market Size: USD 46.58 billion by 2037
- Growth Forecasts: 7.7% CAGR (2026-2037)
Key Regional Dynamics:
- Largest Region: Europe (40.9% Share by 2037)
- Fastest Growing Region: North America
- Dominating Countries: United States, China, Germany, United Kingdom, Japan
- Emerging Countries: India, South Korea, Vietnam, Brazil, Australia
Last updated on : 5 November, 2025
Submarine Power Cable Market - Growth Drivers and Challenges
Growth Drivers
- Increasing offshore renewable energy projects: In June 2025, the Global Wind Energy Council (GWEC) projected that offshore wind installations would continue to expand steadily between 2025 and 2027, surpassing the 30 GW milestone by 2030 and exceeding 55 GW by 2034. Additionally, the share of new offshore power installations is expected to reach 25%. Similarly, according to the Ministry of New and Renewable Energy (MNRE), more than 75 GW of offshore wind energy projects had been completed across 18 countries by December 2023, notably in China, the UK, Germany, the Netherlands, and Denmark. The continuous rollout of such large-scale offshore renewable energy projects is anticipated to drive sustained demand for submarine power cables used in electricity transmission between offshore farms and onshore grids.
- Expanding power transmission networks: As countries invest in cross-border and inter-regional grid interconnections, submarine power cables become essential for transmitting electricity efficiently across seas and between islands and mainland grids. These networks enable the integration of offshore renewable energy sources such as wind and tidal power into national power systems, ensuring grid stability and energy security. Furthermore, the electrification of remote and coastal regions, coupled with increasing investments in high-voltage direct current (HVDC) and high-voltage alternating current (HVAC) transmission systems, is accelerating the deployment of advanced submarine cable technologies. Overall, the expansion of power transmission networks supports a resilient, interconnected global energy landscape, directly fueling growth in the market.
- HVDC and insulation innovations: The development of High Voltage Direct Current HVDC systems and innovations in electrical insulation is fueling the market growth, allowing the submarine cables to cover longer distances, manage high voltage, and reduce transmission loss. Losses in electric power transmission and distribution stood at 6% in 2023, significantly influencing the need for the development of HVDCs and advanced insulation methods. Governments across the globe are supporting the integration of HVDC and insulation solutions in power transmission. In April 2025, Hitachi Energy unveiled its plan to deliver a 950 km HVDC connection to Fatehpur, Uttar Pradesh, from the renewable energy zone in Bhadla, Rajasthan, in India.
Challenges
- The need for a large investment: Submarine power cable projects require significant upfront investments, creating substantial financial barriers for new entrants. These high costs often enable established players to dominate the market and capture the majority of the revenue share, leading to increased market concentration. The expenses primarily stem from complex cable manufacturing, the need for specialized vessels, installation equipment, and technical expertise. Moreover, the rising global cost of raw materials and fiber optic cable production has intensified financial pressures, further challenging both new and existing companies in maintaining profitability and competitiveness within the market.
- Seabed disturbances and human activity-induced cable fault: Seabed disturbances are significant environmental impacts influenced by the global submarine power cable industry. The process of the installation disrupts the marine habitats, affecting marine life and hampering seabed ecosystems. This creates a gap in the environmental sustainability of the market. Human activities, including fishing, often cause faults in the submarine power cables. In February 2025, the International Cable Protection Committee revealed that around 30% of damage to submarine cables is caused by dragged anchors. Such incidents often result in power outages and heightened operational costs for key market players.
Submarine Power Cable Market Size and Forecast:
| Report Attribute | Details |
|---|---|
|
Base Year |
2025 |
|
Forecast Year |
2026-2037 |
|
CAGR |
7.7% |
|
Base Year Market Size (2025) |
USD 17.65 billion |
|
Forecast Year Market Size (2037) |
USD 46.58 billion |
|
Regional Scope |
|
Submarine Power Cable Market Segmentation:
Type Segment Analysis
The AC (Alternating Current) segment is projected to account for a market share of 68.1% by the end of 2037, owing to the rising demand for renewable energy sources. AC submarine power cables are highly compatible with wind energy farms. The consumption of this type of submarine power cable is expected to increase, with the growing adoption of offshore wind energy projects by governments. In October 2025, the Press Information Bureau of India reported that the PM GatiShakti – Offshore project was initiated in the form of a digital platform launch. The platform is enabled with a geospatial interface consolidating crucial data sets from ministers and administrative departments. The platform is likely to help the government make data-driven decisions regarding projects, including offshore wind farms.
Material Segment Analysis
The copper segment is expected to acquire a revenue share of 78.9% between 2026 and 2037, owing to its high tensile strength, electrical conductivity, and reliability in tough underwater environments. The shift of the market towards HVDC is influencing the adoption of submarine power cables made of copper. Strategic partnerships between key suppliers and wind farms are also boosting the consumption of copper-based submarine power cables. The growing need to transmit power over longer distances, driven by the rising number of offshore wind energy projects, is also projected to fuel the consumption of submarine power cables made of copper.
Application Segment Analysis
The offshore oil and gas segment is set to hold a market share of 47.3% during the forecast period, owing to growing demand for submarine power cables for reliable power transmission, driven by the growing oil and gas production. As reported by the International Energy Agency in October 2025, oil supply globally surged by 760 kb/d m-o-m in September, leading to a total oil supply of 108 mb/d. The global utility industry is also keen to use advanced submarine cables to enhance deep-water operations related to oil and gas extraction. The need to reduce operating costs in the global utility industry is estimated to boost the adoption of submarine power cables.
Our in-depth analysis of the submarine power cable market includes the following segments:
|
Segments |
Subsegments |
|
Type |
|
|
Voltage |
|
|
Core Type |
|
|
Insulation Composition |
|
|
Material |
|
|
Application |
|

Vishnu Nair
Head - Global Business DevelopmentCustomize this report to your requirements — connect with our consultant for personalized insights and options.
Submarine Power Cable Market - Regional Analysis
Europe Market Insights
The Europe submarine power cable market is expected to account for a revenue share of 40.9% by the end of 2037, due to the growing investments in the expansion of the offshore wind farms. As disclosed by Wind Europe in February 2024, offshore wind installations of 3.8 GW took place in 2023 in Europe. Similarly, according to the estimation by the Strategic Energy Europe in October 2025, offshore wind in Europe will surge to 46 GW by 2030 from 21 GW in 2025. Growing activities to enhance energy security and grid resilience across different countries and islands within the region are also expected to fuel the consumption of submarine power cables in the upcoming financial years.
The submarine power cable market in the UK is estimated to expand at a CAGR of 8.9% during the stipulated timeframe, on account of the increasing establishment of offshore wind farms. As reported by the Department for Energy Security & Net Zero in September 2025, offshore wind capacity in the UK surged by 8.1% in 2025, majority of the contribution made by Moray West, Scotland. The growing involvement of the country in cross-border energy trading is also likely to boost the demand for submarine power cables. As revealed by the Strategic Energy Europe in May 2025, the UK made an agreement with the EU to participate in the EU Energy Interconnection Platform. This initiative is expected to lead to an enhancement of the cross-border flow of electricity and stabilization of energy prices.
Germany is poised to emerge as a growing submarine power cable market between 2026 and 2037, owing to the rising demand for high-speed internet across the country. According to the disclosure by the Verband der Anbieter im Digital- und Telekommunikationsmarkt, the demand for faster internet is surging remarkably to more than 28% in Germany. This indicates a strong demand for submarine power cables to enable high-speed power transmission. The growth of cloud computing across Germany is leading to a rising data traffic, fueling the demand for the material, especially for fiber optic cables. As disclosed by the IFO Institute in July 2023, the proportion of companies using cloud computing technology in Germany was 46.5%.
Asia Pacific Excluding Japan Market Insights
The Asia Pacific excluding Japan submarine power cable market is projected to hold a revenue share of 31.1% during the projection timeline, owing to rapid urbanization and industrialization. As reported by the UN-Habitat, the urban population in Asia is likely to display 50% growth by 2050. According to an estimate by UNICEF in January 2023, around 55% of the population in Asia will live in urban areas by 2030. The growing need for electricity with rapid urbanization and industrialization is likely to boost the consumption of submarine power cables. Governments across different countries are investing heavily in the expansion of offshore wind farms, influencing a surge in the demand for the material.
The submarine power cable market in China is anticipated to experience a robust expansion at a 9.5% CAGR throughout the forecast timeline. As briefed by the Jamestown Foundation in July 2025, Beijing adapts to submarine power cables as a crucial infrastructure that can not only enhance the electrical power but also the geopolitical power of China. The government also signed a joint statement at the China-ASEAN-Gulf Cooperation Council Summit, promoting investment in submarine power cables and cross-border projects of power transmission. The expansion of the consumer electronics and telecommunication industry is fueling the demand for electricity across the country. This is likely to lead to a growing use of submarine power cables. In September 2023, the State Council informed that China intends to bolster the high-end electric device supply.
India’s submarine power cable market can grow exponentially throughout the study period, owing to the geographical location of the country. Being at the crossroads of Asia, Africa, and Europe, India is likely to become the central hub securing a widespread network of submarine power cables. Drastic growth in internet connectivity and penetration, even in underdeveloped areas, can also fuel the demand for submarine power cables in the years to come. In August 2024, the Press Information Bureau disclosed that among 954,40 million internet users, 398.3 million were in rural areas as of March 2024.
North America Market Insights
The North America submarine power cable market is likely to witness a 7.0% CAGR during the projection period, owing to the surging demand for offshore renewable energy. As reported by the U.S. Department of Energy, offshore wind energy of 86 GW is likely to be available in coastal regions across the U.S. This indicates the probability of growing use of submarine power cables for power transmission. Firms operating within the region are investing heavily in the development of the material. Rising oil extraction activities are expected to boost the demand for the material in the near future.
The rapid growth of the renewable energy sector of the U.S. is set to cause expansion of the submarine power cable market from 2026 to 2037. A report by the World Resources Institute, published in February 2025, suggests that U.S. solar capacity reached 20 GW, sufficient for the provision of 7% electricity required within the country. Similarly, according to the Oceanic Network in February 2025, renewable energy technologies that include offshore wind power in the U.S. are more than prepared to meet rising energy demand. The proliferation of data centers is also anticipated to fuel the consumption of the material in the next few years. As informed by the American Association for the Advancement of Science in August 2025, the number of data centers designed for intensive workloads doubled in the past five years globally, with half of them located in the U.S.
The Canada market is projected to go through a steady expansion throughout the forecast period, owing to the growing demand for DC submarine power cables, driven by government policies that encourage the integration of renewable energy. According to the estimate by Natural Resources Canada in August 2025, the gross domestic product of the clean energy sectors of the country is likely to reach USD 107 billion in the next five business years. The government also allocated a budget of USD 40 million to support the country's clean energy sector. Access to such funding is likely to make the adoption of expensive submarine power cables convenient. The plan of the government to modernize power grids can also fuel the adoption of the material for its high durability and power transmission capacity.
Key Submarine Power Cable Market Players:
- Prysmian Group (Italy)
- Company Overview
- Business Strategy
- Key Product Offerings
- Financial Performance
- Key Performance Indicators
- Risk Analysis
- Recent Development
- Regional Presence
- SWOT Analysis
- Nexans (France)
- Google (U.S.)
- LS Cable & System (South Korea)
- ABB (Switzerland)
- Siemens AG (Germany)
- Hengtong Group (China)
- ZTT Group (Jiangsu Zhongtian Technology Co., Ltd.) (China)
- KEI Industries Ltd. (India)
- Hellenic Cables S.A. (Greece)
- Taihan Electric Wire Co., Ltd. (South Korea)
- Orient Cable (Ningbo Orient Wires & Cables Co., Ltd.) (China)
- Prysmian Group is one of the global leaders in the market, offering advanced cable technologies for energy transmission and telecommunications. The company designs, manufactures, and installs high-voltage submarine cables for interconnectors and offshore wind farms. Its strong project execution capabilities and global presence make it a preferred partner for major offshore renewable energy projects. Prysmian’s continuous innovation focuses on enhancing transmission efficiency and sustainability.
- Nexans is a key player in the submarine power cable industry, specializing in cable manufacturing and installation for offshore wind, interconnection, and energy transmission projects. The company’s expertise covers turnkey solutions, including engineering, production, and laying of high-voltage submarine cables. Nexans has been actively involved in major offshore wind farm projects in Europe and North America, reinforcing its leadership in the energy transition.
- Google plays an emerging yet influential role in the submarine cable market through its investment in undersea data cable infrastructure. The company develops and owns private subsea cables to improve global internet connectivity and data transmission speed. These cables connect major continents and enhance the performance and resilience of Google Cloud and other digital services. Google’s initiatives significantly contribute to global digital infrastructure development.
- LS Cable & System is a prominent manufacturer of power and communication cables, with a strong foothold in the submarine cable segment. The company provides high-voltage submarine cables for power transmission and renewable energy applications, including offshore wind farms. With its advanced production facilities and technical expertise, LS Cable continues to expand its international presence through strategic contracts and collaborations in Asia and Europe.
- ABB is a global technology leader in electrification and automation, providing end-to-end solutions for submarine power transmission. The company offers high-voltage direct current (HVDC) systems and advanced cable technologies for interconnectors and offshore renewable energy projects. ABB’s innovations focus on improving energy efficiency, reliability, and sustainability in power transmission. Its strong engineering and system integration capabilities position it as a trusted partner in large-scale submarine power cable projects.
Below is the list of the key players operating in the global market:
Key players in the global market are expected to face a high intensity of competition in the upcoming years. The emergence of new companies based in China is increasing the market competition over time. However, there are no dominant players, making the market fragmented. All the key players, regardless of their size, are investing in research and development to innovate high-voltage cables to fulfill the growing market demand for offshore wind energy projects. Adequate government support for the small players in the market:
Corporate Landscape of the Submarine Power Cable Market:
Recent Developments
- In September 2025, Terna, Italy’s Transmission System Operator, in collaboration with Nexans, a global leader in cable systems and services, commenced the first installation phase of the Tyrrhenian Link’s western section from Fiumetorto in Termini Imerese (Palermo). Upon completion, the project will connect Sicily (Termini Imerese, Palermo) and Sardinia (Terra Mala, Cagliari), setting a new world record for the deepest installation of a high-voltage direct current (HVDC) subsea cable at 2,150 meters below sea level. This milestone marks a significant advancement in global electricity transmission technology.
- In July 2024, the European Investment Bank (EIB) approved a €450 million (US$488 million) financing facility for Prysmian, a leading global manufacturer of subsea cables, to support its production capacity expansion. The funding will enable Prysmian to establish new production lines for extra-high-voltage submarine cables, enhance high-voltage onshore cable manufacturing, and implement technical upgrades across its existing facilities. This investment aims to strengthen Prysmian’s ability to meet the growing global demand for advanced power transmission solutions.
- Report ID: 6188
- Published Date: Nov 05, 2025
- Report Format: PDF, PPT
- Explore a preview of key market trends and insights
- Review sample data tables and segment breakdowns
- Experience the quality of our visual data representations
- Evaluate our report structure and research methodology
- Get a glimpse of competitive landscape analysis
- Understand how regional forecasts are presented
- Assess the depth of company profiling and benchmarking
- Preview how actionable insights can support your strategy
Explore real data and analysis
Frequently Asked Questions (FAQ)
Submarine Power Cable Market Report Scope
Free Sample includes current and historical market size, growth trends, regional charts & tables, company profiles, segment-wise forecasts, and more.
Connect with our Expert


Copyright @ 2026 Research Nester. All Rights Reserved.
