Soy Chemicals Market Outlook:
Soy Chemicals Market size was valued at USD 30.59 billion in 2025 and is projected to reach approximately USD 51.69 billion by the end of 2035, rising at a CAGR of 5.4% during the forecast period, i.e., 2026-2035. In 2026, the industry size of soy chemicals is assessed at USD 32.26 billion.
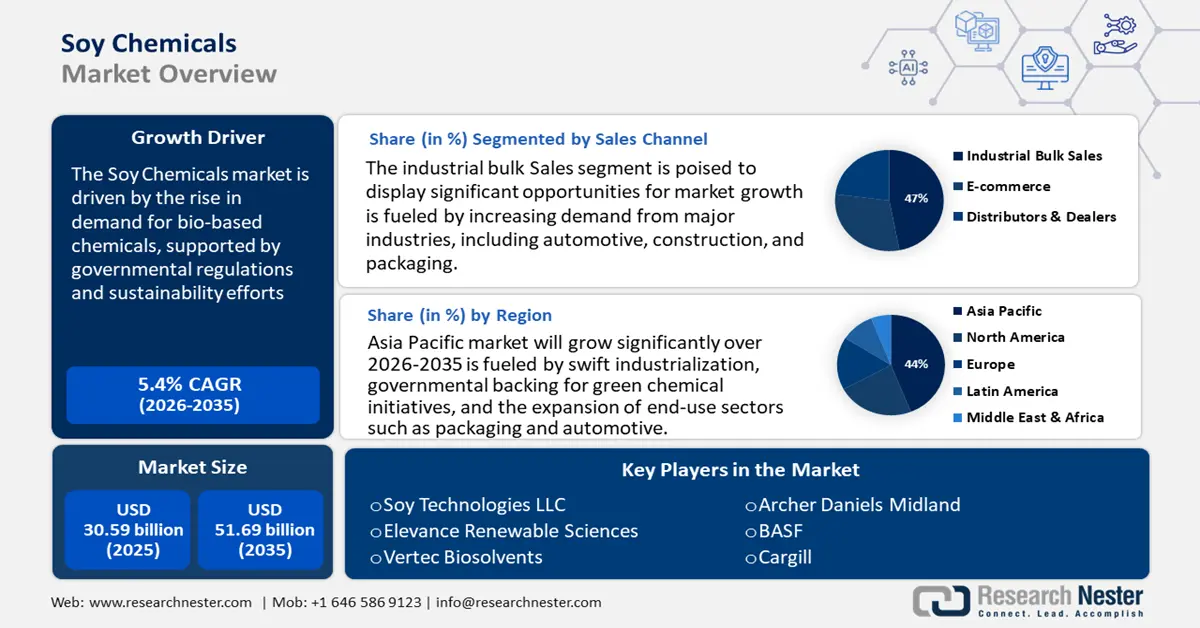
The market for soy chemicals is propelled by the increasing demand for bio-based chemicals, strengthened by government regulations and sustainability initiatives. For instance, the United States Department of BioPreferred Program contributes a total of USD 489 billion to the U.S. economy through the utilization of renewable resources by offering tax incentives and grants to encourage the development of soybean-based alternatives. In the same manner, bio-based technologies, which fit with the goal of sustainability and diminishing the dependence on fossil fuels, benefit from subsidies, tax breaks, and research subsidies from the UK government. Such policies not only boost the size of the soy chemicals market but also drive innovation and investment in bio-based technologies.
The supply chain for raw materials in the soy chemicals sector is strong, with major soybean producers such as the United States and Brazil. These countries have developed effective supply chains that enable the conversion of soybeans into a variety of chemical products. According to the U.S. Department of Agriculture (USDA), the United States exported around 52.21 million metric tons of soybeans during the 2024 marketing year, underscoring the important role of soybean exports in the global marketplace. Manufacturers are increasing their production capacities to satisfy the rising demand for soy-based chemicals, which involves investments in processing facilities as well as research and development initiatives. Global trade trends suggest a consistent rise in the import and export of soybeans and soy-based products, propelled by the growing need for sustainable and renewable resources.
Key Soy Chemicals Market Insights Summary:
Regional Highlights:
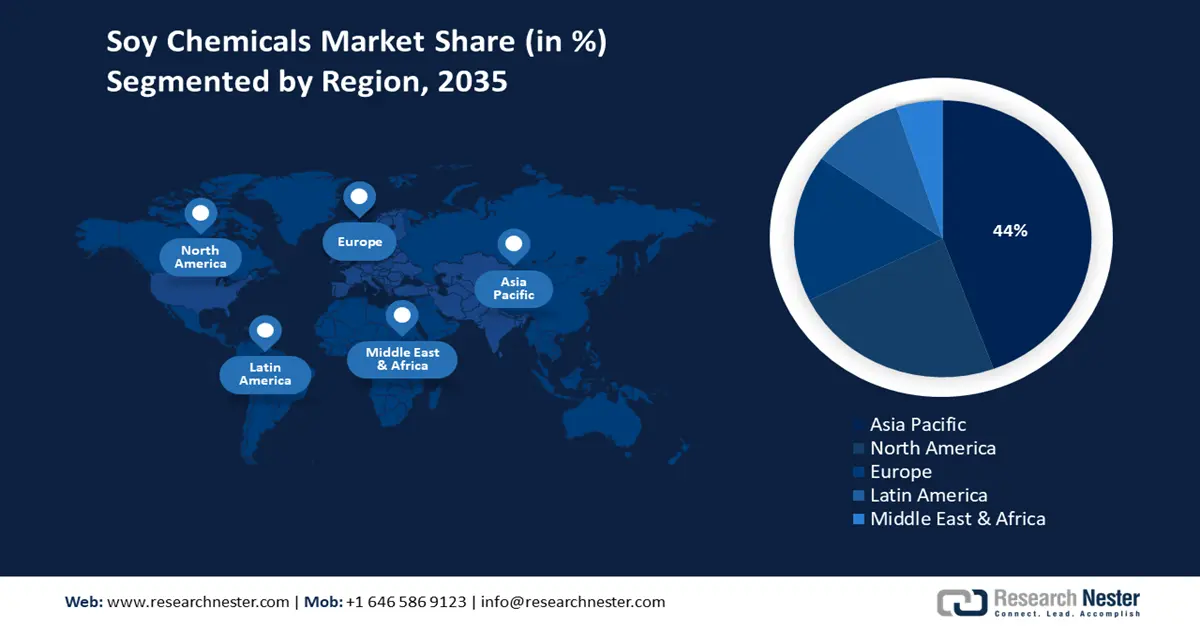
- Asia-Pacific is anticipated to account for 44% of the global soy chemicals market by 2035, driven by rapid industrialization, government support for green chemical initiatives, and expansion of end-use sectors such as packaging and automotive.
- North America is projected to hold 23% of the market share by 2035, supported by strong demand for bio-based polymers, sustainable chemical products, government subsidies, and investments in clean energy manufacturing.
Segment Insights:
- In the sales segment, industrial bulk is forecast to secure the largest share of 47% by 2035, propelled by cost efficiency, steady supply for high-volume applications, and the shift toward sustainable raw materials.
- Within the product segment, bio-based polymers are set to capture 44% of the market by 2035, reinforced by their adoption as substitutes for petrochemical-based plastics and government incentives promoting renewable materials.
Key Growth Trends:
- EU's sustainable chemicals initiative
- Innovations in chemical production
Major Challenges:
- Pricing pressures and volatility
- Environmental compliance costs
Key Players: Dow Chemical Company, Mitsui Chemicals Inc., SABIC, LG Chem, Reliance Industries Ltd., Mitsubishi Chemical Corporation, DuPont de Nemours Inc., LyondellBasell Industries, Arkema, INEOS Group, Petronas Chemicals Group, Formosa Plastics Corporation.
Global Soy Chemicals Market Forecast and Regional Outlook:
Market Size & Growth Projections:
- 2025 Market Size: USD 7.41 billion
- 2026 Market Size: USD 7.78 billion
- Projected Market Size: USD 12.66 billion by 2035
- Growth Forecasts: 5.5% CAGR (2026-2035)
Key Regional Dynamics:
Largest region: Asia-Pacific (44% share by 2035)
Fastest growing region: North America
Dominating countries: China, United States, Japan, Germany, India
Emerging countries: South Korea, Malaysia, Brazil, France, Canada
Last updated on : 10 September, 2025
Soy Chemicals Market - Growth Drivers and Challenges
Growth Drivers
- EU's sustainable chemicals initiative: The European Chemicals Agency (ECHA) has published new risk classes for endocrine disruptors and viscous substances according to EU criteria. Such measures are intended to recognize and reduce the risks of long-lived chemicals in the environment. Adoption of these rules incentivizes the chemical industry to transition to safer and more renewable options, such as soy-based chemicals, compatible with today´s sustainability objectives and regulatory requirements.
- Innovations in chemical production: Progress in chemical production technologies, including the design of greener catalysts and upgraded extraction procedures, can upgrade efficiency and reduce the cost of soy-based chemicals production. For example, by introducing advanced catalysis, production efficiency has increased by 21%, yielding major economic and environmental benefits. These changes are promoting demand for soy-based chemicals as a natural replacement for petrochemical products.
- Rising demand in personal care & cosmetics: Soy-based ingredients, such as soy protein, lecithin, and fatty acids, are gaining presence in skin and hair care products, as they are moisturizing, emulsifying, and skin-conditioning agents. Consumers' increasing desire for natural, "clean-label" cosmetics has helped enough to replace traditional synthetic forms with their soy-based alternatives. The functionality of soy-based ingredients includes both compatibility with skin (biocompatibility) and biodegradability, which particularly attracts sensitive-skin users. In a report from Cosmetic Ingredient Review (an expert panel backed by the U.S.) substantively concluded that it was safe to use lecithin in leave-on cosmetic products at concentrations of 15%.
Soybean Exports in the U.S.
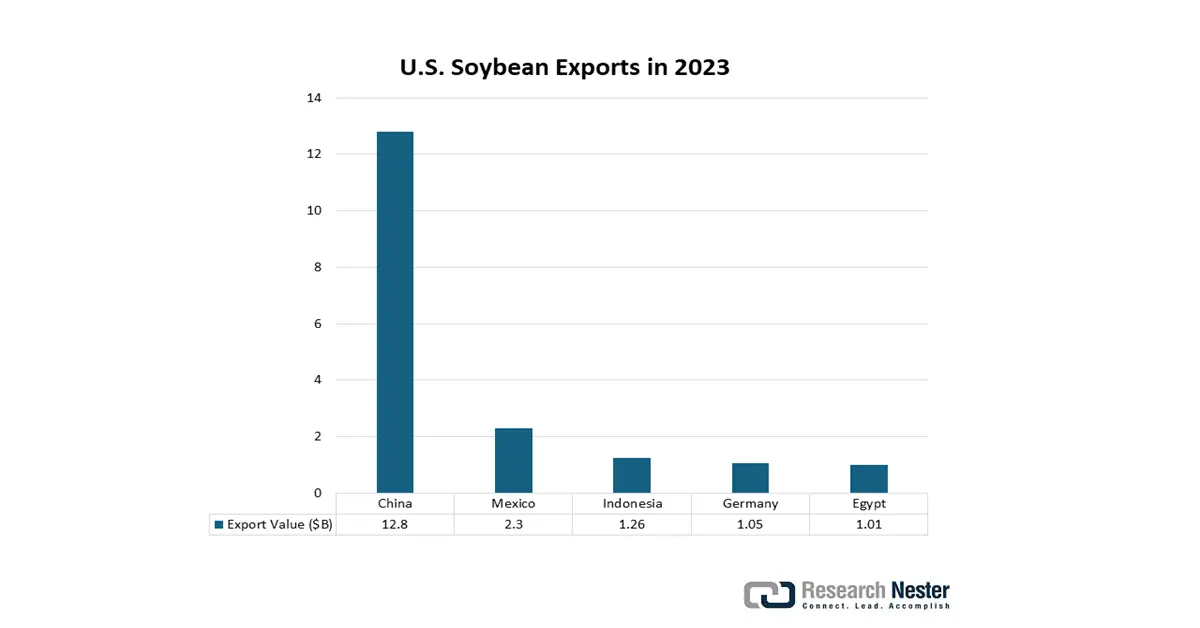
Soybean exports in the U.S. drive the soy chemicals market by ensuring a robust supply chain for soy-based feedstocks like soy oil and fatty acids. As global demand for sustainable and bio-based products rises, strong export volumes support economies of scale and investment in soy chemical processing. This enhances production of biodiesel, bioplastics, and personal care ingredients derived from soy. Ultimately, export strength reinforces the U.S.'s leadership in renewable chemical innovation and market growth.
Soybeans Export Markets 2024
|
Country |
Total Value (USD) |
|
China |
$12.64 Billion |
|
European Union |
$2.45 Billion |
|
Mexico |
$2.3 Billion |
|
Indonesia |
$1.24 Billion |
|
Egypt |
$1.06 Billion |
|
Japan |
$998.33 Million |
|
Taiwan |
$624.14 Million |
|
Vietnam |
$481.87 Million |
|
Bangladesh |
$350.52 Million |
|
Turkey |
$350.04 Million |
Source: USDA
Challenges
- Pricing pressures and volatility: Soy chemicals are very sensitive to raw material cost, with much of the market driven by soybeans and their prices. Barber‐Wullschleger stated that soybean prices are subject to fluctuations with seasonal agricultural conditions and trade regulations. While trade costs stayed relatively reasonable increase in soybean tariffs was reported by the World Trade Organization (WTO) in 2022, adding cost pressures to speculative costs across the world. Any fluctuations in pricing complicate pricing models and negatively impact margins for soy-related suppliers, limiting their ability to compete.
- Environmental compliance costs: Environmental compliance costs are disproportionately higher than material costs in some key markets. The tightening of environmental regulations by the EPA in the U.S. has imposed significant compliance costs on operating. The national air quality and water quality standards have for small U.S. producers in the chemical are imposed significant operating costs and compliance costs in 2023, increasing cost pressures and having the effect of stopping company expansion and the startup of innovative products.
Soy Chemicals Market Size and Forecast:
| Report Attribute | Details |
|---|---|
|
Base Year |
2025 |
|
Forecast Year |
2026-2035 |
|
CAGR |
5.4% |
|
Base Year Market Size (2025) |
USD 30.59 billion |
|
Forecast Year Market Size (2035) |
USD 51.69 billion |
|
Regional Scope |
|
Soy Chemicals Market Segmentation:
Sales Channel Segment Analysis
The industrial bulk sales sector is anticipated to lead the global soy chemicals market, capturing a 47% share by 2035. This growth is fueled by increasing demand from major industries, including automotive, construction, and packaging. Bulk buying facilitates cost savings and ensures a steady supply for high-volume uses such as bio-lubricants, adhesives, and surfactants. The transition towards sustainable raw materials in manufacturing is hastening the bulk acquisition of soy-based substitutes, especially in areas with robust regulatory backing for the adoption of green chemicals.
Application Segment Analysis
Bio-based polymers produced from soy chemicals are projected to capture 44% of the global market and are gaining popularity as substitutes for petrochemical-based plastics. According to the CEA, in 2022, 0.8 million hectares of land were used worldwide for the production of bio-based plastics. This represents approximately 5.0 billion hectares, or 0.015% of the world's total agricultural land area. Moreover, alongside regulatory pressures, government incentives for renewable materials are accelerating the adoption of biobased materials in both the packaging and automotive sectors.
Type Segment Analysis
The soy oil derivatives are anticipated to lead the global soy chemicals market, capturing a 35% share by 2035. This growth is fueled by increasing applications in biodiesel, lubricants, coatings, and personal care products. Their competitive price, renewable qualities, and multitude of applications on an industrial level lead soy oil derivatives to be the most widely consumed portion, and growing demands for sustainable energy and green chemical alternatives will solidify soy oil derivatives' position as the leading group of commodity chemicals in the global context.
Our in-depth analysis of the soy chemicals market includes the following segments:
| Segment | Sub-Segments |
|
Sales Channel |
|
|
Application |
|
|
Type
|
|
|
End use |
|
|
Grade |
|

Vishnu Nair
Head - Global Business DevelopmentCustomize this report to your requirements — connect with our consultant for personalized insights and options.
Soy Chemicals Market - Regional Analysis
Asia Pacific Market Insights
The soy chemicals market in the Asia Pacific is anticipated to account for 44% of the global revenue share by the year 2035. This growth is fueled by swift industrialization, governmental backing for green chemical initiatives, and the expansion of end-use sectors such as packaging and automotive. Japan, China, India, Malaysia, and South Korea are at the forefront of government investments in sustainable chemistry. The United States Department of Agriculture (USDA) estimated that global soybean production was 391.17 million metric tons in the years 2022/2023. Approximately 7% of soy is used for direct human food products such as tofu, soymilk, edamame beans, and tempeh. From the available data, during the season of 2022/2023, approximately 27 million metric tons of soybeans were processed into soy products, amounting to more than 32 million metric tons of wet okara. Due to the moisture content of okara, most of it is then disposed of in landfills.
China is anticipated to hold the largest share of soy chemicals revenue in Asia-Pacific by 2035, propelled by assertive industrial policies, widespread implementation of green technologies, and a vast chemical manufacturing infrastructure. The National Development and Reform Commission's emphasis on sustainable chemical production has hastened market expansion, strengthened by an increasing number of environmentally friendly chemical facilities and government investments each year.
Further, soybean trade in India is shaped by strong domestic production estimated at over 126 lakh tons in 2024, yet the country still imports large volumes of soybean oil to meet demand. India exports significant quantities of soybean meal. Despite having a cost advantage, domestic crushers often bypass local soybeans, leading to rising imports. This trade dynamic highlights both the potential and challenges in achieving self-sufficiency in India’s oilseed sector.
India’s Soybeans Trade - Exports and Imports (2023)
|
Exporting Country |
Value (USD Million) |
Importing Country |
Value (USD Million) |
|
Canada |
10.7 |
Togo |
213 |
|
Nepal |
3.12 |
Nigeria |
126 |
|
Sri Lanka |
2.61 |
Niger |
108 |
|
Belgium |
0.445 |
Mozambique |
38.5 |
|
Vietnam |
0.444 |
Tanzania |
33.4 |
Source: OEC
North America Market Insights
In 2035, North America is expected to represent 23% of the global soy chemicals market, driven by a strong demand for bio-based polymers and sustainable chemical products. The rising demand is due to government subsidies, environmental concerns, and increasing industrial innovation. Furthermore, an increase in investment in the manufacture of clean energy chemicals and the adoption of green manufacturing processes will energize the growth of the market. Demands in the market are also increasing with the global switch over to renewable raw materials and stringent safety requirements enforced in various industries.
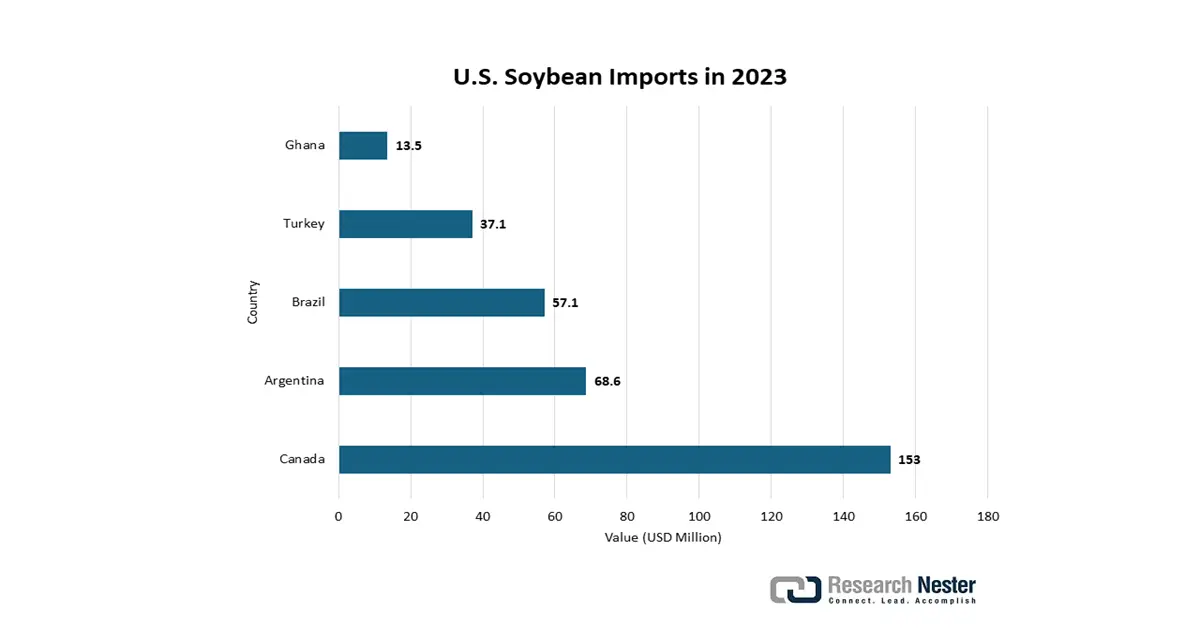
In 2024, the U.S exported $24.6 billion worth of soybeans, making it the country’s 15th most exported product out of 1,227. The fastest-growing export markets between 2023 and 2024 were Egypt (+$534M), Turkey (+$299M), and Portugal (+$163M). On the import side, the U.S. brought in $380 million of soybeans, ranking 591st among imports. Import growth was strongest from Canada (+$76.9M), Mexico (+$4.51M), and Uruguay (+$3.19M), reflecting both shifting trade dynamics and diverse supply chain dependencies.
Source: OEC
Source: OEC
Europe Market Insights
The soy chemicals market in Europe is anticipated to account for 17% of the global revenue share by the year 2035, owing to demand for natural, bio-based raw materials in food, cosmetics, and pharmaceuticals. Regulatory mechanisms such as the EU Green Deal, which targets sustainability, encourage the adoption of sustainable chemicals, which influences the industry. The rise in popularity of natural ingredients with consumers, available advancements in soy oil derivative materials, and investment into green industrial applications for various end-use sectors further facilitate growth in the market.
Crude Soya Bean Oil Export in 2023
|
Country |
Export Value (Thousand USD) |
Quantity (Kg) |
|
United Kingdom |
24,125.14 |
22,178,700 |
|
Germany |
70,056.03 |
67,959,600 |
|
France |
55,561.64 |
54,563,400 |
|
Italy |
216,718.99 |
205,785,000 |
|
Spain |
366,354.89 |
315,129,000 |
Source: WITS
Key Soy Chemicals Market Players:
- BASF SE
- Company Overview
- Business Strategy
- Key Product Offerings
- Financial Performance
- Key Performance Indicators
- Risk Analysis
- Recent Development
- Regional Presence
- SWOT Analysis
- Dow Chemical Company
- Mitsui Chemicals, Inc.
- SABIC
- LG Chem
- Reliance Industries Ltd.
- Mitsubishi Chemical Corporation
- DuPont de Nemours, Inc.
- LyondellBasell Industries
- Arkema
- INEOS Group
- Petronas Chemicals Group
- Formosa Plastics Corporation
- LG Chem
- Reliance Industries Ltd.
The market for soy chemicals is primarily controlled by several major global entities that emphasize technological advancements and sustainable manufacturing practices. Leading companies such as BASF and Dow are expanding their global presence and investing in green chemistry initiatives. Their strategic efforts encompass increasing production capacities in the Asia-Pacific region, conducting research and development in bio-based chemicals, and integrating digital supply chains, all aimed at improving their competitive edge in the face of rising regulatory challenges and changing customer expectations. The table below presents the top 15 soy chemical manufacturers and the share they hold in the global market.
Recent Developments
- In March 2024, Dow launched a new range of soy-based adhesives designed for lightweight automotive components, securing a 15% adoption rate among leading OEMs in 2024. This introduction aligns with the automotive industry's transition towards renewable materials to achieve carbon reduction goals.
- In January 2024, BASF introduced a biodegradable polymer derived from soy, aimed at packaging uses. This innovation resulted in a 20% growth in BASF's market share in sustainable polymers over six months. The introduction of this product was in response to the increasing demand for environmentally friendly packaging, which is being propelled by more stringent EU regulations regarding plastic waste management.
- Report ID: 682
- Published Date: Sep 10, 2025
- Report Format: PDF, PPT
- Explore a preview of key market trends and insights
- Review sample data tables and segment breakdowns
- Experience the quality of our visual data representations
- Evaluate our report structure and research methodology
- Get a glimpse of competitive landscape analysis
- Understand how regional forecasts are presented
- Assess the depth of company profiling and benchmarking
- Preview how actionable insights can support your strategy
Explore real data and analysis
Frequently Asked Questions (FAQ)
About this Report
Connect with our Expert


Copyright @ 2026 Research Nester. All Rights Reserved.
