Global Solar Photovoltaic (PV) Market
- An Outline of the Global Solar Photovoltaic Market
- Market Definition and Segmentation
- Study Assumptions and Abbreviations
- Research Methodology & Approach
- Primary Research
- Secondary Research
- Data Triangulation
- SPSS Methodology
- Executive Summary
- Growth Drivers
- Major Roadblocks
- Opportunities
- Prevalent Trends
- Government Regulation
- Growth Outlook
- Competitive White Space Analysis – Identifying Untapped Market Gaps
- Risk Overview
- SWOT
- Technological Advancement
- Technology Maturity Matrix for Solar Photovoltaic Market Recent News
- Regional Demand
- Global Solar Photovoltaic by Geography – Strategic Comparative Analysis
- Strategic Segment Analysis: Solar Photovoltaic Demand Landscape
- Solar Photovoltaic Demand Trends Driven by Sustainability, and Environmentally Friendly Encapsulation Solutions (2026-2036)
- Root Cause Analysis (RCA) for discovering problems of the Solar Photovoltaic Market
- Porter Five Forces
- PESTLE
- Comparative Positioning
- Global Solar Photovoltaic – Key Player Analysis (2036)
- Competitive Landscape: Key Suppliers/Players
- Competitive Model: A Detailed Inside View for Investors
- Company Market Share, 2036 (%)
- First Solar
- Tata Power Solar Systems Ltd.
- Canadian Solar Inc.
- Wuxi Suntech Power Co. Ltd
- NextEra Energy Resources LLC
- BrightSource Energy Inc.
- SunPower Corporation
- Vivaan Solar Pvt. Ltd.
- Waaree Group
- Jinko Solar
- OMCO Solar
- Global Solar Photovoltaic Market Outlook
- Market Overview
- Market Revenue by Value (USD Million), Volume (Million GWh), and Compound Annual Growth Rate (CAGR)
- Solar Photovoltaic Market Segmentation Analysis (2026-2036)
- By Technology
- Crystalline-Silicon (c-Si), Market Value (USD Million), and CAGR, 2026-2036F
- Mono-Crystalline Silicon (Mono-Si), Market Value (USD Million) and CAGR, 2026-2036F
- Poly-Crystalline Silicon (Poly-Si), Market Value (USD Million), and CAGR, 2026-2036F
- Others, Market Value (USD Million) and CAGR, 2026-2036F
- Thin-Film, Market Value (USD Million), and CAGR, 2026-2036F
- Cadmium Telluride (CdTe), Market Value (USD Million), and CAGR, 2026-2036F
- Copper Indium Gallium Selenide (CIGS), Market Value (USD Million), and CAGR, 2026-2036F
- Others, Market Value (USD Million), and CAGR, 2026-2036F
- Others, Market Value (USD Million), and CAGR, 2026-2036F
- Crystalline-Silicon (c-Si), Market Value (USD Million), and CAGR, 2026-2036F
- By Installation Type
- Ground Mounted, Market Value (USD Million), and CAGR, 2026-2036F
- Rooftop, Market Value (USD Million), and CAGR, 2026-2036F
- Floating PV (FPV), Market Value (USD Million), and CAGR, 2026-2036F
- Others, Market Value (USD Million), and CAGR, 2026-2036F
- By End user
- Residential, Market Value (USD Million), and CAGR, 2026-2036F
- Commercial, Market Value (USD Million), and CAGR, 2026-2036F
- Industrial, Market Value (USD Million), and CAGR, 2026-2036F
- Utilities, Market Value (USD Million), and CAGR, 2026-2036F
- Others, Market Value (USD Million), and CAGR, 2026-2036F
- By Component
- Solar Modules (Panels), Market Value (USD Million), and CAGR, 2026-2036F
- Inverters, Market Value (USD Million), and CAGR, 2026-2036F
- Central Inverters, Market Value (USD Million), and CAGR, 2026-2036F
- String Inverters, Market Value (USD Million), and CAGR, 2026-2036F
- Others, Market Value (USD Million), and CAGR, 2026-2036F
- Balance of System (BoS), Market Value (USD Million), and CAGR, 2026-2036F
- Mounting Structures (Racking & Tracking), Market Value (USD Million), and CAGR, 2026-2036F
- Cabling & Connectors, Market Value (USD Million) and CAGR, 2026-2036F
- Monitoring Systems, Value Market (USD Million), and CAGR, 2026-2036F
- Others, Market Value (USD Million), and CAGR 2026-2036F
- Energy Storage Systems
- By Technology
- Market Overview
- Regional Synopsis, Value (USD Million), 2026-2036
- North America Market Value (USD Million) and CAGR & Y-o-Y Growth Trend, 2026-2036F
- Europe Market Value (USD Million) and CAGR & Y-o-Y Growth Trend, 2026-2036F
- Asia Pacific Market Value (USD Million) and CAGR & Y-o-Y Growth Trend, 2026-2036F
- Latin America Market Value (USD Million) and CAGR & Y-o-Y Growth Trend, 2026-2036F
- Middle East and Africa Market Value (USD Million) and CAGR & Y-o-Y Growth Trend, 2026-2036F
- North America Market
- Overview
- Market Value (USD Million), Current and Future Projections, 2026-2036
- Increment $ Opportunity Assessment, 2026-2036
- Segmentation (USD Million), 2026-2036, By
- By Technology
- Crystalline-Silicon (c-Si), Market Value (USD Million), and CAGR, 2026-2036F
- Mono-Crystalline Silicon (Mono-Si), Market Value (USD Million) and CAGR, 2026-2036F
- Poly-Crystalline Silicon (Poly-Si), Market Value (USD Million), and CAGR, 2026-2036F
- Others, Market Value (USD Million) and CAGR, 2026-2036F
- Thin-Film, Market Value (USD Million), and CAGR, 2026-2036F
- Cadmium Telluride (CdTe), Market Value (USD Million), and CAGR, 2026-2036F
- Copper Indium Gallium Selenide (CIGS), Market Value (USD Million), and CAGR, 2026-2036F
- Others, Market Value (USD Million), and CAGR, 2026-2036F
- Others, Market Value (USD Million), and CAGR, 2026-2036F
- Crystalline-Silicon (c-Si), Market Value (USD Million), and CAGR, 2026-2036F
- By Installation Type
- Ground Mounted, Market Value (USD Million), and CAGR, 2026-2036F
- Rooftop, Market Value (USD Million), and CAGR, 2026-2036F
- Floating PV (FPV), Market Value (USD Million), and CAGR, 2026-2036F
- Others, Market Value (USD Million), and CAGR, 2026-2036F
- By End user
- Residential, Market Value (USD Million), and CAGR, 2026-2036F
- Commercial, Market Value (USD Million), and CAGR, 2026-2036F
- Industrial, Market Value (USD Million), and CAGR, 2026-2036F
- Utilities, Market Value (USD Million), and CAGR, 2026-2036F
- Others, Market Value (USD Million), and CAGR, 2026-2036F
- By Component
- Solar Modules (Panels), Market Value (USD Million), and CAGR, 2026-2036F
- Inverters, Market Value (USD Million), and CAGR, 2026-2036F
- Central Inverters, Market Value (USD Million), and CAGR, 2026-2036F
- String Inverters, Market Value (USD Million), and CAGR, 2026-2036F
- Others, Market Value (USD Million), and CAGR, 2026-2036F
- Balance of System (BoS), Market Value (USD Million), and CAGR, 2026-2036F
- Mounting Structures (Racking & Tracking), Market Value (USD Million), and CAGR, 2026-2036F
- Cabling & Connectors, Market Value (USD Million) and CAGR, 2026-2036F
- Monitoring Systems, Value Market (USD Million), and CAGR, 2026-2036F
- Others, Market Value (USD Million), and CAGR 2026-2036F
- Energy Storage Systems
- Country Level Analysis, Value (USD Million)
- U.S. Market Value (USD Million) and CAGR & Y-o-Y Growth Trend, 2026-2036F
- Canada Market Value (USD Million) and CAGR & Y-o-Y Growth Trend, 2026-2036F
- By Technology
- Overview
- Europe Market
- Overview
- Market Value (USD Million), Current and Future Projections, 2026-2036
- Increment $ Opportunity Assessment, 2026-2036
- Segmentation (USD Million), 2026-2036, By
- By Technology
- Crystalline-Silicon (c-Si), Market Value (USD Million), and CAGR, 2026-2036F
- Mono-Crystalline Silicon (Mono-Si), Market Value (USD Million) and CAGR, 2026-2036F
- Poly-Crystalline Silicon (Poly-Si), Market Value (USD Million), and CAGR, 2026-2036F
- Others, Market Value (USD Million) and CAGR, 2026-2036F
- Thin-Film, Market Value (USD Million), and CAGR, 2026-2036F
- Cadmium Telluride (CdTe), Market Value (USD Million), and CAGR, 2026-2036F
- Copper Indium Gallium Selenide (CIGS), Market Value (USD Million), and CAGR, 2026-2036F
- Others, Market Value (USD Million), and CAGR, 2026-2036F
- Others, Market Value (USD Million), and CAGR, 2026-2036F
- Crystalline-Silicon (c-Si), Market Value (USD Million), and CAGR, 2026-2036F
- By Installation Type
- Ground Mounted, Market Value (USD Million), and CAGR, 2026-2036F
- Rooftop, Market Value (USD Million), and CAGR, 2026-2036F
- Floating PV (FPV), Market Value (USD Million), and CAGR, 2026-2036F
- Others, Market Value (USD Million), and CAGR, 2026-2036F
- By End user
- Residential, Market Value (USD Million), and CAGR, 2026-2036F
- Commercial, Market Value (USD Million), and CAGR, 2026-2036F
- Industrial, Market Value (USD Million), and CAGR, 2026-2036F
- Utilities, Market Value (USD Million), and CAGR, 2026-2036F
- Others, Market Value (USD Million), and CAGR, 2026-2036F
- By Component
- Solar Modules (Panels), Market Value (USD Million), and CAGR, 2026-2036F
- Inverters, Market Value (USD Million), and CAGR, 2026-2036F
- Central Inverters, Market Value (USD Million), and CAGR, 2026-2036F
- String Inverters, Market Value (USD Million), and CAGR, 2026-2036F
- Others, Market Value (USD Million), and CAGR, 2026-2036F
- Balance of System (BoS), Market Value (USD Million), and CAGR, 2026-2036F
- Mounting Structures (Racking & Tracking), Market Value (USD Million), and CAGR, 2026-2036F
- Cabling & Connectors, Market Value (USD Million) and CAGR, 2026-2036F
- Monitoring Systems, Value Market (USD Million), and CAGR, 2026-2036F
- Others, Market Value (USD Million), and CAGR 2026-2036F
- Energy Storage Systems
- Country Level Analysis, Value (USD Million)
- UK Market Value (USD Million) and CAGR & Y-o-Y Growth Trend, 2026-2036F
- Germany Market Value (USD Million) and CAGR & Y-o-Y Growth Trend, 2026-2036F
- France Market Value (USD Million) and CAGR & Y-o-Y Growth Trend, 2026-2036F
- Italy Market Value (USD Million) and CAGR & Y-o-Y Growth Trend, 2026-2036F
- Spain Market Value (USD Million) and CAGR & Y-o-Y Growth Trend, 2026-2036F
- Netherlands Market Value (USD Million) and CAGR & Y-o-Y Growth Trend, 2026-2036F
- Russia Market Value (USD Million) and CAGR & Y-o-Y Growth Trend, 2026-2036F
- Switzerland Market Value (USD Million) and CAGR & Y-o-Y Growth Trend, 2026-2036F
- Poland Market Value (USD Million) and CAGR & Y-o-Y Growth Trend, 2026-2036F
- Belgium Market Value (USD Million) and CAGR & Y-o-Y Growth Trend, 2026-2036F
- Rest of Europe Market Value (USD Million) and CAGR & Y-o-Y Growth Trend, 2026-2036F
- By Technology
- Overview
- Asia Pacific Market
- Overview
- Market Value (USD Million), Current and Future Projections, 2026-2036
- Increment $ Opportunity Assessment, 2026-2036
- Segmentation (USD Million), 2026-2036, By
- By Technology
- Crystalline-Silicon (c-Si), Market Value (USD Million), and CAGR, 2026-2036F
- Mono-Crystalline Silicon (Mono-Si), Market Value (USD Million) and CAGR, 2026-2036F
- Poly-Crystalline Silicon (Poly-Si), Market Value (USD Million), and CAGR, 2026-2036F
- Others, Market Value (USD Million) and CAGR, 2026-2036F
- Thin-Film, Market Value (USD Million), and CAGR, 2026-2036F
- Cadmium Telluride (CdTe), Market Value (USD Million), and CAGR, 2026-2036F
- Copper Indium Gallium Selenide (CIGS), Market Value (USD Million), and CAGR, 2026-2036F
- Others, Market Value (USD Million), and CAGR, 2026-2036F
- Others, Market Value (USD Million), and CAGR, 2026-2036F
- Crystalline-Silicon (c-Si), Market Value (USD Million), and CAGR, 2026-2036F
- By Installation Type
- Ground Mounted, Market Value (USD Million), and CAGR, 2026-2036F
- Rooftop, Market Value (USD Million), and CAGR, 2026-2036F
- Floating PV (FPV), Market Value (USD Million), and CAGR, 2026-2036F
- Others, Market Value (USD Million), and CAGR, 2026-2036F
- By End user
- Residential, Market Value (USD Million), and CAGR, 2026-2036F
- Commercial, Market Value (USD Million), and CAGR, 2026-2036F
- Industrial, Market Value (USD Million), and CAGR, 2026-2036F
- Utilities, Market Value (USD Million), and CAGR, 2026-2036F
- Others, Market Value (USD Million), and CAGR, 2026-2036F
- By Component
- Solar Modules (Panels), Market Value (USD Million), and CAGR, 2026-2036F
- Inverters, Market Value (USD Million), and CAGR, 2026-2036F
- Central Inverters, Market Value (USD Million), and CAGR, 2026-2036F
- String Inverters, Market Value (USD Million), and CAGR, 2026-2036F
- Others, Market Value (USD Million), and CAGR, 2026-2036F
- Balance of System (BoS), Market Value (USD Million), and CAGR, 2026-2036F
- Mounting Structures (Racking & Tracking), Market Value (USD Million), and CAGR, 2026-2036F
- Cabling & Connectors, Market Value (USD Million) and CAGR, 2026-2036F
- Monitoring Systems, Value Market (USD Million), and CAGR, 2026-2036F
- Others, Market Value (USD Million), and CAGR 2026-2036F
- Energy Storage Systems
- Country Level Analysis, Value (USD Million)
- China Market Value (USD Million) and CAGR & Y-o-Y Growth Trend, 2026-2036F
- India Market Value (USD Million) and CAGR & Y-o-Y Growth Trend, 2026-2036F
- South Korea Market Value (USD Million) and CAGR & Y-o-Y Growth Trend, 2026-2036F
- Australia Market Value (USD Million) and CAGR & Y-o-Y Growth Trend, 2026-2036F
- Indonesia Market Value (USD Million) and CAGR & Y-o-Y Growth Trend, 2026-2036F
- Malaysia Market Value (USD Million) and CAGR & Y-o-Y Growth Trend, 2026-2036F
- Vietnam Market Value (USD Million) and CAGR & Y-o-Y Growth Trend, 2026-2036F
- Thailand Market Value (USD Million) and CAGR & Y-o-Y Growth Trend, 2026-2036F
- Singapore Market Value (USD Million) and CAGR & Y-o-Y Growth Trend, 2026-2036F
- New Zealand Market Value (USD Million) and CAGR & Y-o-Y Growth Trend, 2026-2036F
- Rest of Asia Pacific Excluding Japan Market Value (USD Million) and CAGR & Y-o-Y Growth Trend, 2026-2036F
- By Technology
- Overview
- Latin America Market
- Overview
- Market Value (USD Million), Current and Future Projections, 2026-2036
- Increment $ Opportunity Assessment, 2026-2036
- Year-on-Year Growth Forecast (%)
- Segmentation (USD Million), 2026-2036, By
- By By Technology
- Crystalline-Silicon (c-Si), Market Value (USD Million), and CAGR, 2026-2036F
- Mono-Crystalline Silicon (Mono-Si), Market Value (USD Million) and CAGR, 2026-2036F
- Poly-Crystalline Silicon (Poly-Si), Market Value (USD Million), and CAGR, 2026-2036F
- Others, Market Value (USD Million) and CAGR, 2026-2036F
- Thin-Film, Market Value (USD Million), and CAGR, 2026-2036F
- Cadmium Telluride (CdTe), Market Value (USD Million), and CAGR, 2026-2036F
- Copper Indium Gallium Selenide (CIGS), Market Value (USD Million), and CAGR, 2026-2036F
- Others, Market Value (USD Million), and CAGR, 2026-2036F
- Others, Market Value (USD Million), and CAGR, 2026-2036F
- Crystalline-Silicon (c-Si), Market Value (USD Million), and CAGR, 2026-2036F
- By Installation Type
- Ground Mounted, Market Value (USD Million), and CAGR, 2026-2036F
- Rooftop, Market Value (USD Million), and CAGR, 2026-2036F
- Floating PV (FPV), Market Value (USD Million), and CAGR, 2026-2036F
- Others, Market Value (USD Million), and CAGR, 2026-2036F
- By End user
- Residential, Market Value (USD Million), and CAGR, 2026-2036F
- Commercial, Market Value (USD Million), and CAGR, 2026-2036F
- Industrial, Market Value (USD Million), and CAGR, 2026-2036F
- Utilities, Market Value (USD Million), and CAGR, 2026-2036F
- Others, Market Value (USD Million), and CAGR, 2026-2036F
- By Component
- Solar Modules (Panels), Market Value (USD Million), and CAGR, 2026-2036F
- Inverters, Market Value (USD Million), and CAGR, 2026-2036F
- Central Inverters, Market Value (USD Million), and CAGR, 2026-2036F
- String Inverters, Market Value (USD Million), and CAGR, 2026-2036F
- Others, Market Value (USD Million), and CAGR, 2026-2036F
- Balance of System (BoS), Market Value (USD Million), and CAGR, 2026-2036F
- Mounting Structures (Racking & Tracking), Market Value (USD Million), and CAGR, 2026-2036F
- Cabling & Connectors, Market Value (USD Million) and CAGR, 2026-2036F
- Monitoring Systems, Value Market (USD Million), and CAGR, 2026-2036F
- Others, Market Value (USD Million), and CAGR 2026-2036F
- Energy Storage Systems
- Country Level Analysis, Value (USD Million)
- Brazil Market Value (USD Million) and CAGR & Y-o-Y Growth Trend, 2026-2036F
- Argentina Market Value (USD Million) and CAGR & Y-o-Y Growth Trend, 2026-2036F
- Mexico Market Value (USD Million) and CAGR & Y-o-Y Growth Trend, 2026-2036F
- Rest of Latin America Market Value (USD Million) and CAGR & Y-o-Y Growth Trend, 2026-2036F
- By By Technology
- Overview
- Middle East & Africa Market
- Overview
- Market Value (USD Million), Current and Future Projections, 2026-2036
- Increment $ Opportunity Assessment, 2026-2036
- Year-on-Year Growth Forecast (%)
- Segmentation (USD Million), 2026-2036, By
- By Technology
- Crystalline-Silicon (c-Si), Market Value (USD Million), and CAGR, 2026-2036F
- Mono-Crystalline Silicon (Mono-Si), Market Value (USD Million) and CAGR, 2026-2036F
- Poly-Crystalline Silicon (Poly-Si), Market Value (USD Million), and CAGR, 2026-2036F
- Others, Market Value (USD Million) and CAGR, 2026-2036F
- Thin-Film, Market Value (USD Million), and CAGR, 2026-2036F
- Cadmium Telluride (CdTe), Market Value (USD Million), and CAGR, 2026-2036F
- Copper Indium Gallium Selenide (CIGS), Market Value (USD Million), and CAGR, 2026-2036F
- Others, Market Value (USD Million), and CAGR, 2026-2036F
- Others, Market Value (USD Million), and CAGR, 2026-2036F
- Crystalline-Silicon (c-Si), Market Value (USD Million), and CAGR, 2026-2036F
- By Installation Type
- Ground Mounted, Market Value (USD Million), and CAGR, 2026-2036F
- Rooftop, Market Value (USD Million), and CAGR, 2026-2036F
- Floating PV (FPV), Market Value (USD Million), and CAGR, 2026-2036F
- Others, Market Value (USD Million), and CAGR, 2026-2036F
- By End user
- Residential, Market Value (USD Million), and CAGR, 2026-2036F
- Commercial, Market Value (USD Million), and CAGR, 2026-2036F
- Industrial, Market Value (USD Million), and CAGR, 2026-2036F
- Utilities, Market Value (USD Million), and CAGR, 2026-2036F
- Others, Market Value (USD Million), and CAGR, 2026-2036F
- By Component
- Solar Modules (Panels), Market Value (USD Million), and CAGR, 2026-2036F
- Inverters, Market Value (USD Million), and CAGR, 2026-2036F
- Central Inverters, Market Value (USD Million), and CAGR, 2026-2036F
- String Inverters, Market Value (USD Million), and CAGR, 2026-2036F
- Others, Market Value (USD Million), and CAGR, 2026-2036F
- Balance of System (BoS), Market Value (USD Million), and CAGR, 2026-2036F
- Mounting Structures (Racking & Tracking), Market Value (USD Million), and CAGR, 2026-2036F
- Cabling & Connectors, Market Value (USD Million) and CAGR, 2026-2036F
- Monitoring Systems, Value Market (USD Million), and CAGR, 2026-2036F
- Others, Market Value (USD Million), and CAGR 2026-2036F
- Energy Storage Systems
- Country Level Analysis, Value (USD Million)
- Saudi Arabia Market Value (USD Million) and CAGR & Y-o-Y Growth Trend, 2026-2036F
- UAE Market Value (USD Million) and CAGR & Y-o-Y Growth Trend, 2026-2036F
- Israel Market Value (USD Million) and CAGR & Y-o-Y Growth Trend, 2026-2036F
- Qatar Market Value (USD Million) and CAGR & Y-o-Y Growth Trend, 2026-2036F
- Kuwait Market Value (USD Million) and CAGR & Y-o-Y Growth Trend, 2026-2036F
- Oman Market Value (USD Million) and CAGR & Y-o-Y Growth Trend, 2026-2036F
- South Africa Market Value (USD Million) and CAGR & Y-o-Y Growth Trend, 2026-2036F
- Rest of Middle East & Africa Market Value (USD Million) and CAGR & Y-o-Y Growth Trend, 2026-2036F
- By Technology
- Overview
- Global Economic Scenario
- World Economic Outlook
- About Research Nester
- Our Global Clientele
- We Serve Clients Across World
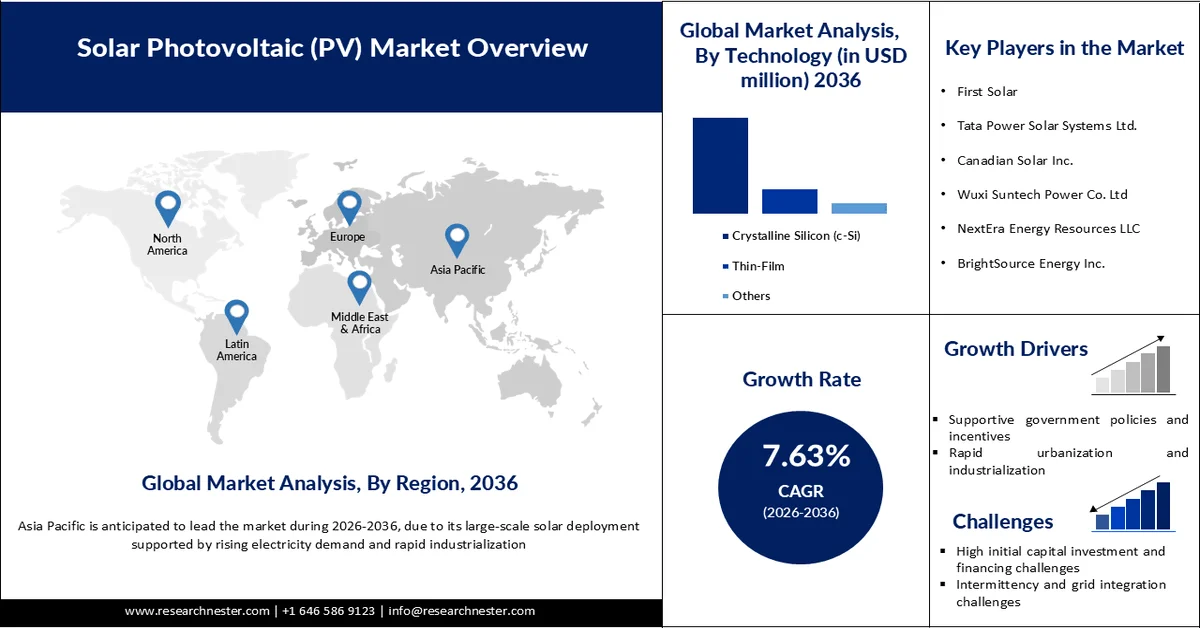
Solar Photovoltaic (PV) Market Outlook:
Solar Photovoltaic (PV) Market size is valued at USD 979.9 billion in 2025 and is anticipated to surpass USD 2.24 trillion by 2036, expanding at a CAGR of 7.63% during the forecast period, i.e., 2026 to 2036. In 2026, the industry size of solar photovoltaic is estimated at USD 1.07 trillion.
The primary driver of the global solar PV market is the rapid expansion of cost-effective manufacturing capacity, supported by substantial investments and the accelerating transition to clean energy. China has invested more than USD 50 billion in domestic PV production and supply capacity, which is nearly ten times higher than Europe, and currently accounts for over 80% of global PV component production, expected to reach 95% during the forecast period. This dominance has significantly reduced production costs and improved global accessibility of solar technologies in the solar PV market. At the same time, solar energy is evolving into a mainstream power source, with projections indicating that it could supply 40% of U.S. electricity demand by 2035. The sector is also generating strong economic momentum, currently employing over 230,000 people in the U.S. and expected to create between 500,000 and 1,500,000 jobs by 2030. These developments highlight how large-scale manufacturing, declining costs, and increasing adoption of decarbonization across industries are collectively driving the growth of the global solar PV market.
Global Solar Deployment and Capacity Additions:
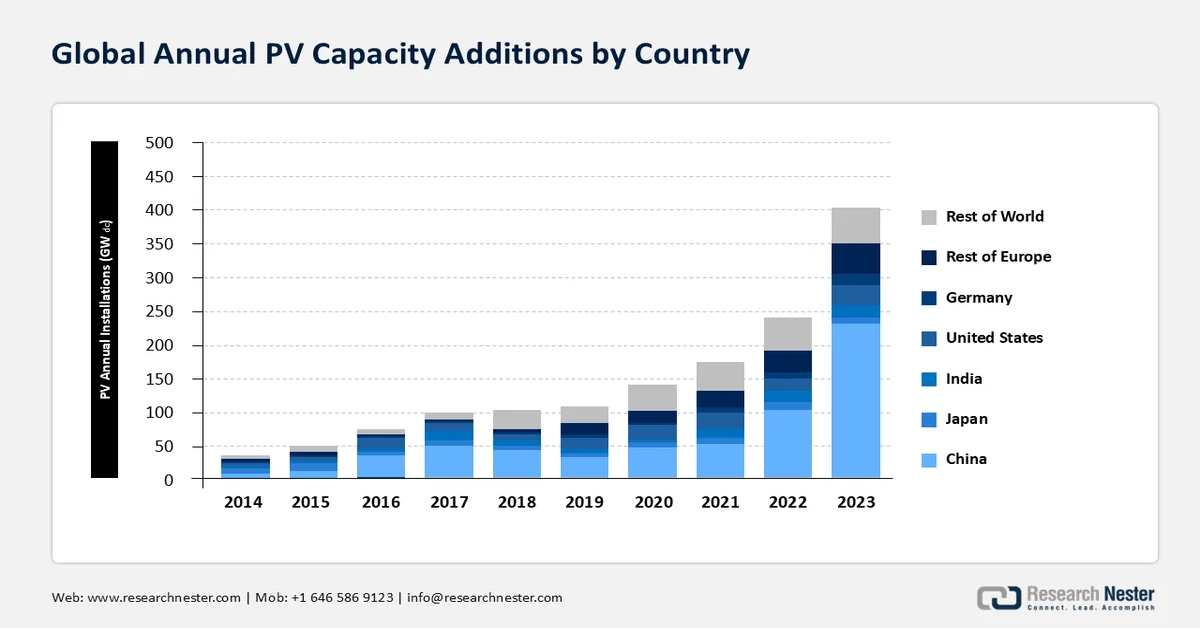
Source: NERL Spring 2024 Report
IEA reported that in 2023, around 446 GWdc of PV was deployed worldwide, bringing cumulative PV capacity addition so far to 1.6 TWdc. With China’s dominance in the global solar photovoltaic (PV) market, a whopping 60% of installations came from the country in 2023, while Italy and Germany showcased a 2x growth in installations. The rest of the world experienced a 30% y-o-y growth, and the U.S. held the second-largest solar photovoltaic market share in terms of annual deployment and installations. Research Nester analysts project that cumulative global photovoltaic installations will reach up to 5 TWdc by 2030 and 15 TWdc by 2050. Mono c-Si technology-based PV shipments were 35% in 2015 and reached 98% in 2023, while n-type mono c-Si was 63% of total PV shipments, increasing from 5% in 2019 to 51% in 2022.
PV System and Component Pricing:
The median system costs of large-scale utility-owned photovoltaic systems in 2023 were USD 1.27/Wac (relatively flat since 2018), and the residential PV systems by median price as reported by EnergySage reached USD 2.8/Wdc, a 6.3% y-o-y surge. Global polysilicon spot prices in 2023 as of late April were USD 6.76/kg, which was a 22% drop from mid-January (USD 8.70/kg), thus registering the lowest price observed over the last decade. The recent slump in module prices worldwide leveled off at USD 0.11/Wdc in Q1 2024. The U.S. average module price in Q4 2023 was USD 0.31/Wdc, representing a 5% q-o-q and 22% y-o-y decrease in the country module pricing.
Supply chain mapping:
Component manufacturing and trade dynamics in key countries
Solar PV market is a cornerstone of clean electricity generation and overarches the goal of achieving sustainable energy transition and net-zero emissions by 2050. The PV supply chain starts with the refinement of polycrystalline silicon or polysilicon, derived from metallurgical-grade silicon (MGS) and crystalline silicon (c-Si). Approximately 96% of global PV module shipments in 2020 used c-Si technology, made from melting polysilicon chunks into ingots, slicing them into thin wafers, and converting the wafers into PV cells and PV modules. Other PV modules use cadmium telluride (CdTe) technology, with higher adoption in the U.S. (16% compared to 4% worldwide) and c-Si representing the other 84%.
The U.S. PV Supply Chain Dynamics:
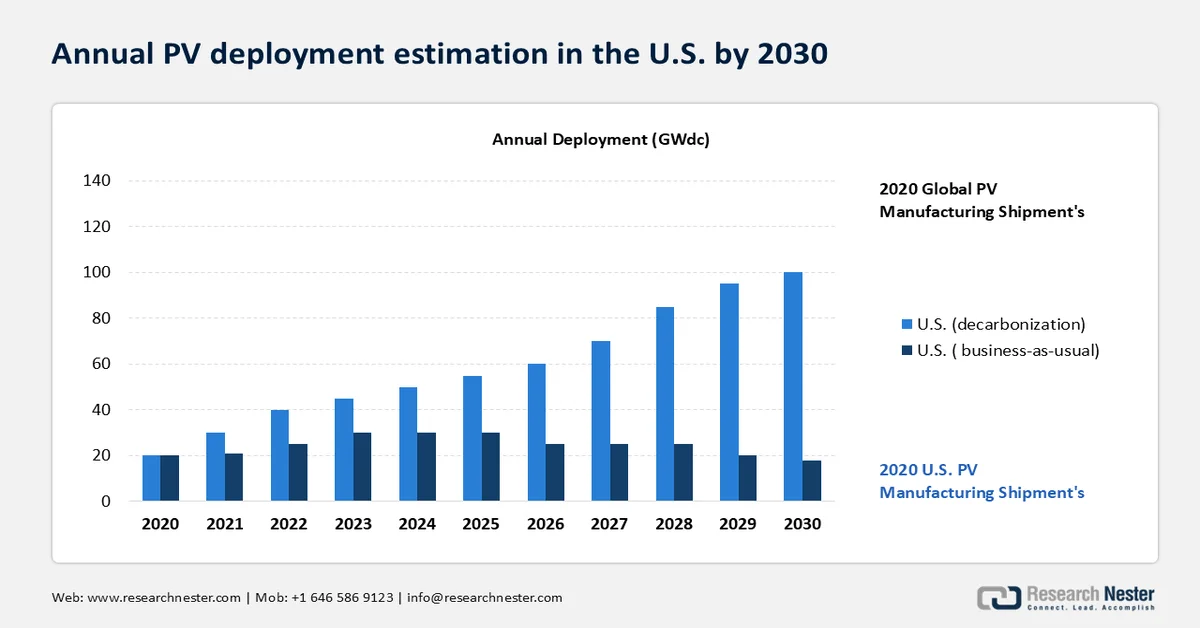
Solar PV market play a pivotal role in the U.S. efforts to reduce GHG emissions and minimize the impact of climate change. Decades of innovation and significant cost reductions so far have made PV one of the most affordable forms of electricity generation. In regards to decoupling from China’s raw material supply and its influence on the U.S. manufacturing sector, the country is striving to bring the PV supply chain in-house. The U.S. has a certain thin-film CdTe module production capacity that does not rely on obtaining raw materials from China. Over 16% of CdTe module installations are all supplied by a single U.S. company that also produced one-third of those CdTe modules in the U.S. Given the rate at which the economy is inching toward decarbonization, it is unlikely that any alternate technology, including CdTe, could fully displace conventional electricity generation before 2050.
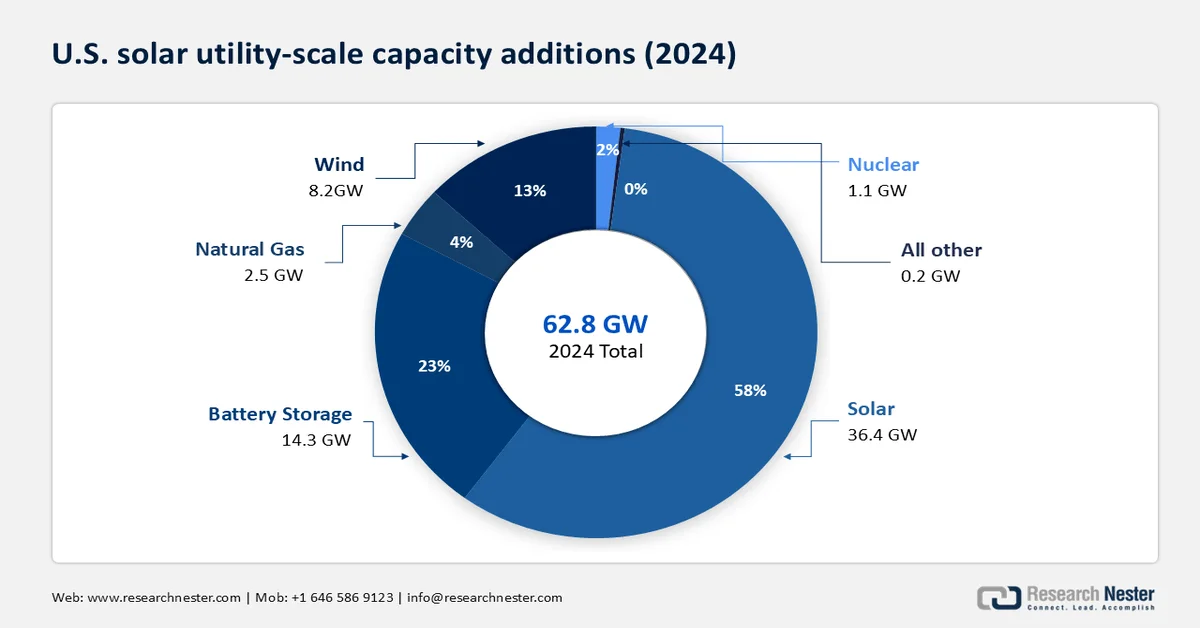
Solar power represented 5% of the energy generation capacity addition in 2010, and as of 2024, its share rose to 58%, accounting for a whopping 36.4 GW of 62.8 GW total electricity generated in the U.S. (almost double that of 18.4 GW in 2023). As described in the following graph, it is estimated that in a business-as-usual case, the global shipments will reach 200 GWdc by 2030, and in a global decarbonization scenario, they could grow to over 500 GWdc by 2030.
Domestic Production of Feedstocks, Ingots, and Wafers in 2022
|
Key Players/ Manufacturers |
Process & technology |
Total Production (Tons) |
|
DC Alabama |
Silicon feedstock |
42,000 |
|
Globe Metallurgical |
Silicon feedstock |
16,000 |
|
Mississippi Silicon |
Silicon feedstock |
36,000 |
|
WVA Manufacturing |
Silicon feedstock |
73,000 |
|
Globe Metallurgical |
Silicon feedstock |
24,000 |
|
Hemlock Semiconductor Corporation |
Polysilicon (Siemens) |
32,000 |
|
Wacker Polysilicon |
Polysilicon (Siemens) |
19,000 |
|
REC Silicon |
Silanes |
2,000 |
|
CubicPV |
c-Si Wafers |
Not Available (20 MWdc/yr capacity) |
Electricity decarbonization in the U.S. will require a significant acceleration in annual PV deployment. Under an aggressive decarbonization scenario, solar installations are expected to quadruple by 2030 compared to 19 GWdc in 2020. According to SEIA, 40.3 GWdc of PV capacity was installed in 2023, bringing cumulative capacity to 186.5 GWdc. While adoption is increasing, solar accounted for only 5.6% of total electricity generation and 11.2% of net summer capacity in 2023. Around 22 states generated at least 5% of their electricity from solar, with California leading at 28.2%. In parallel, energy storage deployment is rising rapidly, with 26.0 GWh or 8.8 GWac added to the grid in 2023, marking a 34% year-over-year increase. Looking ahead, global PV shipments are projected to reach around 200 GWdc under a business-as-usual scenario, while a full decarbonization pathway could push installations beyond 500 GWdc by 2030, highlighting the scale of growth required to meet climate targets.
Strategies, Actions, and Recommendations:
Production Tax Credit (PTC) and Investment Tax Credit (ITC) are the primary framework policies in the U.S. However, the most prominent change in direct support policies was implemented in 2022 with the introduction of the Inflation Reduction Act (IRA), a federal law for loans, grants, and tax credit expansions. This has been pivotal for small- and large-scale PV manufacturing and installations in a socially equitable manner. The law has sanctioned USD 370 billion in investments, and the U.S. EPA’s GHG Reduction Fund has allocated USD 7 billion in grants.
The IRA offers the following solar production incentives
|
Component |
Tax Credits |
|
Solar cells |
USD 0,04/watt |
|
Wafers |
USD 12/m3 |
|
Polysilicon |
USD 3/kg |
|
(must be 99.9% pure) |
|
|
Backsheets |
USD 0,40/m2 |
|
Modules |
USD 0,07/watt |
|
Inverters |
Varies |
|
Torque tubes (trackers) |
USD 0,87/kg |
|
Structural fasteners |
USD 2,28/kg |
Source: The European Technology and Innovation Platform for Photovoltaics
Summary of the tax credits applicable to PV within the scope of IRA. MPTC = Manufacturing Production Tax Credit, PTC = Production Tax Credit, ITC = Investment Tax Credit, GHG = greenhouse gas
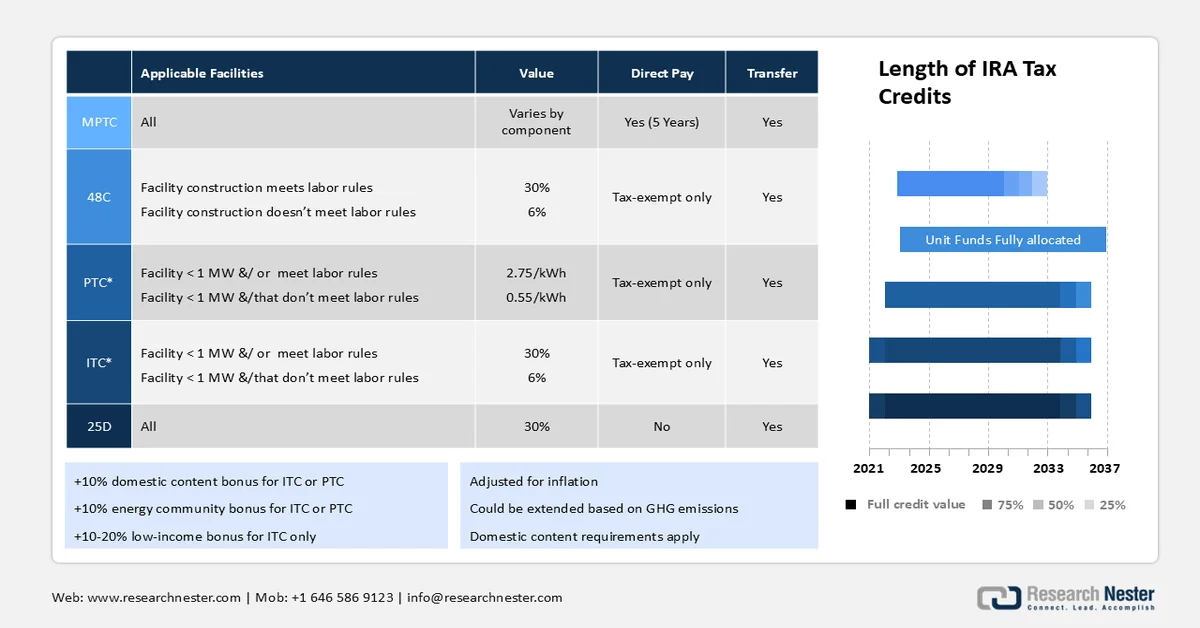
Source: The European Technology and Innovation Platform for Photovoltaics
The c-Si module assembly began in the U.S. in 2018 using imported cells, and by 2020, 4.3 GWdc of PV modules were assembled, with 24% over 2019. This growth was primarily led by First Solar’s strategic doubling of production capacity. As the PV demand continues to grow, more opportunities to further domestic manufacturing are set to surface. In the wake of import restrictions implemented in 2021, potentially traceable to China-based companies, will inevitably strengthen the U.S. PV supply chain. Some of the prominent polysilicon companies in the country include Michigan-based Hemlock (with 35,000 MT of annual production capacity); Wacker (with 20,000 MT) operating in Tennessee; REC Silicon (with a 16,000 MT plant in Washington and a 4,000 MT capacity plant in Montana), and Alabama-based Mitsubishi (with 1,500 MT). Hemlock, REC, and Wacker have been awarded tax credits under Section 48C, which subsequently helped in the expansion of polysilicon production capacity.
 Source: EIA
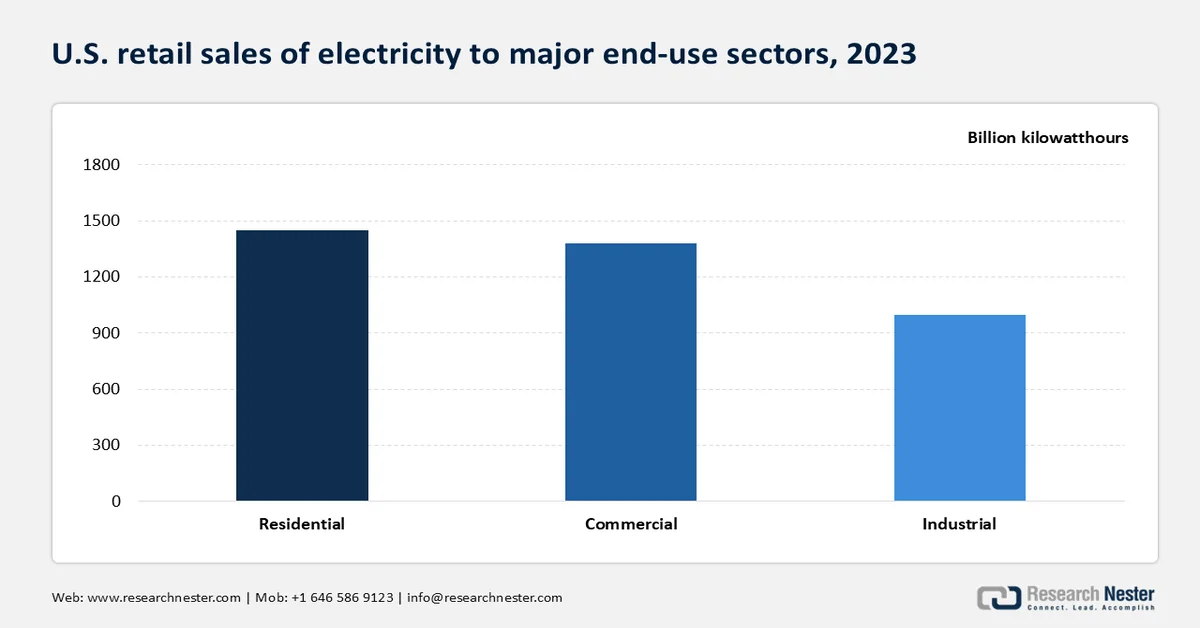
According to the EIA, the U.S. retail electricity sales were USD 3,861 billion, a notable rise from USD 66 billion in 2022. Retail sales comprise net imports or imports minus exports of electricity from Mexico and Canada.
Electricity sales to U.S. retail-electricity customers and percentage shares of total sales (2023)
|
End user |
Sales in volume (USD billion kWh) |
Shares |
|
Residential |
1,455 billion kWh |
38% |
|
Commercial |
1,375 billion kWh |
36% |
|
Industrial |
1,025 billion kWh |
27% |
|
Transportation |
7 billion kWh |
<1% |
Comparative Analysis of Manufacturing Capacity of PV Components:
A top-down analysis of Polysilicon production
High-purity polysilicon is typically obtained by refining metallurgical-grade silicon, which is used to make solar wafers, silicones, semiconductors, and aluminum alloys. To ensure supply and purity levels, MGS suppliers often backward integrate and own a significant portion of the quartz mines. Furthermore, MSG processing is typically energy-intensive, making it imperative to be produced in locations with abundant and affordable electricity sources such as Malaysia, Norway, the U.S., and the Xinjiang region of China. Presently, China dominates that solar photovoltaic market with over 70% of the worldwide MGS production capacity, and ten Chinese companies account for 35% of domestic capacity, whereas the top five hold approximately 25%.
Source: the U.S. DOE
c-Si and CdTe production and global trade:
More than 75% of the c-Si and CdTe modules imported by the U.S. in 2020 came from just three Southeast Asian countries- Vietnam, Malaysia, and Thailand, and the remainder from South Korea. These Southeast Asian countries rely heavily on an upstream Chinese supply chain. The U.S., as of 2020, had limited silicon solar cell operating capacity. However, the following upstream manufacturing in the U.S. gained traction and proved pivotal in the country’s surging solar demand. According to the SEIA, 8.6 GW worth of installation was completed in 2019, showcasing a 21% year-over-year growth.
Source: NREL update of (Smith et al. 2021)
Owing to gaps in the global PV supply chain, such as high capital expenditure and labor costs, virtually all c-Si raw materials and components are imported to Western nations from Southeast Asian countries. These import costs add around 11% to the total manufacturing expenses. A build-up in the domestic PV supply chain would significantly reduce these costs. There are pathways to cut down the cost delta with automation in wafer and ingot assembly lines. In February 2024, First Solar announced its plans to invest USD 10 billion in CdTe thin film in the U.S. Retrospective figures from 2023 added USD 2.75 billion in value to the module production capacity, USD 900 million in economic value, and USD 2 billion in output.
Ingots and Wafers
Ten Chinese companies manufactured 98% of the overall solar wafers in 2020, of which three companies- LONGi, GCL, and Zhonghuan garnered 71% of the produced capacity. From 2016 to 2020, the abovementioned companies grew their collective capacity to 173 GWdc (58% of global capacity) from 29 GWdc (29% of global capacity). This trend was followed by the rapid growth in the monocrystalline PV modules solar photovoltaic market share. Furthermore, seven Chinese provinces were assigned 10 GWdc of wafer production capacity. Notably, Jiangsu, located in the north of Shanghai, accounted for 28% of China’s total wafer capacity, while outside of China, East Asia contributes 10 GWdc of global wafer capacity. China-based Jinko Solar announced its plans to build a 7 GWdc wafer and ingot facility in Vietnam. This aims at streamlining cell production operations in Malaysia and module assembly in the U.S. The company stated initiation of the project was made in 2020 to bypass U.S. trade restrictions on imported materials. This strategic expansion underscores the company’s efforts to build a robust supply chain while navigating the changing trade dynamics.
Module and Cells
Since the implementation of new manufacturing tax credits, there has been a significant influx of investments to build and expand the entire solar module supply chain, including ingots, modules, wafers, and cells. Before the enactment of the federal manufacturing incentives, there was roughly 16.6GW or 41,500 MT/year of polysilicon capacity and 7 GW/year of module capacity. Cell manufacturing was onshored for the first time since 2019, and it is expected that additional cell capacity will come online by the end of 2025. To date, there has been a steep growth in module production, climbing from 7 GW before the federal manufacturing tax credits to 44.4 GW in December 2024, marking a rise of over 500%.
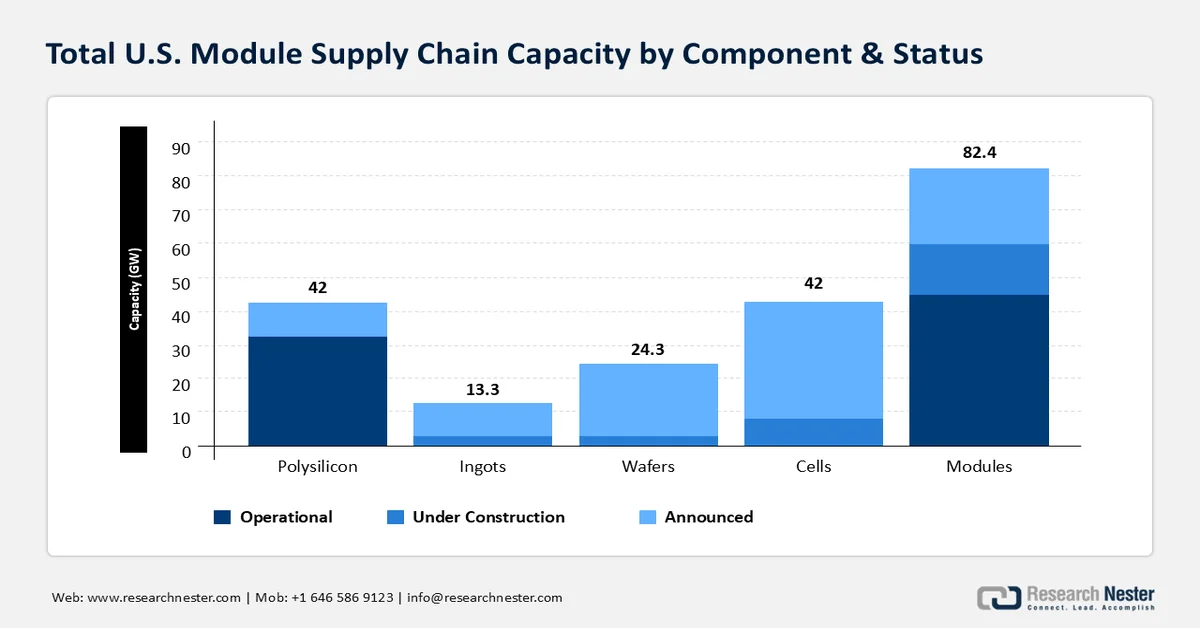
The total U.S. module supply chain, including operational, under-construction, and announced projects, reached an estimated value of 81.6 GW. The establishment of the PV module supply chain is a sluggish process due to conformance periods, permits, construction, and commissioning. The further up the supply chain ladder, the longer the building time. New factory expansions are anticipated to continue over the next several years.
The exponential growth in the solar PV market is positively influencing the global semiconductor solar photovoltaic market. In 2022, devices were the world's 33rd most traded product, with an overall trade of USD 87.7 billion. Between 2021 and 2022, photovoltaic/photosensitive/LED semiconductor grew by 21.9%, from USD 72B to USD 87.7B, representing 0.37% of total world trade.
Yearly growth of Photovoltaic & LED Semiconductor Devices global trade
|
Year |
Trade value (in USD billion) |
|
2019 |
56 |
|
2020 |
57.4 |
|
2021 |
72 |
|
2022 |
87.7 |
Source: OEC
Photovoltaic/LED Semiconductor Devices Global Trade
|
Country |
Exports |
Imports |
||||
|
|
Total Trade Value |
Market Share |
Total Trade Value |
Market Share |
||
|
China |
USD 44.7 Billion |
51% |
USD 6.6 Billion |
3.19% |
||
|
Vietnam |
USD 6.83 Billion |
7.79% |
USD 693 Million |
1.55% |
||
|
Malaysia |
USD 4.92 Billion |
5.61% |
USD 321 Million |
0.72% |
||
|
Japan |
USD 4.01 Billion |
4.57% |
USD 2.05 Billion |
4.58% |
||
|
Germany |
USD 3.52 Billion |
4.01% |
USD 5.03 Billion |
5.73% |
||
|
The U.S. |
USD 2.08 Billion |
2.37% |
USD 13.2 Billion |
15.10% |
||
Source: OEC
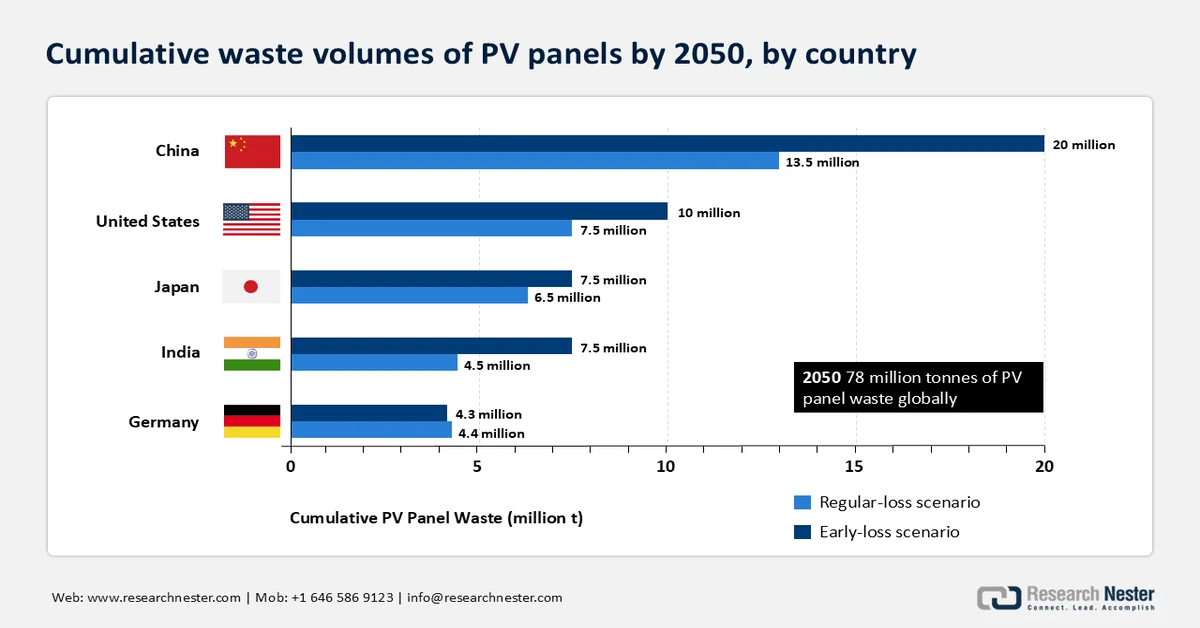
Photovoltaic End of Life (EOL)
Rising focus on decarbonizing electricity grids has proportionately ramped up solar energy generation and storage capacities across the world. For context, to meet decarbonization goals, the U.S. must install 30 GWac every year from 2025 to 2030. 19 GW of solar capacity was installed in 2021, and the cumulative capacity has reached 100 GW in the U.S. This signifies that installation of new systems is likely to surge at a steep rate in the forthcoming years.
While the lifespan of a PV system is about 25-35 years, some system components, including modules, are already entering the waste stream. Moreover, modules reach end-of-life owing to weather damage, manufacturing serial defects, or installation errors. Yearly PV module EOL volume reaches up to 12% of the annual municipal electronic waste in the U.S. by the end of 2050. 99% of PV module materials are non-hazardous, and 95% are fully recyclable with available technologies. This sets a robust foundation for low-impact and safe EOL material handling methods. Presently, EOL handling processes are unfavorable to recycling. PV modules recycling cost to waste generators is USD 15- USD 45 per module, which is significantly higher than the landfill fee of USD 1-USD 5 for each module. This, in turn, is likely to impact federal and state policies on how waste is processed.
Source: IRENA
Action Plan Coverage
In June 2021, the Solar Energy Technologies Office (SETO) issued an RFI to solicit feedback from the PV waste management communities regarding key challenges in EOL processing. The responses, expert interviews, and literature reviews were used to identify potential research areas to streamline and optimize PV EOL practices. Responses emphasized the role of policy in EOL handling and developing separation technologies to enhance materials recovery.
With stakeholder input on prevalent challenges in hardware design, data collection and analysis, and identifying DOE’s role in EOL management, SETO, in 2021, rolled out a five-year action plan.
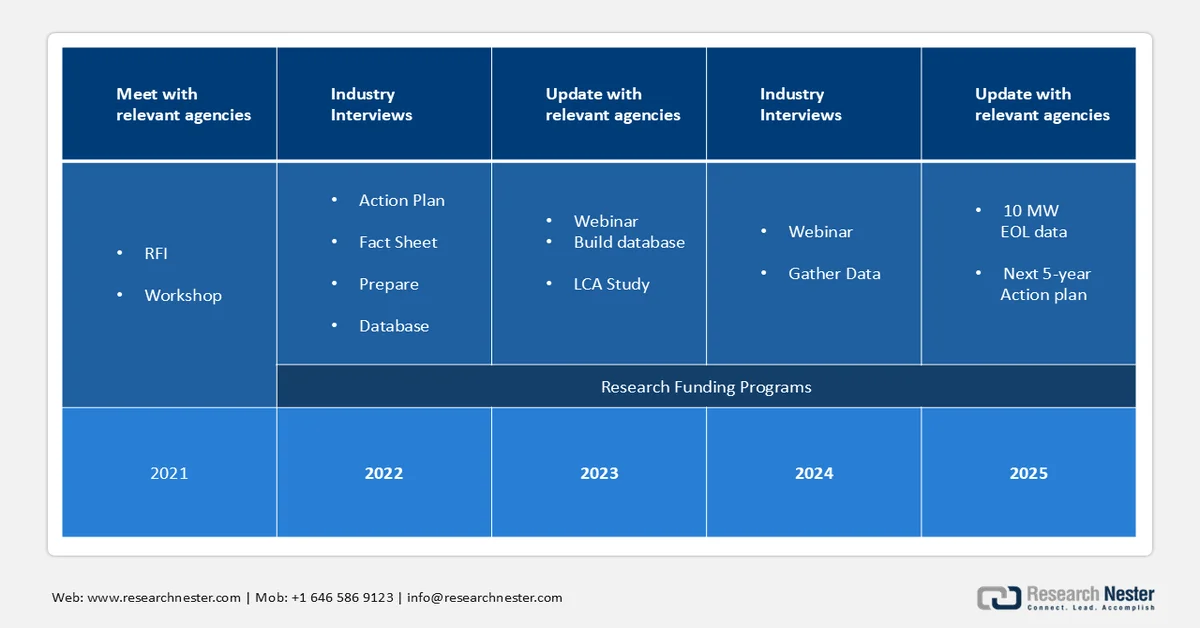
The 2021 multi-year program plan was established based on the 2021 PV EOL workshop and RFI feedback. It focuses on the following enablers of a circular economy:
- Data gathering & analysis: Based on modeled waste volume and handling, the need for realistic collection, sorting, transportation, and materials reclamation is evident. SETO aims to establish a standalone database with 10 MW of PV EOL data collected by the end of 2025 and implement comprehensive data standards. Furthermore, non-confidential data will be made publicly accessible to the waste management, solar, and policy communities.
- Hardware development & process research: SETO emphasizes improving the raw materials and energy usage efficiency to, in turn, minimize the resources required to process EOL materials and extend component lifespan. It recommends that steel, Cu, and Al be sold to scrap metal solar photovoltaic markets at EOL. However, recovering silver from the metallization and separating polymers and composites, including back sheets, are some of the areas where materials recovery may be challenging. Research into enhancing the recovery rate, while minimizing the recovery cost burden, is expected to help shift the economics of solar PV recycling.
Key Solar Photovoltaic (PV) Market Insights Summary:
Regional Highlights:
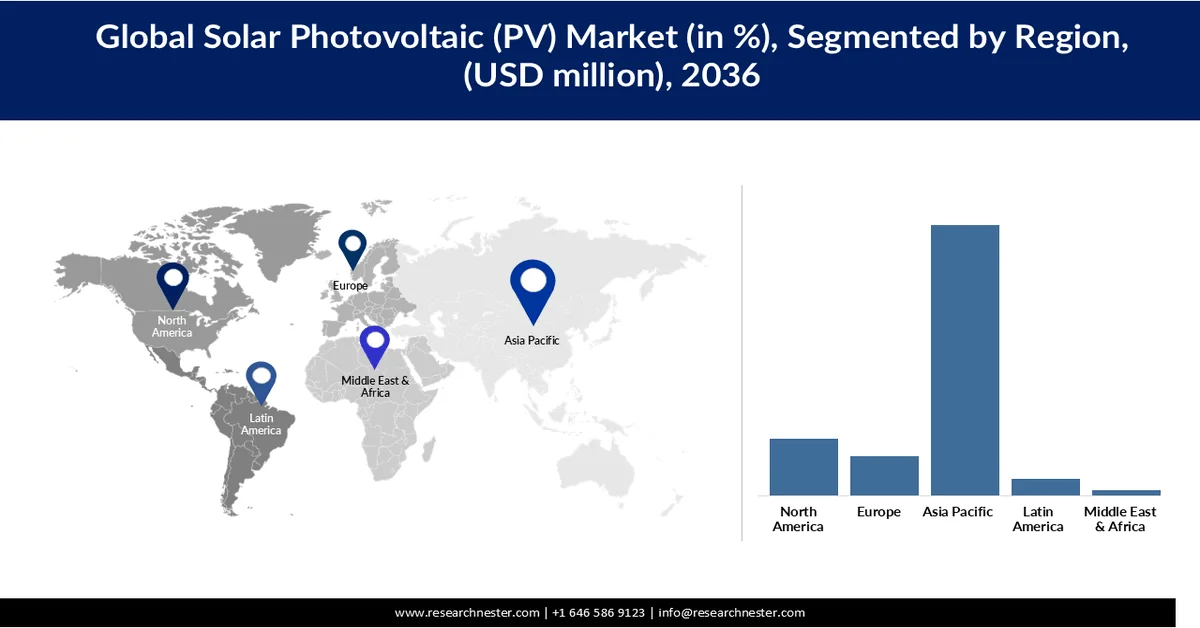
- Asia Pacific solar photovoltaic (pv) market is projected to command a 69.65% share by 2036, impelled by large-scale solar deployment supported by rising electricity demand and rapid industrialization.
- North America is anticipated to capture 14.09% share by 2036, propelled by rising electricity demand, increasing renewable energy adoption, and strong policy support for the clean energy transition.
Segment Insights:
- Crystalline silicon (c-Si) segment in the solar photovoltaic (pv) market is projected to account for 71.54% share by 2036, driven by high efficiency, reliability, and long operational lifespan.
- Ground-mounted segment is expected to expand at a CAGR of 7.16% by 2036, fueled by its suitability for large-scale utility projects generating high power output efficiently.
Key Growth Trends:
- Supportive government policies and incentives
- Rapid urbanization and industrialization
Major Challenges:
- High initial capital investment and financing challenges
- Intermittency and grid integration challenges
Key Players: First Solar (U.S.), Tata Power Solar Systems Ltd. (India), Canadian Solar Inc. (Canada), Wuxi Suntech Power Co. Ltd (China), NextEra Energy Resources LLC (U.S.), BrightSource Energy Inc. (U.S.), SunPower Corporation (U.S.), Vivaan Solar Pvt. Ltd. (India), Waaree Group (India), Jinko Solar (China), OMCO Solar (U.S.).
Global Solar Photovoltaic (PV) Market Forecast and Regional Outlook:
Market Size & Growth Projections:
- 2025 Market Size: USD 979.9 billion
- 2026 Market Size: USD 1.07 trillion
- Projected Market Size: USD 2.24 trillion by 2036
- Growth Forecasts: 7.63% CAGR (2026-2036)
Key Regional Dynamics:
- Largest Region: Asia Pacific (69.65% Share by 2036)
- Fastest Growing Region: North America
- Dominating Countries: United States, Germany, Netherlands, China, Japan
- Emerging Countries: India, Brazil, South Korea, Mexico, Indonesia
Last updated on : 27 March, 2026
Solar Photovoltaic (PV) Market - Growth Drivers and Challenges
Growth Drivers
- Supportive government policies and incentives: Government policies and incentives are playing a pivotal role in accelerating the adoption of solar PV systems globally. Measures such as tax credits, subsidies, feed-in tariffs, and net metering schemes significantly reduce the upfront cost of solar installations, making them more financially viable for consumers and businesses. Many countries are also implementing renewable energy targets and mandates that require a higher share of electricity generation from solar and other clean sources. In addition, policy frameworks such as investment tax credits and production-linked incentives are encouraging domestic manufacturing and large-scale project development. Regulatory support for grid connectivity and streamlined approval processes further ease project deployment. Collectively, these initiatives lower financial barriers, improve return on investment, and drive widespread adoption of solar PV systems across regions.
- Rapid urbanization and industrialization: Expanding cities require reliable power for residential buildings, commercial complexes, and public infrastructure, while growing industrial activities demand continuous and high-capacity energy supply. Solar PV systems are increasingly being integrated into urban planning through rooftop installations and smart city projects to meet this rising demand. Industrial sectors are also adopting solar to reduce energy costs and carbon footprints. Additionally, infrastructure development in emerging economies is creating new opportunities for large-scale solar deployment. As urban and industrial expansion continues, solar PV is becoming a preferred solution to support long-term energy needs efficiently and sustainably.
Challenges
- High initial capital investment and financing challenges: The solar PV market faces restraints due to the high upfront cost associated with installation and system integration, particularly for large-scale and utility projects. Expenses related to modules, inverters, land acquisition, and grid connection can be substantial, especially in developing regions with limited financing options. Although long-term savings are significant, the initial investment barrier can delay adoption among residential and small commercial users. In addition, access to affordable financing and long payback periods can further restrict solar photovoltaic market growth.
- Intermittency and grid integration challenges: Solar PV systems are inherently dependent on sunlight, leading to variability in power generation and challenges in ensuring a consistent energy supply. This intermittency creates difficulties in grid stability and requires additional investments in storage systems and grid management technologies. Integrating high shares of solar energy into existing grids can strain infrastructure, particularly in regions with outdated transmission and distribution networks. These technical and operational challenges can slow down large-scale deployment and limit the overall growth potential of the solar photovoltaic market.
Solar Photovoltaic (PV) Market Size and Forecast:
| Report Attribute | Details |
|---|---|
|
Base Year |
2025 |
|
Forecast Year |
2026-2036 |
|
CAGR |
7.63% |
|
Base Year Market Size (2025) |
USD 979.9 billion |
|
Forecast Year Market Size (2036) |
USD 2.24 trillion |
|
Regional Scope |
|
Solar Photovoltaic (PV) Market Segmentation:
Technology Segment Analysis
The crystalline silicon (c-Si) segment is expected to hold 71.54% of the solar photovoltaic market share between 2026 and 2036, owing to its high efficiency, reliability, and long operational lifespan, making it the preferred technology across residential, commercial, and utility-scale installations. Its dominance is supported by continuous technological advancements, particularly in mono-crystalline modules, which offer superior performance. Additionally, large-scale manufacturing and well-established supply chains have significantly reduced production costs, enhancing affordability and adoption. The technology’s compatibility with diverse applications and proven track record further strengthen its widespread deployment. As a result, c-Si remains the backbone of global solar PV expansion.
Installation Type Segment Analysis
The ground-mounted segment is expected to grow with a CAGR of 7.16% by 2036 due to its suitability for large-scale utility projects that generate high power output efficiently. These systems benefit from economies of scale, resulting in lower installation and operational costs per unit of electricity. They also allow optimal panel orientation and tracking technologies, improving energy generation compared to rooftop systems. Additionally, increasing investments in solar parks and grid-connected projects are accelerating the deployment of ground-mounted installations globally.
Our in-depth analysis of the global solar photovoltaic (PV) market includes the following segments:
|
Segments |
Subsegments |
|
Technology |
|
|
Installation Type |
|
|
End user |
|
|
Component |
|

Vishnu Nair
Head - Global Business DevelopmentCustomize this report to your requirements — connect with our consultant for personalized insights and options.
Solar Photovoltaic (PV) Market - Regional Analysis
Asia Pacific Market Insights
Asia Pacific is expected to dominate the solar PV market, accounting for 69.65% of the total share by 2036, due to its large-scale solar deployment supported by rising electricity demand and rapid industrialization. The region benefits from strong manufacturing capabilities and cost-efficient production, enabling widespread adoption of solar PV systems. Government initiatives promoting renewable energy and expanding infrastructure further accelerate installations across countries. Additionally, the presence of major solar photovoltaic markets and continuous capacity additions positions the Asia Pacific as the leading contributor to global solar photovoltaic (PV) market expansion.
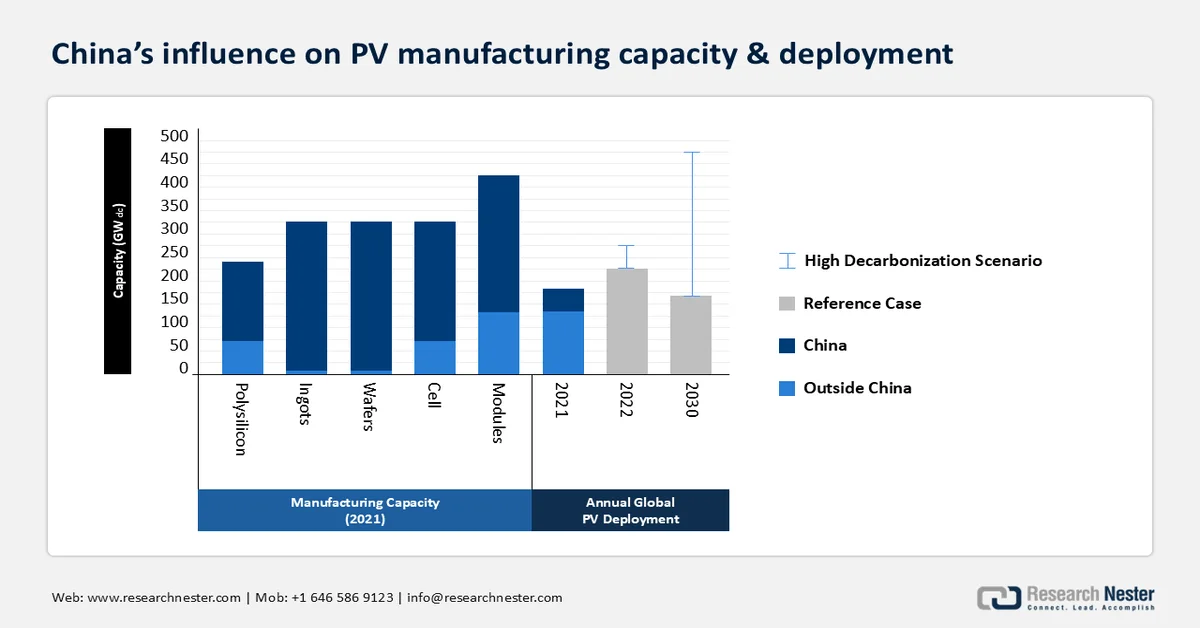
In China, the solar photovoltaic market is strongly driven by the country’s overwhelming control over the photovoltaic supply chain, which ensures cost efficiency and large-scale availability of components. With 97% of global silicon wafer production concentrated in China and a significant share of solar cells and modules produced either domestically or through Chinese subsidiaries in Southeast Asia, the country enables a consistent and affordable supply.
Additionally, China’s dominance extends across critical components such as polysilicon, ingots, manufacturing equipment, inverters, and module materials like aluminum frames and glass. This high level of vertical integration and supply chain control reduces production costs globally and accelerates deployment, making China’s manufacturing ecosystem a key driver of growth in the global solar PV market.
China’s influence on global solar photovoltaics:
Around 97% of silicon wafer production is done in China, and a major volume is then shipped to other countries as raw material for solar cells. Approximately 75% of the silicon solar cells integrated into modules and deployed in the U.S. are manufactured by Chinese subsidiaries in Southeast Asian countries, including Malaysia, Vietnam, and Thailand. Furthermore, a large volume of PV-component supply comes from China. While a minority but a considerable portion of polysilicon, cells, and modules are sourced outside of China, the global photovoltaic supply chain is significantly dependent on wafers and ingots from China. In addition, other pieces of the module supply chain, comprising manufacturing equipment and balance-of-module components (for example, aluminum frames and glass), are predominantly supplied from China. The local manufacturers account for a key balance-of-PV-system component share, including inverters used in electrical grids, as well as steel and aluminum used for mounting PV modules.
Further, the presence of key supplies in China is instrumental in determining component costs, including polysilicon. As per EIA, polysilicon prices increased threefold from USD 6.27/kg in June 2020 to USD 28.46/kg in June 2021. This is ascribed to a supply/demand imbalance owing to wafer and cell manufacturing capacity expansion. With polysilicon emerging as a critical bottleneck, downstream entities such as cells and wafer producers have been strategically stockpiling polysilicon supplies to meet the anticipated demand, largely driven by the proliferation of utility-scale deployment in China. Based on announced projects, polysilicon manufacturing is expected to double in capacity over the next few years. Some of the new plants built have manufacturing capacities of 30,000-70,000 MT per year, and there are anticipated plans to build facilities with more than 100,000 MT capacities.
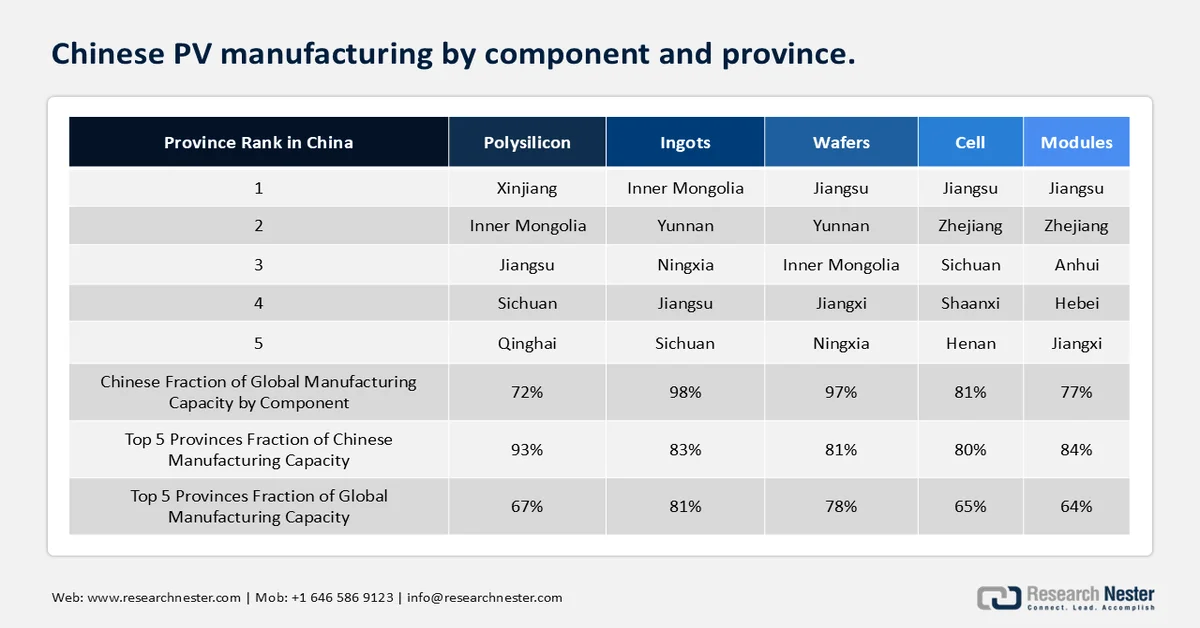
Chinese companies have been keen on lowering polysilicon prices by establishing manufacturing facilities and manufacturing in areas with affordable land, electricity, and labor costs. Western provinces have a considerable build-out, including Inner Mongolia, Qinghai, Sichuan, and especially, Xinjiang. It currently hosts China’s 54% and 39% of China's global production. Based on active projects till 2022, an estimate of China’s overall solar PV component yield is mentioned below.
China’s low labor costs and concentrated c-Si PV supply chain have posed an entry barrier for other players. In the U.S., labor expenditure represents 22% of the manufacturing costs versus 8% in China, 36% of wafer manufacturing costs in the U.S. versus 23% in China, and 33% of cell manufacturing costs in the U.S. versus 8% in China.
Moreover, despite the ongoing efforts to decouple from the reliance on China for component supplies, China’s solar panel export spiked by 34% in the first half of 2023. This is pivotal in meeting the high energy demand in Europe and South Africa. The rising focus on clean energy transition has further increased dependency on China’s solar exports. Out of the 90.4% export volume, Europe emerged as the biggest importer (58%), followed by Brazil receiving 9.5 GW of solar panels made in China in the first half of 2023. Africa is projected to witness the fastest import growth rate of 187% as the government is seeking ways to mitigate the rising energy crisis, while China is heavily capitalizing on the prevailing demand-supply gap.
China’s solar exports in the first half of 2023, share (%) in USD value terms
|
Export destination |
Export Share |
|
Europe |
52.50% |
|
Brazil |
7.60% |
|
Pakistan |
3% |
|
Australia |
2.60% |
|
Japan |
2.70% |
|
South Africa |
2.70% |
|
Saudi Arabia |
2.10% |
|
Rest of World |
11.10% |
Source: Ember Energy
Furthermore, India solar PV market is experiencing strong growth driven by rising electricity demand and supportive government policies promoting renewable energy adoption. The country has significantly expanded its installed solar capacity, growing from a minimal base to over 130 GW in recent years, reflecting sustained investment and policy focus. Large-scale solar projects dominate capacity additions, supported by competitive auctions and infrastructure development. Additionally, initiatives such as rooftop solar programs are encouraging wider adoption across residential and commercial sectors. Increasing electrification, industrial expansion, and a robust project pipeline are expected to further accelerate solar deployment in the coming years.
North America Market Insights
The solar PV market in North America is expected to hold a share of 14.09% by 2036, driven by rising electricity demand, increasing renewable energy adoption, and strong policy support for the clean energy transition. Expanding investments in utility-scale solar projects, grid modernization, and energy storage are accelerating deployment across the region. The presence of advanced infrastructure and growing electrification across transport and buildings further supports sustained demand for solar PV systems.
At the same time, the growth of metallurgical-grade silicon (MGS) production in North America is strengthening the regional solar PV market by enhancing domestic supply chains. Increased MGS production reduces reliance on imports for key raw materials used in solar modules, improving cost stability and supply security. This supports local manufacturing of wafers and cells while aligning with government initiatives to boost domestic production. As a result, expanding MGS capacity is playing a crucial role in driving solar PV market growth in North America.
North America MGS production by top contenders (2022)
|
MGS Plant |
Manufacturing Capacity (Tons) |
|
Quebec Silicon Becancour, QC |
50,000 |
|
Ferroglobe Niagara Falls |
30,000 |
|
Ferroglobe Beverly, OH |
16,000 |
|
Ferroglobe Alloy, WV |
75,000 |
|
Dow Corning Mt. Meigs, AL |
42,000 |
|
Ferroglobe Selma, AL |
31,000 |
|
Mississippi Silicon Burnsville, MS |
36,000 |
The primary use case of polysilicon is photovoltaic (comprising 80% of the demand), and the other is semiconductors and consumer electronics. Despite there being several polysilicon production techniques, two general approaches are ascribed to the largest solar photovoltaic market shares. The fluidized bed reactor (FBR) method accounts for 3%-5% of the solar PV market share, and the Siemens chemical vapor deposition method holds a 90% share. The Siemens process entails the passage of silane precursor or gaseous trichlorosilane (TCS) over the heated silicon filaments. Recovered compounds are further processed to synthesize polysilicon. Virtually all polysilicon manufacturing capacity lies within 10 countries, with China capturing 72% of the global capacity.
The U.S. solar PV market growth is driven by surging investments in solar manufacturing and deployment, along with rapid capacity expansion, enabling large-scale installation of PV systems. Additionally, the rise in energy storage strengthens grid reliability and supports efficient solar integration, accelerating overall solar photovoltaic market adoption.
Electricity providers have been bifurcated into two groups, including full-service providers, which supply bundled electricity services, and other providers. Full-service providers typically provide autonomously generated electricity or are outsourced from other independent power producers. These include investor-owned utilities such as publicly traded stock electric utilities, public entities such as state power agencies, municipalities, and municipal solar PV marketing authorities, federal entities comprising power marketers and producers either financed or owned by the federal government, and cooperatives that are owned by and operated by cooperative members. In addition to end-use customers' sales, electricity is often traded on wholesale solar photovoltaic markets or via bilateral contracts.
The percentage shares of electricity sales, by provider type (2022)
|
Provider type |
Electricity sales share |
|
Investor-owned utilities |
75% |
|
Public and federal entities |
16% |
|
Cooperatives |
13% |
|
Others |
15% |
U.S. solar manufacturing and storage investments reached a record high in 2023, owing to both public and private funding. A comparative analysis of 2023 and 2022 has been provided in the following table.
U.S. solar investments through 2023
|
Investment area |
2023 |
|
Solar manufacturing |
USD 5.1 billion (+470% from 2022) |
|
Battery manufacturing |
USD 33.9 billion (+240%) |
|
(vehicle and stationery) |
|
|
Large-scale solar deployment |
USD 35.4 billion (+45%) |
|
Large-scale storage deployment |
USD 17.0 billion (+71%) |
|
Distributed electricity and storage deployment |
USD 21.6 billion (+18%) |
Source: U.S. Energy Information Administration, Preliminary Monthly Electric Generator Inventory
In 2024, the total energy produced added up to approximately 62.8 GW of new utility-scale electric-generating capacity, which registered a steep surge from 18.4 GW in 2023. Solar held the largest share of new capacity, followed by battery storage. 50% of the overall solar capacity is accounted for by Texas (35%), California (10%), and Florida (6%). Besides the three states, Nevada’s Gemini solar facility, which is expected to be commissioned in 2025, will allow a value addition of 690 MW of photovoltaic capacity and 380 MW of battery storage. Furthermore, the U.S. battery storage capacity reached approximately 89% in 2024, with an extended capacity of 30 GW. This is a 705 rise from the 6.4 GW of new battery storage capacity in 2023. The Inflation Reduction Act has also accelerated the energy storage development with investment tax credits (ITCs) for stand-alone storage. Before the IRA, batteries qualified for federal tax credits only if they were co-located with solar photovoltaic market.
Canada solar PV market is growing steadily, supported by increasing renewable energy adoption and consistent capacity additions across provinces. The country has surpassed 5 GW of installed solar capacity, reflecting sustained expansion in recent years. Growth is largely driven by distributed and rooftop installations, alongside a stable pipeline of utility-scale projects. Additionally, Canada’s strong focus on clean energy transition and high share of renewable electricity generation are encouraging further solar deployment. With ongoing investments and supportive policies, the solar photovoltaic market is expected to witness continued growth in the coming years.
Europe Market Insights
Europe solar photovoltaic (PV) market will grow with a market share of 10.06% by 2036, driven by strong decarbonization targets and rising energy security concerns. Increasing investments in renewable energy and grid modernization are accelerating solar deployment across the region. Government policies and incentives are supporting both utility-scale and rooftop installations. Additionally, the push to reduce dependence on fossil fuels is further boosting solar adoption.
Germany solar PV market is expanding rapidly, supported by high electricity demand and strong policy backing for renewable energy. The country is increasing solar capacity through large-scale projects and rooftop installations under its energy transition strategy. Rising electrification across industries and transport is further driving demand for solar power. Continuous investments in grid upgrades and renewable integration are sustaining solar photovoltaic market growth.
France solar PV market is growing steadily, supported by its strong electricity infrastructure and increasing focus on renewable diversification. Expansion of solar capacity alongside its nuclear energy base is enhancing energy mix flexibility. Government initiatives promoting clean energy and solar installations are boosting adoption. Additionally, rising electrification and infrastructure upgrades are contributing to consistent solar photovoltaic market growth.
Key Solar Photovoltaic (PV) Market Players:
- First Solar (U.S.)
- Tata Power Solar Systems Ltd. (India)
- Canadian Solar Inc. (Canada)
- Wuxi Suntech Power Co. Ltd (China)
- NextEra Energy Resources LLC (U.S.)
- BrightSource Energy Inc. (U.S.)
- SunPower Corporation (U.S.)
- Vivaan Solar Pvt. Ltd. (India)
- Waaree Group (India)
- Jinko Solar (China)
- OMCO Solar (U.S.)
- Company Overview
- Business Strategy
- Key Product Offerings
- Financial Performance
- Key Performance Indicators
- Risk Analysis
- Recent Development
- Regional Presence
- SWOT Analysis
- First Solar is a leading in the solar photovoltaic market player known for its advanced thin-film photovoltaic technology, particularly cadmium telluride modules. The company focuses on utility-scale solar projects and benefits from strong domestic manufacturing capabilities in the U.S. Its emphasis on sustainability and high-efficiency modules strengthens its position in large-scale deployments.
- Jinko Solar is one of the world’s largest solar PV market module manufacturers, recognized for its high production capacity and global distribution network. The company continuously invests in R&D to improve module efficiency and reduce costs. Its strong presence across multiple regions supports large-scale solar adoption globally.
- Canadian Solar Inc. operates across the entire solar PV market value chain, including manufacturing, project development, and energy solutions. The company has a strong global footprint with utility-scale and distributed solar projects. Its diversified portfolio and consistent innovation drive its competitive position in the solar photovoltaic market.
- Tata Power Solar Systems India Ltd. is a major player in India’s solar photovoltaic market, offering EPC services and manufacturing solar modules. The company plays a key role in utility-scale and rooftop solar projects across the country. Strong government support and domestic demand enhance its solar photovoltaic market growth.
- Waaree Group is one of India’s largest solar PV module manufacturers with a growing global presence. The company focuses on high-quality module production and expanding manufacturing capacity. Its strong distribution network and project execution capabilities support widespread solar adoption.
Below is the list of the key players operating in the global solar PV market:
Key players are dominating the solar PV market through large-scale manufacturing capabilities, strong global supply chains, and continuous technological innovation. They invest heavily in research and development to enhance module efficiency, durability, and cost competitiveness, enabling wider adoption. Strategic partnerships, mergers, and project-level collaborations further help them expand their solar photovoltaic market presence and access new regions. Additionally, their involvement across the value chain, from production to project development and installation, allows them to maintain a competitive edge and capture a significant share of the solar photovoltaic market.
Corporate Landscape of the Global Solar PV Market:
Recent Developments
- In November 2024, Trinasolar announced that its larger-area 350.4 cm² n-type bifacial TOPCon industrial solar cells achieved an efficiency of 2658% in the n-type TOPCon Cells category. This is the 28th record-breaking mark that Trinasolar has established as a world record in cell/module conversion efficiency, further underscoring its robust innovation capabilities.
- In September 2024, the U.S. DOE, in tandem with kWh Analytics, introduced a USD 2.4 million initiative to develop solar PV projects. The new initiative will enable the collection of real-world electricity loss data from renewable power grids and aid in presenting new standardization for minimizing power generation loss.
- In September 2024, OMCO Solar and Heleine collaborated to launch bundled PV modules for the U.S. solar photovoltaic market. The bundled solution supports local solar developers pursuing the lucrative tax credit under the IRA.
- Report ID: 6098
- Published Date: Mar 27, 2026
- Report Format: PDF, PPT
- Explore a preview of key market trends and insights
- Review sample data tables and segment breakdowns
- Experience the quality of our visual data representations
- Evaluate our report structure and research methodology
- Get a glimpse of competitive landscape analysis
- Understand how regional forecasts are presented
- Assess the depth of company profiling and benchmarking
- Preview how actionable insights can support your strategy
Explore real data and analysis
Frequently Asked Questions (FAQ)
Solar Photovoltaic (PV) Market Report Scope
Free Sample includes current and historical market size, growth trends, regional charts & tables, company profiles, segment-wise forecasts, and more.
Connect with our Expert


Copyright @ 2026 Research Nester. All Rights Reserved.
