Global SoftPOS Market
- An Outline of the Global SoftPOS Market
- Market Definition and Segmentation
- Study Assumptions and Abbreviations
- Research Methodology & Approach
- Primary Research
- Secondary Research
- Data Triangulation
- SPSS Methodology
- Executive Summary
- Growth Drivers
- Major Roadblocks
- Opportunities
- Prevalent Trends
- Government Regulation
- Growth Outlook
- Competitive White Space Analysis – Identifying Untapped Market Gaps
- Risk Overview
- SWOT
- Technological Advancement
- Technology Maturity Matrix for Ventilation Grill
- Recent News
- Regional Demand
- SoftPOS by Geography – Strategic Comparative Analysis
- Strategic Segment Analysis: Ventilation Grill Demand Landscape
- SoftPOS Demand Trends Driven by Enhanced Security, AI Development, White Label POS (2026-2036)
- Root Cause Analysis (RCA) for discovering problems of the Ventilation Grill Porter Five Forces
- PESTLE
- Comparative Positioning
- Ventilation Grill– Key Player Analysis (2036)
- Competitive Landscape: Key Suppliers/Players
- Competitive Model: A Detailed Inside View for Investors
- Company Market Share, 2036 (%)
- Business Profile of Key Enterprise
- Tidypay
- Cashfree Payments India Private Limited
- Fairbit
- Lindab
- Yazara
- Network for Electronic Transfers Pte Ltd
- CM.Com
- Rubean
- Novatti Group Ltd
- MinSec Pte.Ltd
- Ingenic
- Business Profile of Key Enterprise
- SoftPOS Market Outlook
- Market Overview
- Market Revenue by Value (USD Billion), Volume (Billion Tons), and Compound Annual Growth Rate (CAGR)
- Global Segmentation SoftPOS Analysis (2026-2036)
- By Operating System
- Android, Market Value (USD Billion), and CAGR, 2026-2036F
- Others, Market Value (USD Billion), and CAGR, 2026-2036F
- By Enterprise Size
- Micro & Small Businesses, Market Value (USD Billion), and CAGR, 2026-2036F
- Medium & Large Enterprises, Market Value (USD Billion), and CAGR, 2026-2036F
- By End user
- Catering, Market Value (USD Billion), and CAGR, 2026-2036F
- Retail, Market Value (USD Billion), and CAGR, 2026-2036F
- Hospitality, Market Value (USD Billion), and CAGR, 2026-2036F
- Transportation & Mobility, Market Value (USD Billion), and CAGR, 2026-2036F
- Events & Ticketing, Market Value (USD Billion), and CAGR, 2026-2036F
- Others, Market Value (USD Billion), and CAGR, 2026-2036F
- By Device Type
- Consumer Devices, Market Value (USD Billion), and CAGR, 2026-2036F
- Professional Commercial SoftPOS Hardware, Market Value (USD Billion), and CAGR, 2026-2036F
- Regional Synopsis, Value (USD Billion), 2026-2036
- North America Market Value (USD Billion) and CAGR & Y-o-Y Growth Trend, 2026-2036F
- Europe Market Value (USD Billion) and CAGR & Y-o-Y Growth Trend, 2026-2036F
- Asia Pacific Market Value (USD Billion) and CAGR & Y-o-Y Growth Trend, 2026-2036F
- Latin America Market Value (USD Billion) and CAGR & Y-o-Y Growth Trend, 2026-2036F
- Middle East and Africa Market Value (USD Billion) and CAGR & Y-o-Y Growth Trend, 2026-2036F
- By Operating System
- Market Overview
- North America Market
- Overview
- Market Value (USD Billion), Current and Future Projections, 2026-2036
- Increment $ Opportunity Assessment, 2026-2036
- Segmentation (USD Billion), 2026-2036,
- By Operating System
- Android, Market Value (USD Billion), and CAGR, 2026-2036F
- Others, Market Value (USD Billion), and CAGR, 2026-2036F
- By Enterprise Size
- Micro & Small Businesses, Market Value (USD Billion), and CAGR, 2026-2036F
- Medium & Large Enterprises, Market Value (USD Billion), and CAGR, 2026-2036F
- By End user
- Catering, Market Value (USD Billion), and CAGR, 2026-2036F
- Retail, Market Value (USD Billion), and CAGR, 2026-2036F
- Hospitality, Market Value (USD Billion), and CAGR, 2026-2036F
- Transportation & Mobility, Market Value (USD Billion), and CAGR, 2026-2036F
- Events & Ticketing, Market Value (USD Billion), and CAGR, 2026-2036F
- Others, Market Value (USD Billion), and CAGR, 2026-2036F
- By Device Type
- Consumer Devices, Market Value (USD Billion), and CAGR, 2026-2036F
- Professional Commercial SoftPOS Hardware, Market Value (USD Billion), and CAGR, 2026-2036F
- Country Level Analysis, Value (USD Billion)
- U.S. Market Value (USD Billion) and CAGR & Y-o-Y Growth Trend, 2026-2036F
- Canada Market Value (USD Billion) and CAGR & Y-o-Y Growth Trend, 2026-2036F
- By Operating System
- Overview
- Europe Market
- Overview
- Market Value (USD Billion), Current and Future Projections, 2026-2036
- Increment $ Opportunity Assessment, 2026-2036
- Segmentation (USD Billion), 2026-2036, B
- By Operating System
- Android, Market Value (USD Billion), and CAGR, 2026-2036F
- Others, Market Value (USD Billion), and CAGR, 2026-2036F
- By Enterprise Size
- Micro & Small Businesses, Market Value (USD Billion), and CAGR, 2026-2036F
- Medium & Large Enterprises, Market Value (USD Billion), and CAGR, 2026-2036F
- By End user
- Catering, Market Value (USD Billion), and CAGR, 2026-2036F
- Retail, Market Value (USD Billion), and CAGR, 2026-2036F
- Hospitality, Market Value (USD Billion), and CAGR, 2026-2036F
- Transportation & Mobility, Market Value (USD Billion), and CAGR, 2026-2036F
- Events & Ticketing, Market Value (USD Billion), and CAGR, 2026-2036F
- Others, Market Value (USD Billion), and CAGR, 2026-2036F
- By Device Type
- Consumer Devices, Market Value (USD Billion), and CAGR, 2026-2036F
- Professional Commercial SoftPOS Hardware, Market Value (USD Billion), and CAGR, 2026-2036F
- Country Level Analysis, Value (USD Billion)
- UK Market Value (USD Billion) and CAGR & Y-o-Y Growth Trend, 2026-2036F
- Germany Market Value (USD Billion) and CAGR & Y-o-Y Growth Trend, 2026-2036F
- France Market Value (USD Billion) and CAGR & Y-o-Y Growth Trend, 2026-2036F
- Italy Market Value (USD Billion) and CAGR & Y-o-Y Growth Trend, 2026-2036F
- Spain Market Value (USD Billion) and CAGR & Y-o-Y Growth Trend, 2026-2036F
- Netherlands Market Value (USD Billion) and CAGR & Y-o-Y Growth Trend, 2026-2036F
- Russia Market Value (USD Billion) and CAGR & Y-o-Y Growth Trend, 2026-2036F
- Switzerland Market Value (USD Billion) and CAGR & Y-o-Y Growth Trend, 2026-2036F
- Poland Market Value (USD Billion) and CAGR & Y-o-Y Growth Trend, 2026-2036F
- Belgium Market Value (USD Billion) and CAGR & Y-o-Y Growth Trend, 2026-2036F
- Rest of Europe Market Value (USD Billion) and CAGR & Y-o-Y Growth Trend, 2026-2036F
- By Operating System
- Overview
- Asia Pacific Market
- Overview
- Market Value (USD Billion), Current and Future Projections, 2026-2036
- Increment $ Opportunity Assessment, 2026-2036
- Segmentation (USD Billion), 2026-2036,
- By Operating System
- Android, Market Value (USD Billion), and CAGR, 2026-2036F
- Others, Market Value (USD Billion), and CAGR, 2026-2036F
- By Enterprise Size
- Micro & Small Businesses, Market Value (USD Billion), and CAGR, 2026-2036F
- Medium & Large Enterprises, Market Value (USD Billion), and CAGR, 2026-2036F
- By End user
- Catering, Market Value (USD Billion), and CAGR, 2026-2036F
- Retail, Market Value (USD Billion), and CAGR, 2026-2036F
- Hospitality, Market Value (USD Billion), and CAGR, 2026-2036F
- Transportation & Mobility, Market Value (USD Billion), and CAGR, 2026-2036F
- Events & Ticketing, Market Value (USD Billion), and CAGR, 2026-2036F
- Others, Market Value (USD Billion), and CAGR, 2026-2036F
- By Device Type
- Consumer Devices, Market Value (USD Billion), and CAGR, 2026-2036F
- Professional Commercial SoftPOS Hardware, Market Value (USD Billion), and CAGR, 2026-2036F
- Country Level Analysis, Value (USD Billion)
- China Market Value (USD Billion) and CAGR & Y-o-Y Growth Trend, 2026-2036F
- India Market Value (USD Billion) and CAGR & Y-o-Y Growth Trend, 2026-2036F
- South Korea Market Value (USD Billion) and CAGR & Y-o-Y Growth Trend, 2026-2036F
- Australia Market Value (USD Billion) and CAGR & Y-o-Y Growth Trend, 2026-2036F
- Indonesia Market Value (USD Billion) and CAGR & Y-o-Y Growth Trend, 2026-2036F
- Malaysia Market Value (USD Billion) and CAGR & Y-o-Y Growth Trend, 2026-2036F
- Vietnam Market Value (USD Billion) and CAGR & Y-o-Y Growth Trend, 2026-2036F
- Thailand Market Value (USD Billion) and CAGR & Y-o-Y Growth Trend, 2026-2036F
- Singapore Market Value (USD Billion) and CAGR & Y-o-Y Growth Trend, 2026-2036F
- New Zeeland Market Value (USD Billion) and CAGR & Y-o-Y Growth Trend, 2026-2036F
- Rest of Asia Pacific Excluding Japan Market Value (USD Billion) and CAGR & Y-o-Y Growth Trend, 2026-2036F
- By Operating System
- Overview
- Latin America Market
- Overview
- Market Value (USD Billion), Current and Future Projections, 2026-2036
- Increment $ Opportunity Assessment, 2026-2036
- Year-on-Year Growth Forecast (%)
- Segmentation (USD Billion), 2026-2036, By
- By Operating System
- Android, Market Value (USD Billion), and CAGR, 2026-2036F
- Others, Market Value (USD Billion), and CAGR, 2026-2036F
- By Enterprise Size
- Micro & Small Businesses, Market Value (USD Billion), and CAGR, 2026-2036F
- Medium & Large Enterprises, Market Value (USD Billion), and CAGR, 2026-2036F
- By End user
- Catering, Market Value (USD Billion), and CAGR, 2026-2036F
- Retail, Market Value (USD Billion), and CAGR, 2026-2036F
- Hospitality, Market Value (USD Billion), and CAGR, 2026-2036F
- Transportation & Mobility, Market Value (USD Billion), and CAGR, 2026-2036F
- Events & Ticketing, Market Value (USD Billion), and CAGR, 2026-2036F
- Others, Market Value (USD Billion), and CAGR, 2026-2036F
- By Device Type
- Consumer Devices, Market Value (USD Billion), and CAGR, 2026-2036F
- Professional Commercial SoftPOS Hardware, Market Value (USD Billion), and CAGR, 2026-2036F
- Country Level Analysis, Value (USD Billion)
- Brazil Market Value (USD Billion) and CAGR & Y-o-Y Growth Trend, 2026-2036F
- Argentina Market Value (USD Billion) and CAGR & Y-o-Y Growth Trend, 2026-2036F
- Mexico Market Value (USD Billion) and CAGR & Y-o-Y Growth Trend, 2026-2036F
- Rest of Latin America Market Value (USD Billion) and CAGR & Y-o-Y Growth Trend, 2026-2036F
- By Operating System
- Overview
- Middle East & Africa Market
- Overview
- Market Value (USD Billion), Current and Future Projections, 2026-2036
- Increment $ Opportunity Assessment, 2026-2036
- Year-on-Year Growth Forecast (%)
- By Operating System
- Android, Market Value (USD Billion), and CAGR, 2026-2036F
- Others, Market Value (USD Billion), and CAGR, 2026-2036F
- By Enterprise Size
- Micro & Small Businesses, Market Value (USD Billion), and CAGR, 2026-2036F
- Medium & Large Enterprises, Market Value (USD Billion), and CAGR, 2026-2036F
- By End user
- Catering, Market Value (USD Billion), and CAGR, 2026-2036F
- Retail, Market Value (USD Billion), and CAGR, 2026-2036F
- Hospitality, Market Value (USD Billion), and CAGR, 2026-2036F
- Transportation & Mobility, Market Value (USD Billion), and CAGR, 2026-2036F
- Events & Ticketing, Market Value (USD Billion), and CAGR, 2026-2036F
- Others, Market Value (USD Billion), and CAGR, 2026-2036F
- By Device Type
- Consumer Devices, Market Value (USD Billion), and CAGR, 2026-2036F
- Professional Commercial SoftPOS Hardware, Market Value (USD Billion), and CAGR, 2026-2036F
- Country Level Analysis, Value (USD Billion)
- Saudi Arabia Market Value (USD Billion) and CAGR & Y-o-Y Growth Trend, 2026-2036F
- UAE Market Value (USD Billion) and CAGR & Y-o-Y Growth Trend, 2026-2036F
- Israel Market Value (USD Billion) and CAGR & Y-o-Y Growth Trend, 2026-2036F
- Qatar Market Value (USD Billion) and CAGR & Y-o-Y Growth Trend, 2026-2036F
- Kuwait Market Value (USD Billion) and CAGR & Y-o-Y Growth Trend, 2026-2036F
- Oman Market Value (USD Billion) and CAGR & Y-o-Y Growth Trend, 2026-2036F
- South Africa Market Value (USD Billion) and CAGR & Y-o-Y Growth Trend, 2026-2036F
- Rest of Middle East & Africa Market Value (USD Billion) and CAGR & Y-o-Y Growth Trend, 2026-2036F
- Overview
- Global Economic Scenario
- World Economic Outlook
- About Research Nester
- Our Global Clientele
- We Serve Clients Across World
SoftPOS Market Outlook:
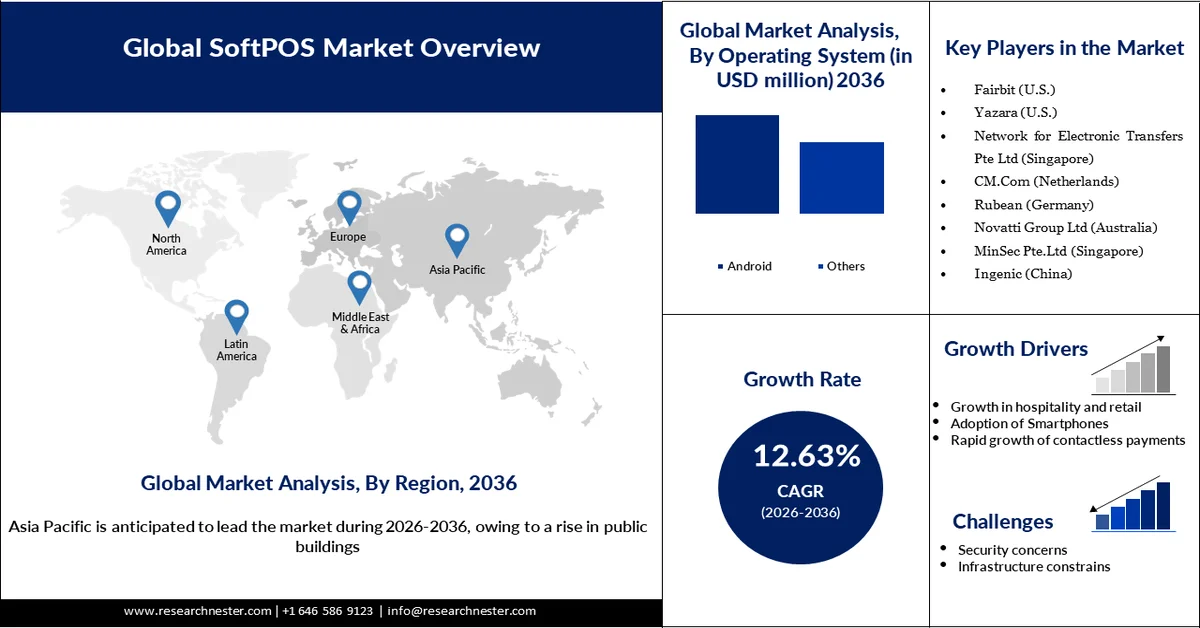
SoftPOS Market size is valued at USD 336.05 million in 2025 and is expected to grow to USD 1.21 billion by 2036, registering a CAGR of 12.63% during the forecast period, i.e., 2026-2036. In 2026, the industry size of SoftPOS is assessed at USD 370.37 million.
The growth of e-commerce and small businesses has accelerated the demand of market as manufacturers receive a large number of payments, which makes tracking difficult. SoftPOS helps in tracking the payments effectively by reducing the operational cost significantly. According to the International Trade Administration, the global B2B ecommerce was valued at USD 36 trillion, with demand from healthcare, energy, and professional business services. The heavy demand from e-commerce businesses significantly increases the adoption of SoftPOS systems, as it provides cost-effective solutions and enhanced safety for payments. SoftPOS solutions are highly functional for cross-border payments as the software can easily generate payment links and QRs to effectively receive payments with safety. The rising disposable income has pushed consumers to purchase products from different manufacturers across the globe, pushing POS based sales. Traditional POS required cards and complex operations, often leading to failed transactions. The adoption of SoftPOS can significantly support in enhancing the payment success rate and increasing transparency in operations.
B2B eCommerce GMV
Source: trade.gov
Key SoftPOS Market Insights Summary:
Regional Highlights:
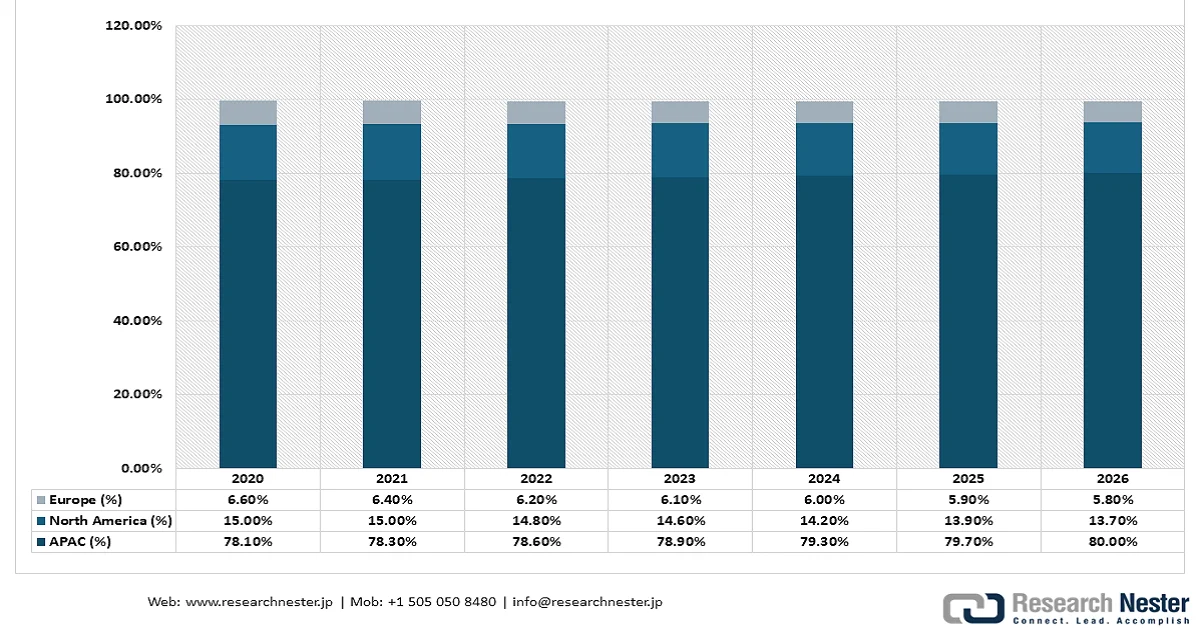
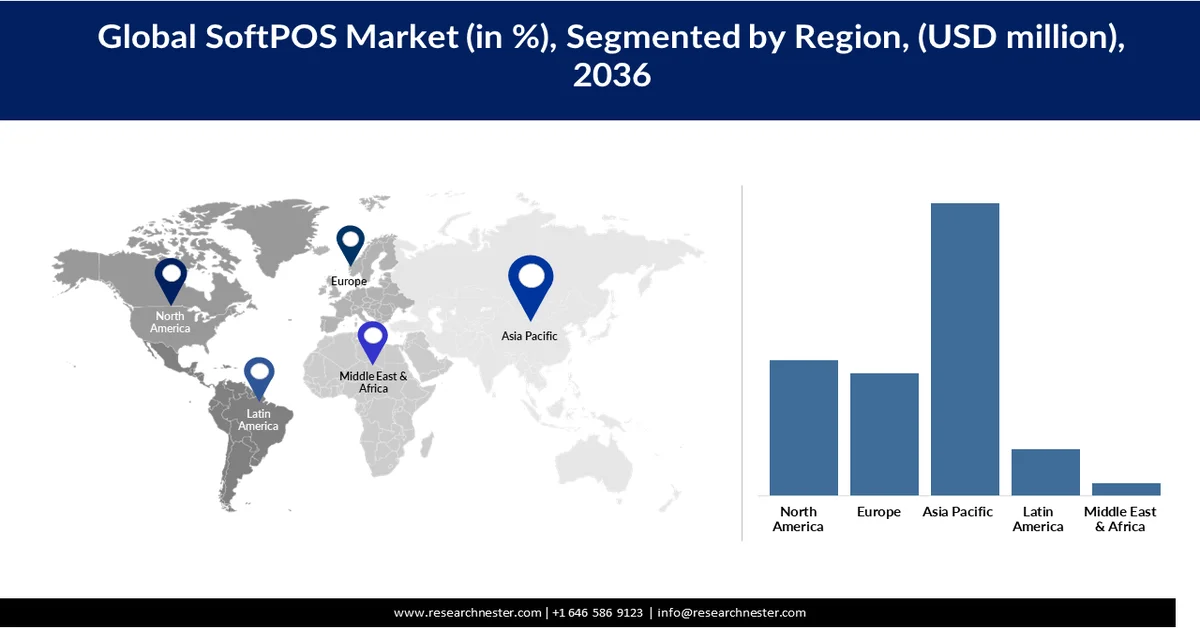
- Asia Pacific is projected to command a 46.96% share of the global SoftPOS market by 2036, propelled by rapid smartphone adoption, expanding digital literacy, and surging demand for cashless payment solutions.
- North America is expected to capture a 21.88% share by 2036, attributed to high smartphone penetration and increasing uptake of digital and contactless payment technologies.
Segment Insights:
- The Android segment of the global SoftPOS market is forecast to secure a 55.10% share by 2036, driven by widespread global adoption of the Android OS.
- The micro and small business segment is anticipated to account for a 60.9% share by 2036, fueled by increased trade activity in this sector.
Key Growth Trends:
- Growth in hospitality and retail
- Adoption of smartphones
Major Challenges:
- Security concerns
- Infrastructure Constraints
Key Players: Tidypay (UK), Cashfree Payments India Private Limited (India), Fairbit (U.S.), Yazara (U.S.), Network for Electronic Transfers Pte Ltd (Singapore), CM.Com (Netherlands), Rubean (Germany), Novatti Group Ltd (Australia), MinSec Pte.Ltd (Singapore), Ingenic (China).
Global SoftPOS Market Forecast and Regional Outlook:
Market Size & Growth Projections:
- 2025 Market Size: USD 336.05 million
- 2026 Market Size: USD 370.37 million
- Projected Market Size: USD 1.21 billion by 2036
- Growth Forecasts: 12.63% CAGR (2026-2036)
Key Regional Dynamics:
- Largest Region: Asia Pacific (46.96% Share by 2036)
- Fastest Growing Region: Asia Pacific
- Dominating Countries: United States, China, India, United Kingdom, Germany
- Emerging Countries: Japan, South Korea, Canada, Australia, Singapore
Last updated on : 25 February, 2026
SoftPOS Market - Growth Drivers and Challenges
Growth Drivers
- Growth in hospitality and retail: The rapid growth of the hospitality and retail sectors is a key driver of the global market as these industries handle high volumes of in-person transactions, where consumers increasingly prefer digital and contactless payments. According to the Federal Reserve Payments Study, contactless card payments in the U.S. more than doubled between 2018 and 2020, rising from 0.77% to 4.63% of all in-person card payments, reflecting a clear shift toward touch-free transactions at points of sale. The Federal Reserve Bank of Atlanta reported that 72% of U.S. consumers had adopted online or mobile payment accounts, such as digital wallets, by 2023. Further, U.S. e-commerce sales accounted for 16.4% of total retail sales in 2025, showing strong digital transaction adoption in retail channels. These trends indicate that as consumers expect fast, contactless checkout in stores, restaurants, and hotels, merchants are adopting SoftPOS solutions on smartphones and tablets to accept payments efficiently without dedicated hardware, directly driving market growth.
- Adoption of smartphones: The widespread adoption of smartphones is a major catalyst for the global market because SoftPOS solutions leverage mobile devices as secure payment terminals, eliminating the need for expensive dedicated POS hardware. According to the Pew Research Center, about 91% of U.S. adults owned a smartphone in 2025, up from 35% in 2011, demonstrating near-universal access to mobile technology. This high smartphone penetration enables merchants, especially in retail, restaurants, and hospitality, to deploy SoftPOS apps on devices they already own, making it easier and more cost-effective to accept contactless and mobile wallet payments. The convenience, portability, and ubiquity of smartphones allow even small and micro-businesses to offer modern digital payment methods, expanding the reach of SoftPOS across both urban and rural markets. Moreover, as mobile operating systems increasingly support secure NFC transactions and biometric authentication, smartphones serve as reliable, multifunctional payment platforms, directly driving the adoption and growth of the SoftPOS market globally.
- Rapid growth in contactless payments: Increasing consumer preference for contactless payments is driving the global market, as merchants can accept NFC-based card and mobile wallet payments directly on smartphones without dedicated POS hardware. In retail, hospitality, and other service sectors, businesses are adopting SoftPOS to provide faster, more convenient, and touch-free checkout experiences. The portability, affordability, and ease of deployment make SoftPOS an attractive solution for merchants of all sizes, helping them modernize payment processes, enhance customer satisfaction, and expand digital payment acceptance.
Challenges
- Security concerns: Challenges such as fraud and unauthorized transactions are slowing the adoption of SoftPOS solutions. Weak application security and compromised device integrity increase the risk of fraudulent activity, which can constrain market growth and limit the uptake of SoftPOS globally.
- Infrastructure Constraints: In some emerging markets, SoftPOS adoption remains limited due to inconsistent network availability and restrictions on certain operating systems, which hinder digital payment acceptance. However, as these countries invest in expanding network infrastructure and improving connectivity, the growing smartphone penetration is expected to support the broader adoption of SoftPOS and drive market growth.
SoftPOS Market Size and Forecast:
| Report Attribute | Details |
|---|---|
|
Base Year |
2025 |
|
Forecast Period |
2026-2036 |
|
CAGR |
12.63% |
|
Base Year Market Size (2025) |
USD 336.05 million |
|
Forecast Year Market Size (2036) |
USD 1.21 billion |
|
Regional Scope |
|
SoftPOS Market Segmentation:
Operating System Segment Analysis
The Android segment is projected to capture a 55.10% share by 2036, driven by widespread global adoption of the Android OS. Its dominance in SoftPOS adoption is supported by digitalized payment solutions that reduce reliance on traditional hardware-based POS systems. Android’s open operating system and rapid innovation encourage developers to deploy white-label POS applications, while the cost-effectiveness of Android devices further boosts adoption. Meanwhile, iOS and Windows platforms are also experiencing strong growth in developed markets due to enhanced security features, supporting the overall expansion of the market.
Enterprise Size Segment Analysis
The micro and small business segment is projected to hold a 60.9% share by 2036, driven by increased trade activity in this sector. These businesses often operate on tight budgets, making software-based POS solutions ideal, as owners can use personal devices to accept payments and reduce reliance on costly hardware-based POS systems. Traditional POS systems also require regulatory compliance, adding to operational expenses. At the same time, the medium and large business segment contributes to market growth by leveraging the ecosystem across multiple locations, further supporting the expansion of global SoftPOS adoption.
End-user Segment Analysis
The retail segment is projected to hold a 33.08% share, driven by consumers’ preference for fast and convenient payment methods. Retailers handle multiple customers daily, creating a need for responsive and efficient payment systems. SoftPOS solutions help reduce waiting times by enabling contactless payments on smartphones, eliminating the need for complex hardware-based POS systems. Similarly, the hospitality segment is also expected to capture a significant share by the end of the forecast period, as cafes and hotels increasingly adopt contactless payments to meet growing demand and minimize customer queues. Small hotels and cafés, operating on limited budgets, benefit from SoftPOS adoption since integrating traditional hardware-based POS can be cost-prohibitive.
Our in-depth analysis of the global market includes the following segments:
|
Segments |
Subsegments |
|
Operating System |
|
|
Enterprise Size |
|
|
End-user |
|
|
Device Type |
|

Vishnu Nair
Head - Global Business DevelopmentCustomize this report to your requirements — connect with our consultant for personalized insights and options.
SoftPOS Market - Regional Analysis
Asia Pacific Market Insights
The region is anticipated to hold a share of 46.96% by the end of 2036 due to the rapid adoption of smartphones, increasing digital literacy, and growing demand for cashless payment solutions. Businesses across APAC, particularly SMEs, are increasingly seeking cost-efficient, software-based POS systems that allow contactless payments on mobile devices. The rise of e-commerce, mobile wallets, and digital payment platforms is creating favorable conditions for SoftPOS adoption across the region.
China SoftPOS market is supported by its strong cloud infrastructure and software development ecosystem, which enables merchants to deploy low-cost, easy-to-use payment solutions. The country’s thriving e-commerce industry and high cross-border transaction volumes increase demand for secure, contactless payment methods. Technology companies in China are skilled in cloud-based application development, providing reliable software maintenance and user-friendly platforms that encourage merchants to adopt SoftPOS systems. These factors collectively drive growth in the region and contribute to the expansion of the global market.
In India, the SoftPOS market is fueled by a sharp increase in smartphone adoption, with over 85% of households now owning at least one smartphone. This widespread mobile access has accelerated the adoption of contactless and digital payments, especially after lockdowns encouraged consumers and merchants to rely on mobile payment methods. Additionally, the post-pandemic growth of India’s hospitality and tourism sector has further increased the demand for software-based POS systems, enabling businesses to offer faster, safer, and more convenient payment options.
North America Market Insights
North America is projected to hold a 21.88% of market share, driven by high smartphone penetration and the increasing adoption of digital and contactless payments. The rise of mobile-based payments has particularly accelerated adoption among small business owners, supporting overall market expansion. Favorable regulatory frameworks in the region further encourage the use of contactless and software-based payment solutions. Additionally, the presence of large fintech companies collaborating with banks has helped organize systematic and secure payment ecosystems.
In the U.S., merchants are increasingly transitioning from traditional POS systems to contactless, software-based solutions, enabling safer cross-border transactions, greater transparency, and reduced risk of fraud. Smartphones serve as the primary platform for these payments, reducing dependence on hardware-based POS terminals. For instance, in December 2025, Talus adopted SoftPOS technology developed by Ingenico, allowing business owners to accept contactless payments directly on smartphones without a card reader, enhancing convenience and lowering operational costs.
Canada also demonstrates strong SoftPOS adoption due to its advanced technological ecosystem and thriving fintech sector. Fintech firms are leveraging widespread Android smartphone usage to develop efficient, secure, and transparent digital payment solutions, further driving the growth of the SoftPOS market in the country.
Europe Market Insights
The Market in Europe is expected to hold a share of 19.64% by the end of 2036, driven by the demand for contactless payments that limits the waiting time of customers in shopping malls and restaurants. Moreover, safety is prioritized in SoftPOS transactions, enabling the merchant and the payee to have all transaction details. The manufacturers are integrating the SoftPOS for cross-border payments that can further improve the transparency and ensure effective growth of the market. The growing smartphone penetration is enabling consumers to make digitised payments without the need for a physical card reader, cutting network challenges. Key players of the market are deploying scalable and secure mobile transaction solutions, fostering merchant adoption.
The UK is home to micro and small enterprises that require safe and secure payment gateways to receive and send money to different accounts. These enterprises transact large amounts daily, where SoftPOS plays a vital role, and transactions can be processed in contactless methods without the need for hardware. This feature is a game-changer for small merchants as they operate on low operational expenses. The integration of software-based POS can significantly reduce the cost of maintaining multiple payment servers and enhance transparency in transactions.
In Germany, the regulatory frameworks of the country have significantly improved the adoption of safe payment options, which is propelling the expansion of SoftPOS systems. The software’s are dedicated to the use of single merchants and can be customised according to the merchant. Software-based POS shares the details of transaction to government directories, maintaining transparent operations. Furthermore, the e-commerce industry within the country has also exponentially increased, which is further propelling the expansion of software-based POS systems.
Key SoftPOS Market Players:
- Tidypay (UK)
- Cashfree Payments India Private Limited (India)
- Fairbit (U.S.)
- Yazara (U.S.)
- Network for Electronic Transfers Pte Ltd (Singapore)
- CM.Com (Netherlands)
- Rubean (Germany)
- Novatti Group Ltd (Australia)
- MinSec Pte.Ltd (Singapore)
- Ingenic (China)
- Company Overview
- Business Strategy
- Key Product Offerings
- Financial Performance
- Key Performance Indicators
- Risk Analysis
- Recent Development
- Regional Presence
- SWOT Analysis
- Tidypay is a payment technology provider that primarily focuses on SoftPOS and Omnichannel payment gateways. The business develops software-based payments for merchants and also supports enterprise-level payments. The business is also expanding operations in the European market through POS vendors
- Cash free Payments India Private Limited is a banking technology company that supports businesses of all sizes. It focuses on software-based payments to send, receive and make cross-border payments at lower costs. The designed software is capable of accepting payment by more than 180 methods.
- Fairbit is a popular technology company that enables mobile payments without the need for traditional hardware. The business also focuses on cloud-based transactions, which further reduces the dependency on IT teams. With a global footprint, the business is exceptionally well-managed in terms of research and innovation.
- Yazara is a technology firm focusing on SoftPOS and MPoC payment methods that can convert mobile devices into terminals. The cloud-based technology has simplified the growth of the enables payment through cards, bands and QRs, enabling wider adoption of their services
Below is the list of the key players operating in the market:
The players operating in the global SoftPOS market are expected to face intense competition during the forecast period. The market is associated with both established key players and new entrants. However, the market is moderately fragmented. New entrants impose immense competition for the existing players, prohibiting them from acquiring the majority of the revenue share. Specialised manufacturers maintain a competitive landscape in the market. Key players in the market are significantly supported by the governments for research and innovation.
Competitive Landscape of SoftPOS Market
Recent Developments
- In November 2025, Cash free launched its first-ever biometrically authenticated in-app payment system, which can pay in less than 2 seconds. The initiative focused on minimising the complexities of choosing accounts and receiving OTP for authentication.
- In September 2023, Tidypay announced its collaboration with Vectron to develop cutting edge payment service and solution. Both companies are experienced in POS systems, leading them to develop all-in-one POS systems to enhance payment speed.
- Report ID: 5916
- Published Date: Feb 25, 2026
- Report Format: PDF, PPT
- Explore a preview of key market trends and insights
- Review sample data tables and segment breakdowns
- Experience the quality of our visual data representations
- Evaluate our report structure and research methodology
- Get a glimpse of competitive landscape analysis
- Understand how regional forecasts are presented
- Assess the depth of company profiling and benchmarking
- Preview how actionable insights can support your strategy
Explore real data and analysis
Frequently Asked Questions (FAQ)
SoftPOS Market Report Scope
Free Sample includes current and historical market size, growth trends, regional charts & tables, company profiles, segment-wise forecasts, and more.
Connect with our Expert


Copyright @ 2026 Research Nester. All Rights Reserved.
