Reflective Materials Market Outlook:
Reflective Materials Market size was valued at approximately USD 16.09 billion in 2025 and is projected to reach USD 29.9 billion by the end of 2035, rising to a robust CAGR of 6.5% during the forecast period from 2026 to 2035. In 2026, the industry size of reflective materials is evaluated at USD 17.11 billion.
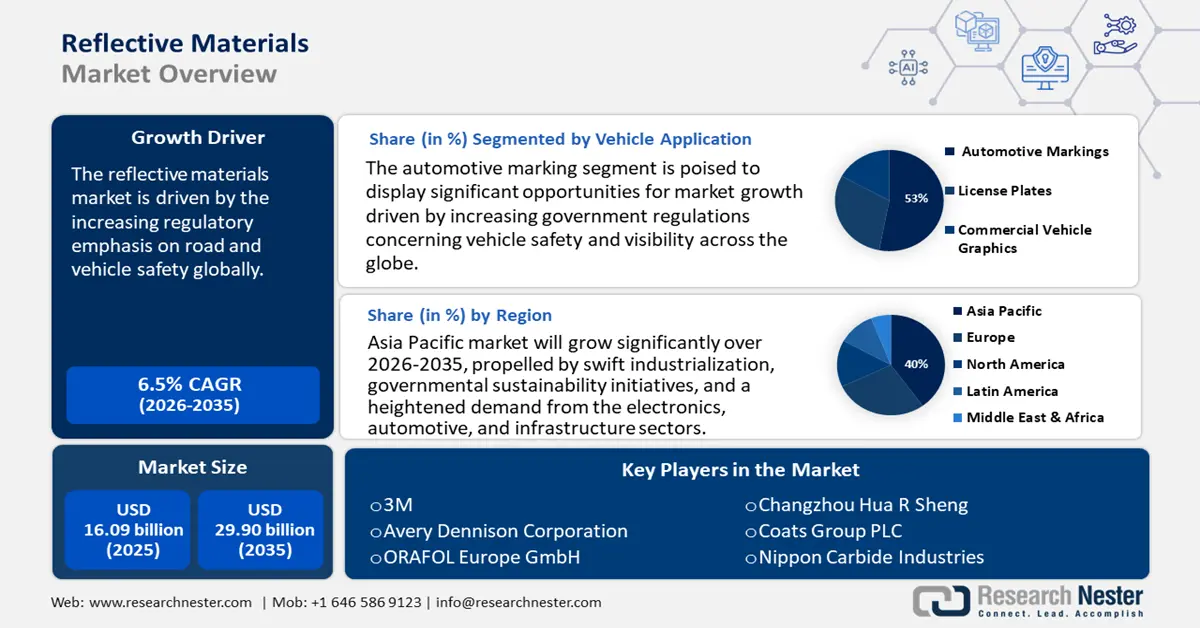
The primary growth driver of the reflective materials market is the increasing regulatory emphasis on road and vehicle safety globally. Government mandates requiring enhanced visibility features in the automotive and transportation sectors have led to widespread adoption of reflective materials. For instance, the U.S. Department of Transportation’s Federal Highway Administration (FHWA) reports that improved reflective road signage reduces nighttime accidents at intersections by 33%-38%, and pedestrian and bicyclist accidents by 47%. Similarly, the European Commission’s road safety strategy underlines reflective materials as critical to meeting its Vision Zero target for reducing road fatalities. These regulatory frameworks continue to strengthen demand for reflective materials globally, especially in automotive and infrastructure projects.
The supply chain for raw materials such as micro prismatic sheeting and glass beads remains concentrated, with major production hubs in the Asia Pacific and North America. Investments in research, development, and deployment (RDD) are supported by government grants, notably in the U.S. and Europe, to improve retroreflective efficiency and durability. Regarding trade, the U.S. Census Bureau reports that reflective material imports grew annually between 2021 and 2023, primarily from Asia, while exports to Europe and Latin America have increased over the same period, reflecting expanding global assembly and distribution networks. Expansion in manufacturing capacity is ongoing, with several new assembly lines established in Southeast Asia to meet regional demand growth.
Key Reflective Materials Market Insights Summary:
Regional Highlights:
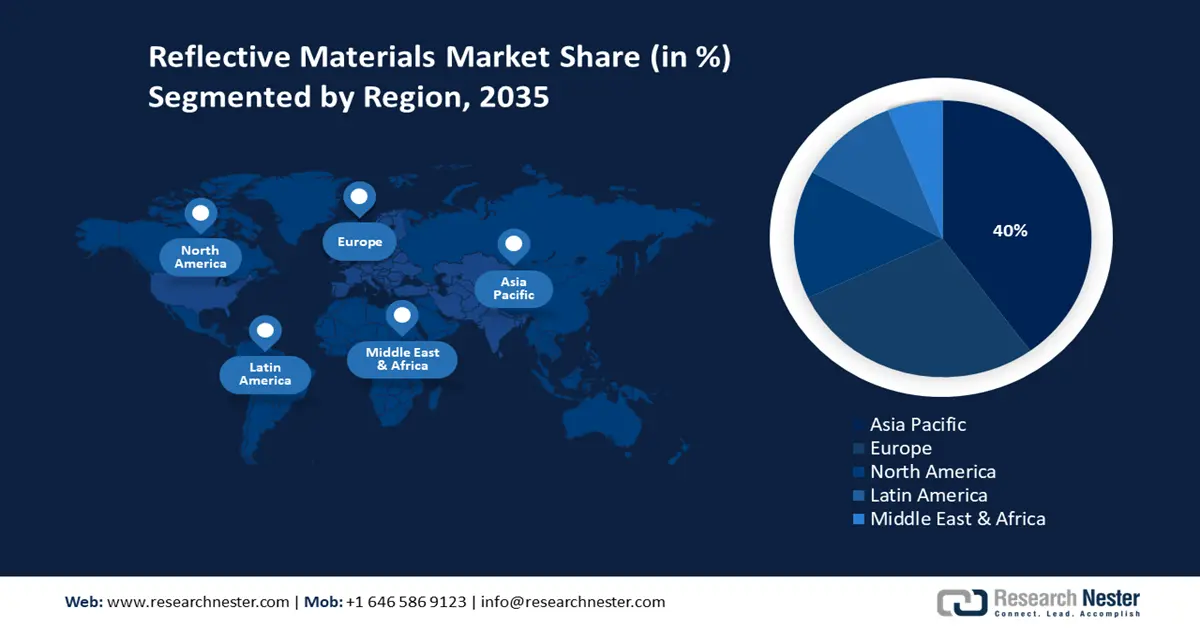
- Asia Pacific is projected to secure a 40% share of the global reflective materials market by 2035, propelled by swift industrialization, governmental sustainability initiatives, and rising demand from electronics, automotive, and infrastructure sectors.
- Europe is anticipated to capture a 28% share by 2035, owing to rigorous environmental regulations, technological advancements, and expanding industrial applications across major economies.
Segment Insights:
- Automotive markings are projected to command a 53% share of the reflective materials market by 2035, supported by stricter global vehicle-safety regulations mandating reflective systems on commercial and personal vehicles.
- Road signs are expected to secure a 30% share by 2035, bolstered by rising governmental investments in high-visibility transport infrastructure.
Key Growth Trends:
- Road safety regulations and infrastructure development
- Rising automotive production and demand for visibility enhancements
Major Challenges:
- Pricing pressures due to raw material volatility
- Limited awareness in developing regions
Key Players: BASF SE, Dow Chemical Company, LG Chem, Mitsubishi Chemical Holdings, Shin-Etsu Chemical, Reliance Industries, Covestro AG, Wanhua Chemical Group, LyondellBasell Industries, SABIC, INEOS, Sumitomo Chemical, Petronas Chemicals Group, Celanese Corporation, LG Household & Health Care.
Global Reflective Materials Market Forecast and Regional Outlook:
Market Size & Growth Projections:
- 2025 Market Size: USD 16.09 billion
- 2026 Market Size: USD 17.11 billion
- Projected Market Size: USD 29.9 billion by 2035
- Growth Forecasts: 6.5% CAGR (2026-2035)
Key Regional Dynamics:
- Largest Region: Asia Pacific (40% Share by 2035)
- Fastest Growing Region: Europe
- Dominating Countries: China, United States, Japan, Germany, South Korea
- Emerging Countries: India, Brazil, Mexico, Indonesia, Vietnam
Last updated on : 9 September, 2025
Reflective Materials Market - Growth Drivers and Challenges
Growth Drivers
- Road safety regulations and infrastructure development: Regulations for road safety are becoming more advanced, and more countries are establishing rigorous road safety standards. The need for reflective materials is continuing to grow for traffic signage, road markings, and enhancing the visibility of vehicles while using roadways. Roadway Departures Enhancements to horizontal curve delineation, such as fluorescent sheeting (18%), in-lane pavement markings (35%–38% reduction), or chevrons (16%–25% reduction), can warn drivers of approaching curves and be used alone or in conjunction with other countermeasures to lower fatalities. Infrastructure investment programs will amplify these developments as the expanding technology of smart highways and urban planning projects utilizes reflective solutions as an enhancement in public safety and compliance.
- Rising automotive production and demand for visibility enhancements: The development of the reflective materials market is largely driven by the global automotive space. It is increasingly deployed for various applications, with the general usage of license plates, vehicle headlights, road safety markings, and for use in vehicle interior trims. About 6% of India's GDP comes from the automobile industry, which exported 4.5 million units in FY 2023–2024 across all categories, including 3.45 million two-wheelers and 6.72 million passenger cars. This tendency is best illustrated by multinational automakers such as Maruti Suzuki, which exports about 2.8 lakh units a year, and Skoda Auto Volkswagen India, which exports 30% of its manufacturing. Electric vehicles (EVs) and other advanced mobility solutions are providing further momentum as manufacturers further advance on integrating innovative reflective coatings and materials being incorporated into the vehicles for more visibility, aesthetics, and an advancement of branding differentiation where competition exists in automotive markets.
- Rising construction activities and smart city initiatives: The construction space normally consumes a large amount of reflective safety equipment from worker uniforms to site markers, and traffic safety barriers as there is always a huge global capacity of infrastructure projects underway for both developing and developed economies, particularly in developing economies that is seeing an increase or recovery in high visibility materials used in construction. The developing infrastructure capacity is seeing reflective technologies being integrated into creating safer and more efficient urban environments that share governments and authorities' similar objectives to reduce accidents and improve the sustainability of infrastructure around the world.
1.Safety Regulation in Trade
Stringent international safety regulations are a primary driver for the global reflective materials market, especially in personal protective equipment such as protective gloves, mitts, and helmets. Trade standards and workplace safety protocols mandate high-visibility and heat-reflective properties in these items to reduce risks in industrial, construction, and extreme-environment settings. This regulatory demand fuels innovation in reflective coatings and materials tailored for hand protection, ensuring compliance while enhancing durability and performance. As a result, trade-led safety requirements directly accelerate the adoption and technological advancement of reflective materials in protective handwear globally.
Top Exporters of Protective Gloves, Mittens, and Mitts for Trades in 2023
|
Exporter Country / Region |
Trade Value (in 1,000 USD) |
Quantity (Kg) |
|
China |
386,737.34 |
28,621,500 |
|
Pakistan |
271,366.65 |
— |
|
India |
193,984.80 |
23,281,300 |
|
European Union |
61,208.49 |
1,285,790 |
|
Germany |
58,792.03 |
1,801,470 |
|
Sweden |
44,897.52 |
701,089 |
|
Netherlands |
26,731.87 |
649,325 |
|
France |
24,325.94 |
1,739,710 |
|
Poland |
23,874.18 |
687,066 |
|
Italy |
20,486.25 |
467,200 |
|
Indonesia |
17,585.63 |
350,756 |
Source: WITS
2.Trade Dynamics: Refractory Ceramics
The global trade in refractory ceramics is a major catalyst for the reflective materials market, as industrial demand for high-temperature resilience in sectors like metallurgy, energy, and manufacturing continues to grow. International supply chains enable the flow of advanced ceramic compositions, which in turn spur innovation in reflective coatings and systems designed to enhance thermal management and energy efficiency. This exchange of materials and expertise supports the adoption of reflective technologies in applications ranging from aerospace to industrial insulation. As a result, the refractory ceramics trade not only meets critical industrial needs but also accelerates the development and deployment of high-performance reflective solutions worldwide.
Refractory Ceramics in 2023
|
Exporting Country |
Trade Value (USD Million) |
Importing Country |
Trade Value (USD Million) |
|
China |
475 |
United States |
340 |
|
United States |
304 |
China |
166 |
|
Germany |
301 |
Germany |
131 |
Source: OEC
Challenges
- Pricing pressures due to raw material volatility: Global disruptions in the supply chain and varying prices of raw materials, including petrochemicals, pose a challenge to price stability. As reported by the WTO, fluctuations in raw material prices resulted in an annual variation in the prices of reflective materials between 2020 and 2023. This situation has forced manufacturers to either bear the costs themselves or pass them on to consumers, consequently affecting demand.
- Limited awareness in developing regions: Awareness of reflective materials has been proven deficient despite evidence of safety benefits, generally because of the limited use of reflective materials in terms of safety apparel, road markings and signs, and applications in the construction space. Reflective materials used for construction safety apparel, for example, reflective vests, reflective tape, and other reflective materials, are not heavily used in Asia and Africa largely due to a lack of enforcement of policies related to wearing safety items and road safety. This lack of awareness limits the growth of demand, since producers of reflective materials are compelled to spend on awareness campaigns and collaborations with non-market players and government officials.
Reflective Materials Market Size and Forecast:
| Report Attribute | Details |
|---|---|
|
Base Year |
2025 |
|
Forecast Year |
2026-2035 |
|
CAGR |
6.5% |
|
Base Year Market Size (2025) |
USD 16.09 billion |
|
Forecast Year Market Size (2035) |
USD 29.9 billion |
|
Regional Scope |
|
Reflective Materials Market Segmentation:
Vehicle Applications Segment Analysis
The automotive markings sub-segment is projected to dominate the reflective materials market with a 53% share of the global reflective materials market by 2035, driven by increasing government regulations concerning vehicle safety and visibility across the globe, where laws mandate the use of reflective markings on both commercial and personal vehicles to enhance nighttime safety. With a turnover of over USD 240 billion (20 lakh crore), the Indian automobile industry makes a significant contribution to the nation's manufacturing sector and economy. According to the Ministry of Heavy Industries' Annual Report 2024–25, the Indian auto industry supports over 30 million jobs (4.2 million direct and 26.5 million indirect). Moreover, advancements in retroreflective technology have enhanced durability and visibility in various conditions, thus encouraging automotive original equipment manufacturers (OEMs) to incorporate these materials directly into their vehicle designs.
Industrial Safety Segment Analysis
Road signs are anticipated to dominate the reflective materials market by capturing a 30% share of the global reflective materials by 2035, significantly propelled by governments and transport authorities worldwide that are fueling this sub-segment. The Federal Highway Administration (FHWA) and European Road Safety Reports underscore the increasing investments in high-visibility road infrastructure aimed at reducing accidents, particularly in urban and high-traffic regions. Reflective materials for road signs are consistently enhanced for improved retro reflectivity and environmental durability, which in turn stimulates replacement cycles and growth opportunities. Additionally, the rising global focus on smart infrastructure and smart city initiatives further amplifies demand.
Consumer Electronics Segment Analysis
Display panels are anticipated to dominate the reflective materials market by capturing a 22% share of the global reflective materials by 2035. High-performance reflective films will play a crucial role in increasing brightness, contrast, and energy efficiency in LCDs, OLEDs, and future screens. Wearables and devices also use reflective coatings for durability and visibility; however, the greatest demand is found in display panels due to the use in smartphones, televisions, tablets, and monitors, driving the adoption of large portions of the market.
Our in-depth analysis of the reflective materials market includes the following segments:
|
Segments |
Subsegments |
|
Vehicle Application |
|
|
Industrial Safety |
|
|
Consumer Electronics
|
|
|
Product |
|
|
Material Type |
|
|
Application |
|

Vishnu Nair
Head - Global Business DevelopmentCustomize this report to your requirements — connect with our consultant for personalized insights and options.
Reflective Materials Market - Regional Analysis
Asia Pacific Market Insights
The APAC reflective materials market is anticipated to secure 40% of the global market share by the year 2035. This growth is primarily propelled by swift industrialization, governmental sustainability initiatives, and a heightened demand from the electronics, automotive, and infrastructure sectors. China is at the forefront of investments in green chemical technologies, whereas Japan and South Korea are concentrating on advanced materials such as gallium arsenide wafers. The expansion of manufacturing capabilities in India and Malaysia, strengthened by government incentives, further stimulates demand growth throughout the region.
China is anticipated to maintain the largest revenue share in Asia-Pacific by 2037, driven by substantial government investment and proactive industrial strategies that promote sustainable chemical manufacturing. The focus of the National Development and Reform Commission on green technology, along with the significant investments made by China National Chemical Corporation, guarantees ongoing dominance in the reflective materials market. Shanghai is the first city in China to enact laws prohibiting light pollution, and violators will be subject to fines of up to 50,000 yuan ($7,400) under the recently updated municipal environmental protection code. In 2021, 3,341 complaints about light pollution were made to the Shanghai Citizen Hotline.
Europe Market Insights
The European reflective materials market is anticipated to capture 28% of the global market share by 2035, propelled by rigorous environmental regulations, technological advancements, and an increase in industrial applications throughout the UK, Germany, France, etc. The heightened regulatory emphasis on sustainability, as outlined in the European Green Deal, along with financial support from Horizon Europe, is driving investments in more environmentally friendly reflective material chemicals, such as gallium arsenide wafer technologies. The demand is further enhanced by the automotive, electronics, and infrastructure sectors, which are adapting to meet safety and visibility standards.
Germany is projected to dominate the reflective materials market in Europe by 2035, capturing the largest revenue share owing to its sophisticated chemical manufacturing infrastructure, robust governmental backing for sustainability initiatives, and significant investments in green technologies. The nation’s dedication, as evidenced by the BMWK and VCI, to achieving climate-neutral chemical production stimulates demand, which is further bolstered by the increasing requirements of the automotive and electronics industries. Germany’s research and development ecosystem, exemplified by institutions such as Fraunhofer ICT, guarantees continuous innovation that aligns with the environmental objectives set by the EU.
Trade Data for Safety Glass Laminated for Vehicles & Aircraft in 2023
|
Country / Region |
Export Value (USD) |
Quantity (Kg) |
|
United Kingdom |
47,394.50 |
3,742,190 |
|
Germany |
358,971.82 |
36,605,100 |
|
France |
145,820.42 |
19,812,200 |
|
Italy |
276,536.52 |
36,331,700 |
|
Spain |
74,512.08 |
12,769,200 |
Source: WITS
North America Market Insights
The North American reflective materials market is anticipated to capture 15% of the global market share by 2035, due to the increasing use of reflective materials in construction, automotive, consumer electronics, and safety applications. The strong government focus on road safety standards and growing demand for energy-efficient solutions in buildings, streets, and electronics all serve to grow the North American reflective materials market. The leading companies in the reflective materials market are increasingly investing in improved reflective films and coatings. Also, the worker safety work and sustainable infrastructure development continue to increase demand for reflective materials across North America, specifically the U.S. and Canada.
Key Reflective Materials Market Players:
- BASF SE
- Company Overview
- Business Strategy
- Key Product Offerings
- Financial Performance
- Key Performance Indicators
- Risk Analysis
- Recent Development
- Regional Presence
- SWOT Analysis
- Dow Chemical Company
- LG Chem
- Mitsubishi Chemical Holdings
- Shin-Etsu Chemical
- Reliance Industries
- Covestro AG
- Wanhua Chemical Group
- LyondellBasell Industries
- SABIC
- INEOS
- Sumitomo Chemical
- Petronas Chemicals Group
- Celanese Corporation
- LG Household & Health Care
The market for reflective materials is primarily controlled by multinational corporations that utilize technological advancements and local production capabilities. Major companies like BASF and Dow emphasize sustainability efforts and the integration of digital supply chains. Asian firms, particularly LG Chem and Mitsubishi Chemical, are making significant investments in research and development of advanced materials, while Reliance Industries is increasing its capacity to satisfy the rising demand in the region. Strategic partnerships and investments in clean technology are fundamental to maintaining market leadership and gaining a competitive edge. The table below detailed list of the top 15 global manufacturers in the reflective materials chemical market, with market share estimates and country of origin:
Top 15 Global manufacturers in the reflective materials chemical market
Recent Developments
- In March 2024, BASF unveiled EcoFlex, a collection of biodegradable reflective polymers aimed at the automotive and safety apparel industries. The initial uptake in the first quarter of 2024 resulted in a 16% increase in market share for sustainable reflective materials across Europe. This introduction is in line with the growing regulatory focus on environmentally friendly materials.
- In January 2024, Dow partnered with BSB Nanotechnology, the world's first producer of premium rice husk-based specialty silica, suitable for both industrial and consumer electronics applications. According to market data, there is a projected 13% rise in the adoption rate of reflective coatings in the Asia-Pacific region by mid-2024
- Report ID: 2632
- Published Date: Sep 09, 2025
- Report Format: PDF, PPT
- Explore a preview of key market trends and insights
- Review sample data tables and segment breakdowns
- Experience the quality of our visual data representations
- Evaluate our report structure and research methodology
- Get a glimpse of competitive landscape analysis
- Understand how regional forecasts are presented
- Assess the depth of company profiling and benchmarking
- Preview how actionable insights can support your strategy
Explore real data and analysis
Frequently Asked Questions (FAQ)
About this Report
Connect with our Expert


Copyright @ 2026 Research Nester. All Rights Reserved.
