Ram BOP Market Outlook:
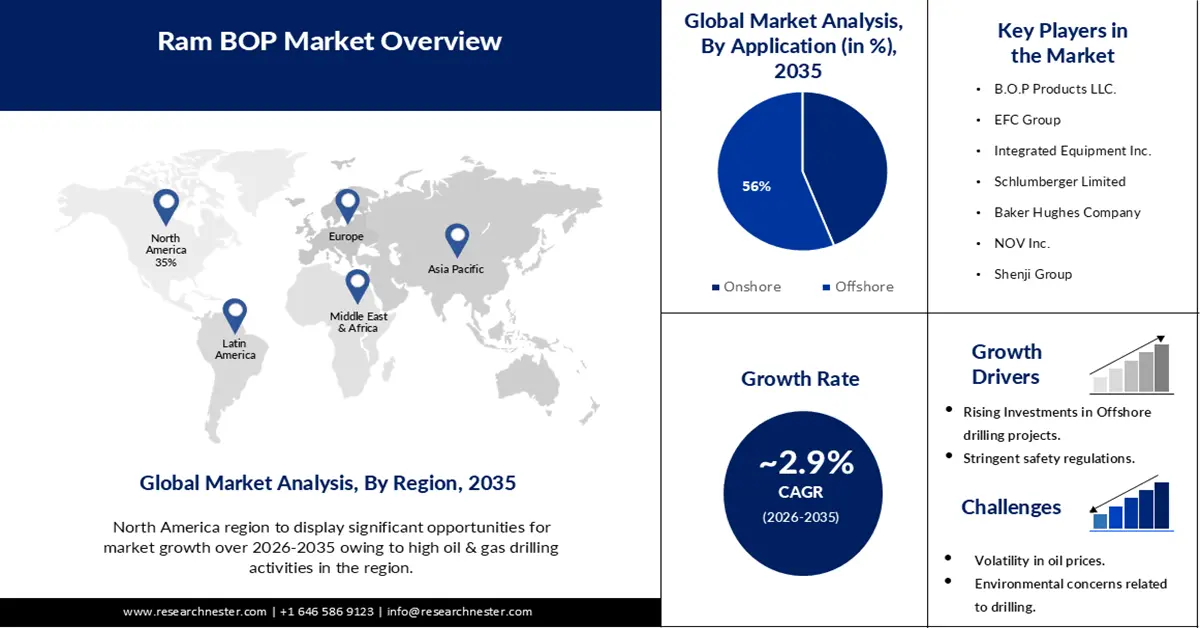
Ram BOP Market size was over USD 34.05 billion in 2025 and is projected to reach USD 45.32 billion by 2035, growing at around 2.9% CAGR during the forecast period i.e., between 2026-2035. In the year 2026, the industry size of ram BOP is evaluated at USD 34.94 billion.
A significant increase in global energy demand has been driven by a growing population, as well as consistent industrial development. As per statistics, the world's oil consumption rises between 3% and 10% by 2030 and between 6% and 42% by 2050 as compared to 2022. Consequently, the need for energy security has become paramount and oil and gas companies are increasingly encouraged to take advantage of their unexploited hydrocarbon resources. Moreover, oil and gas production maximize the income generated in these areas. The resulting increase in upstream investment will lead to an expansion of the global market for ram BOP, supported by strict regulation.
Additionally, a sizeable portion of the total cost incurred during the manufacturing of ram BOP is attributable to raw materials, such as basic steel. Therefore, the ram BOP market will be significantly impacted by worldwide changes in steel pricing. The cost of producing BOP is falling significantly along with the price of steel. Consequently, the decrease in the price of raw materials would boost the earnings of ram BOP producers, which is anticipated to positively affect the expansion of the market as a whole.
Key Ram BOP Market Insights Summary:
Regional Highlights:
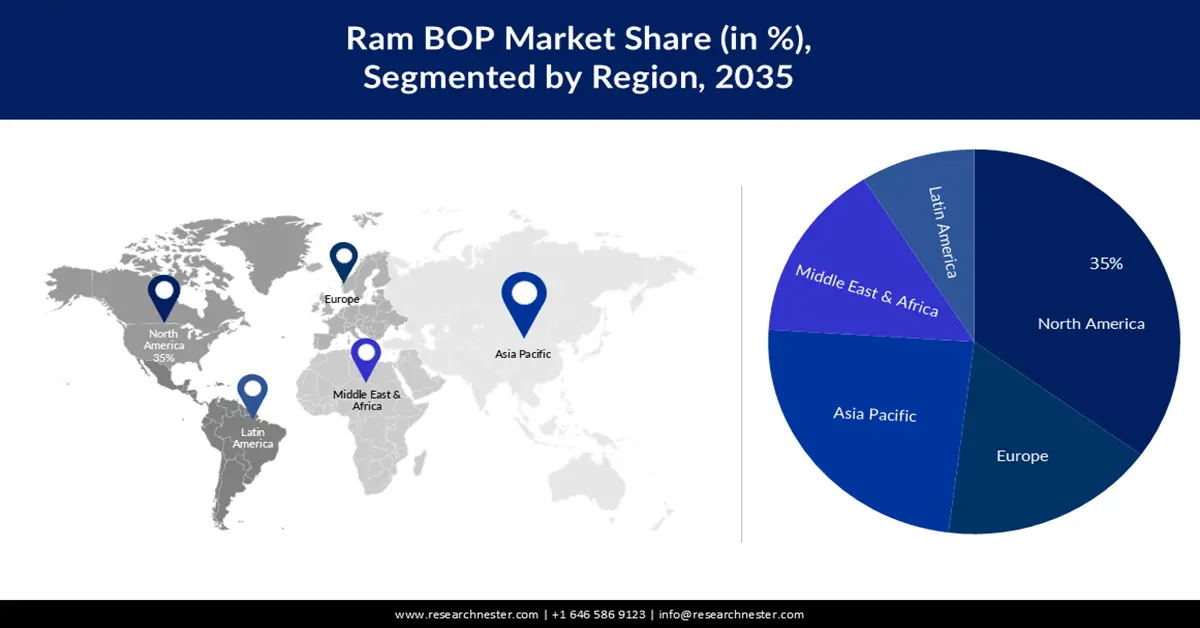
- North America is projected to command a 35% share of the ram BOP market by 2035, bolstered by the region’s abundant shale resources and expanding unconventional drilling activity.
- Asia Pacific is anticipated to secure a notable revenue share by 2035, supported by rising energy demand, rapid industrialization, and intensifying offshore exploration initiatives.
Segment Insights:
- The offshore segment is expected to capture a 56% share of the ram BOP market by 2035, propelled by escalating deep-water project development to meet growing crude oil consumption.
- The shear ram segment is set to garner the majority revenue share by 2035, underpinned by the heightened industry focus on well-control safety and stringent regulatory enforcement.
Key Growth Trends:
- Technological Advancements
- Stringent Safety Regulations
Major Challenges:
- Environmental Concerns
Key Players: B.O.P Products LLC., EFC Group, Integrated Equipment Inc., Schlumberger Limited, Baker Hughes Company, NOV Inc., Shenji Group, Jiangsu Sanyi Petroleum Equipment Co., Ltd., UZTEL S.A., AXON Pressure Products, Inc.
Global Ram BOP Market Forecast and Regional Outlook:
Market Size & Growth Projections:
- 2025 Market Size: USD 34.05 billion
- 2026 Market Size: USD 34.94 billion
- Projected Market Size: USD 45.32 billion by 2035
- Growth Forecasts: 2.9%
Key Regional Dynamics:
- Largest Region: North America (35% Share by 2035)
- Fastest Growing Region: Asia Pacific
- Dominating Countries: United States, China, Saudi Arabia, Russia, Canada
- Emerging Countries: India, Brazil, UAE, Indonesia, Mexico
Last updated on : 27 November, 2025
Ram BOP Market - Growth Drivers and Challenges
Growth Drivers
- Technological Advancements- The use of cutting-edge blowout preventer technology, like double Ram BOPs and remote-operated BOP systems, is increasing in the ram BOP market. With the improved control and monitoring capabilities provided by these technologies, operators can react promptly to any possible problems with control. The performance of Ram BOPs is also anticipated to be further optimized by the incorporation of digital technologies like artificial intelligence and the Internet of Things. Increased operational efficiency and safety result from this integration's ability to provide real-time monitoring, predictive maintenance, next generation memory, and data analytics.
- Emerging Trends- The growing use of remote monitoring and control systems is expected to present future growth prospects for the industry. Modern technologies enable control and monitoring systems that operate in real-time. By enabling real-time BOP performance monitoring, these cutting-edge solutions improve offshore drilling operations' efficiency and safety. Growing environmental concerns have also brought eco-friendly BOP designs with characteristics like better sealing mechanisms and lower emissions into sharper emphasis. Furthermore, the industry is seeing a trend in favor of the creation of BOPs that are small and light to facilitate drilling rig installation and transportation.
- Stringent Safety Regulations- Stringent safety and environmental regulations imposed by governments and industry bodies have propelled the demand for Ram BOPs. These regulations ensure that drilling operations adhere to strict safety standards, minimizing the risk of blowouts and catastrophic accidents. As a result, operators and drilling contractors are investing in high-quality Ram BOPs to comply with these regulations, driving the market growth.
Challenges
- Environmental Concerns- The increasing focus on sustainable drilling practices and environmental protection has led to a shift towards alternative energy sources. This transition may reduce the demand for conventional oil and gas drilling, restricting the ram BOP market’s growth.
- Fluctuations in oil prices directly impact explorations and may slow down drilling operation, which in turn affects the demand for Ram BOPs.
- The adoption of new technologies by operators and drilling contractors is comparatively slow due to cost considerations, operational disruptions, or a lack of familiarity.
Ram BOP Market Size and Forecast:
| Report Attribute | Details |
|---|---|
|
Base Year |
2025 |
|
Forecast Year |
2026-2035 |
|
CAGR |
2.9% |
|
Base Year Market Size (2025) |
USD 34.05 billion |
|
Forecast Year Market Size (2035) |
USD 45.32 billion |
|
Regional Scope |
|
Ram BOP Market Segmentation:
Application Segment Analysis
The offshore segment is expected to hold 56% share of the global ram BOP market by 2035. There has been an increase in offshore exploration and production (E&P) activity recently due to the expanding number of mature onshore. As observed by Research Nester Analysts, in 2019, offshore oil production was over 27 million barrels. To fulfill the rising demand, the oil and gas sector is consequently turning its attention to deeper locations in quest of oil and gas. The demand for ram BOPs is thus projected to increase during the forecast period as a result of the increased deepwater offshore project development to satisfy the rising crude oil consumption
Type Segment Analysis
Ram BOP market from the shear ram segment is estimated to garner the majority revenue share. The growth of the shear ram segment can be attributed to several factors. There is a growing emphasis on safety and well control in the oil and gas industry. Shear Ram plays a critical role in preventing blowouts and ensuring the safety of drilling operations. The increasing awareness and implementation of stringent safety regulations have led to a higher demand for shear rams. Further, technological advancements have improved the performance and reliability of shear Rams. Manufacturers are continuously innovating to develop more efficient and effective cutting technologies, enhancing the shear ram’s ability to quickly and effectively seal off the wellbore, thus augmenting the segment’s growth.
Our in-depth analysis of the global ram BOP market includes the following segments:
|
Application |
|
|
Type |
|

Vishnu Nair
Head - Global Business DevelopmentCustomize this report to your requirements — connect with our consultant for personalized insights and options.
Ram BOP Market - Regional Analysis
North American Market Insights
North America industry is likely to dominate majority revenue share of 35% by 2035. The region has experienced growth in recent years, driven by several key factors. These region’s abundant shale gas resources and the growth of unconventional drilling techniques, such as hydraulic fracturing, have led to a surge in drilling activities. This increase in drilling operations has created a substantial demand for Ram BOPs in North America. Additionally, stringent safety regulations and a focus on well control have further propelled the adoption of Ram BOPs in the region. As Analyzed, by Research Nester analysts, the data show the expected number of oil and gas wells drilled in the United States from 2014 to 2017, with a forecast period for 2018 until 2022. There were estimated to be 16,900 oil and gas wells drilled across the United States during 2017, which increased to 22,600 by 2022. The North American oil and gas industry places a strong emphasis on safety, and Ram BOPs play a critical role in preventing blowouts and ensuring well integrity. As North America continues to be a prominent player in the global oil and gas industry, the demand for Ram BOPs is expected to remain strong. Manufacturers and stakeholders in the region should continue to invest in research and development, collaborate with operators, and adapt to evolving market needs to capitalize on the growing opportunities in the North American market.
APAC Market Insights
Asia Pacific ram BOP market is estimated to garner notable revenue share during the forecast period. The region’s increasing energy demand, rapid industrialization, and exploration activities have been key drivers for the market’s growth. Countries like China, India, Australia, and Indonesia have witnessed substantial investments in the oil and gas sector, particularly in offshore drilling operations. As a result, the demand for reliable and efficient Ram BOPs has surged. Strict safety regulations imposed by governments and regulatory bodies in the region have further fueled the adoption of Ram BOPs. These regulations prioritize well control and the prevention of blowouts, making Ram BOPs an essential component of drilling operations. Moreover, technological advancements have played a crucial role in the Asia Pacific ram BOP market. Manufacturers in the region have focused on developing advanced Ram BOP technologies to enhance performance, efficiency, and safety. This has attracted significant interest from oil and gas companies.
Ram BOP Market Players:
- B.O.P Products LLC.
- Company Overview
- Business Strategy
- Key Product Offerings
- Financial Performance
- Key Performance Indicators
- Risk Analysis
- Recent Development
- Regional Presence
- SWOT Analysis
- EFC Group
- Integrated Equipment Inc.
- Schlumberger Limited
- Baker Hughes Company
- NOV Inc.
- Shenji Group
- Jiangsu Sanyi Petroleum Equipment Co., Ltd.
- UZTEL S.A.
- AXON Pressure Products, Inc.
Recent Developments
- Petrobras take home the 2024 OTC Brasil Distinguished Achievement Award for a newly constructed well and intervention development. This allows for the replacement of tethered rigs with more contemporary DP rigs by combining a BOP with real-time riser analysis. When compared to typical rigs, the company claims that this technology reduces costs and emissions by 99% and shortens the period of interventions in shallow-water wells by seven days. It also lessens the impact of anchoring on the seabed. After adjusting with the BOP anchored for this purpose, it should enable rigs operating in deepwater regions to also function in shallow water, particularly crowded or environmentally sensitive offshore areas.
- Pelican Energy Partners ("Pelican"), in collaboration with Keith Klopfenstein and Gus Halas, has completed an investment in Axon Pressure Products, Inc. ("Axon"), a stand-alone producer and supplier of pressure control equipment, including BOPs, flow control equipment, and BOP controls. With offices in Houston, Texas, and Houma, Louisiana, Axon has two service centers.
- Report ID: 5545
- Published Date: Nov 27, 2025
- Report Format: PDF, PPT
- Explore a preview of key market trends and insights
- Review sample data tables and segment breakdowns
- Experience the quality of our visual data representations
- Evaluate our report structure and research methodology
- Get a glimpse of competitive landscape analysis
- Understand how regional forecasts are presented
- Assess the depth of company profiling and benchmarking
- Preview how actionable insights can support your strategy
Explore real data and analysis
Frequently Asked Questions (FAQ)
Ram BOP Market Report Scope
Free Sample includes current and historical market size, growth trends, regional charts & tables, company profiles, segment-wise forecasts, and more.
Connect with our Expert


Copyright @ 2026 Research Nester. All Rights Reserved.
