Protective Coatings Market Outlook:
Protective Coatings Market size was USD 17 billion in 2025 and is estimated to reach USD 33.1 billion by the end of 2035, expanding at a CAGR of 6.9% during the forecast period, i.e., 2026-2035. In 2026, the industry size of protective coatings is evaluated at USD 18.1 billion.
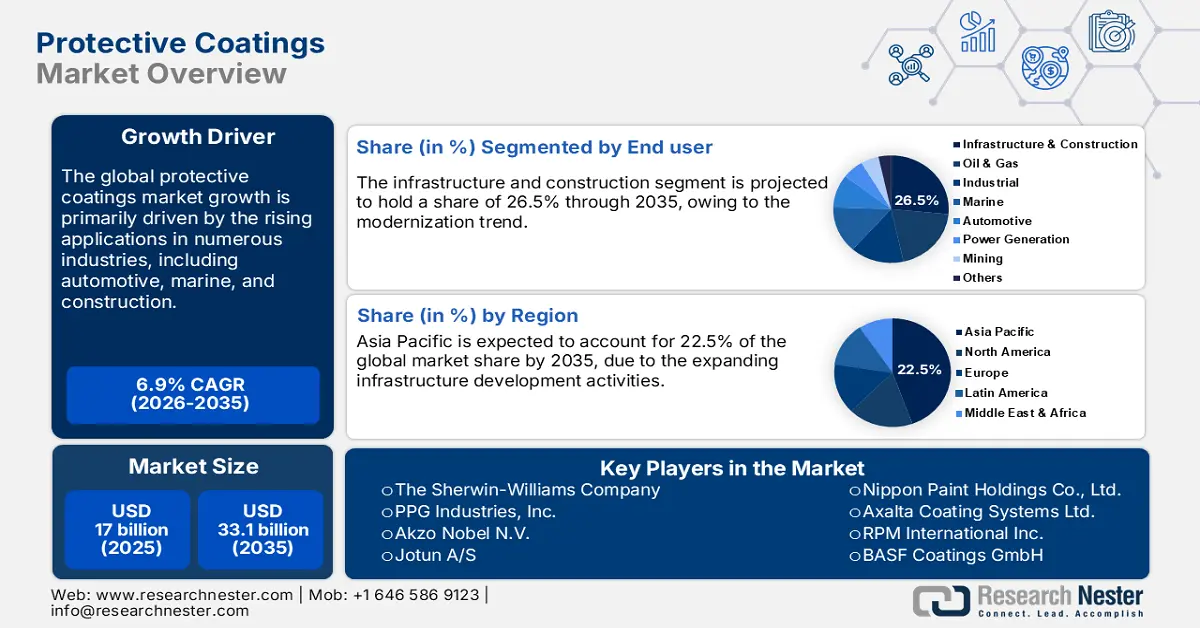
High-performance epoxy and polyurethane coatings are increasingly being demanded by sectors such as offshore oil and gas, infrastructure, and heavy machinery. The advanced features and high performance are boosting the sales of protective coatings. The rigs and pipelines that are vulnerable to harsh saline environments and extreme pressures require highly corrosion-resistant and high-performance coating solutions. In June 2025, the Global Wind Energy Council (GWEC) revealed that the offshore wind installed capacity reached 83 GW. Last year, governments around the world held auctions that added a record-breaking 56 gigawatts of new wind power capacity. The industry is also witnessing the construction of another 48 gigawatts of offshore wind projects globally. Overall, the offshore energy market is expected to act as a revenue driver for protective coating producers.
Key Protective Coatings Market Insights Summary:
Regional Highlights:
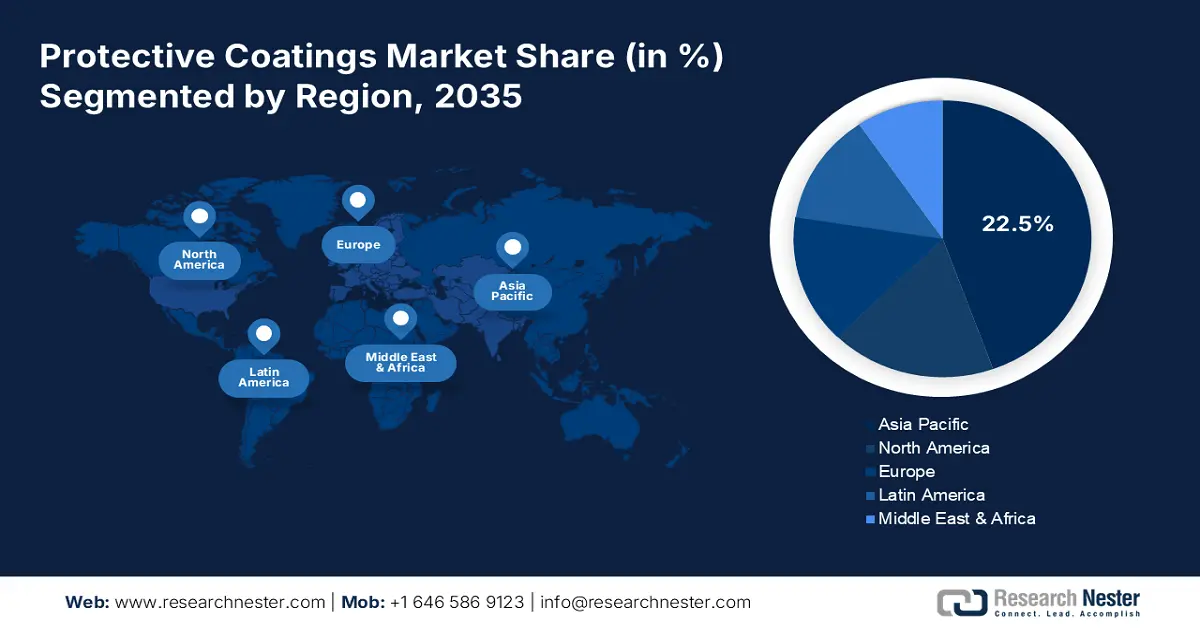
- By 2035, the Asia Pacific region is expected to command 22.5% of the Protective Coatings Market, supported by rapid urbanization and industrial expansion.
- North America is projected to secure the second-largest share by 2035, underpinned by escalating residential and commercial construction activities.
Segment Insights:
- By 2035, the infrastructure and construction segment in the Protective Coatings Market is set to capture a 26.5% share, bolstered by extensive global infrastructure modernization initiatives.
- The epoxy segment is projected to retain the leading market position through 2035, sustained by its broad application across industrial, marine, and structural assets.
Key Growth Trends:
- Rising adoption of smart and nanocoatings
- Application in the renewable energy sector
Major Challenges:
- Stringent environmental regulations
- Raw material price volatility
Key Players: The Sherwin-Williams Company, PPG Industries, Inc., Akzo Nobel N.V., Jotun A/S, Hempel A/S, Nippon Paint Holdings Co., Ltd., Axalta Coating Systems Ltd., RPM International Inc. (Carboline), BASF Coatings GmbH, Sika AG, KCC Corporation, DuluxGroup Limited, Asian Paints Limited, Berger Paints India Limited, Sersol Berhad.
Global Protective Coatings Market Forecast and Regional Outlook:
Market Size & Growth Projections:
- 2025 Market Size: USD 17 billion
- 2026 Market Size: USD 18.1 billion
- Projected Market Size: USD 33.1 billion by 2035
- Growth Forecasts: 6.9% CAGR (2026-2035)
Key Regional Dynamics:
- Largest Region: Asia Pacific (22.5% Share by 2035)
- Fastest Growing Region: Europe
- Dominating Countries: United States, China, Germany, Japan, United Kingdom
- Emerging Countries: India, South Korea, Brazil, Australia, Mexico
Last updated on : 22 September, 2025
Protective Coatings Market - Growth Drivers and Challenges
Growth Drivers
- Rising adoption of smart and nanocoatings: The technological shift is expected to fuel the demand for smart and nanocoatings in the coming years. The marine, aerospace, and defense industries are poised to emerge as the prime end users of smart coating solutions. The U.S. Marine Highway Program (USMHP) aimed at strengthening the use of navigable waterways, is also expected to have a positive influence on the sales of protective coatings. Overall, the aggressive investments for the advancement of these industries are set to fuel the demand for high-performance coating solutions.
- Application in the renewable energy sector: The clean energy trend and strict environmental regulations are accelerating the demand for high-performance coating solutions. The wind, solar, and hydropower equipment that needs advanced surface protection is expected to double the earnings of major companies. The United Nations reports that in 2024, USD 2 trillion was invested in clean energy, which is USD 800 billion more than was spent on fossil fuels and a nearly 70% increase over the past ten years. In 2023, the clean energy industry was responsible for 10% of the world’s economic growth. This indicates that renewable energy is the most lucrative market for protective coating manufacturers.
- Protective coatings for EV batteries and components: The propelling electric vehicle and battery trade is likely to open high-earning opportunities for protective coating manufacturers. EV applications demand specialized solutions for thermal management and fire protection, which directly propel the consumption of protective coatings. According to the International Energy Agency (IEA), the global trade of EV cars crossed 16.9 million in 2024. The same source also states that the developing countries in Asia and Latin America are seeing a big rise in electric car sales, which grew by over 60% in 2024 to nearly 600,000 vehicles. This is about the same as Europe’s electric car market five years ago. This indicates that the EV market is set to amplify the demand for protective coatings in the years ahead.
Challenges
- Stringent environmental regulations: The strict environmental regulations are expected to hinder the sales of protective coatings to some extent. Many countries implement stringent rules on the use of volatile organic compounds (VOCs), which creates challenges for the production of protective coatings. The U.S. Environmental Protection Agency (EPA) and the European Chemicals Agency (ECHA) under REACH tightened the VOC emission limits, hampering the overall market growth.
- Raw material price volatility: The raw material supply chain disruptions often impact the production costs and profit margins. The polyurethane feedstocks and solvents are highly sensitive to global supply-demand imbalances and crude oil fluctuations. This limits the market entry of new companies and the expansion of smaller players. Thus, the raw material volatility remains a persistent challenge for the protective coatings industry.
Protective Coatings Market Size and Forecast:
| Report Attribute | Details |
|---|---|
|
Base Year |
2025 |
|
Forecast Year |
2026-2035 |
|
CAGR |
6.9% |
|
Base Year Market Size (2025) |
USD 17 billion |
|
Forecast Year Market Size (2035) |
USD 33.1 billion |
|
Regional Scope |
|
Protective Coatings Market Segmentation:
End user Segment Analysis
The infrastructure and construction segment is poised to capture 26.5% of the global market share by 2035. The smart cities and robust infrastructure modernization projects are set to fuel the sales of protective coatings in the years ahead. NEOM: The City of Tomorrow, Grand Paris Express, HS2 U.K., The Regional Environmental Sewer Conveyance Upgrade Program (RESCU), and Brenner Base Tunnel are some of the largest infrastructure projects transforming construction globally. This is directly accelerating the production and commercialization of corrosion-resistant and fire-resistant coatings.
Resin Type Segment Analysis
The epoxy segment is projected to capture the largest market share throughout the forecast period. The pipelines, offshore platforms, bridges, and industrial flooring are some of the key application areas of epoxy resins. In the marine industry, epoxy-based anti-corrosive primers are also the foundation for multi-layer protective systems. According to The Observatory of Economic Complexity (OEC), the global trade of epoxide resins totaled USD 6.49 billion. The widespread application of epoxy resins is significantly contributing to their sales growth.
Formation Technology Segment Analysis
The solvent-based coatings are expected to be the top choice in the market, due to their superior performance and versatility. These solvent-based formulations are highly durable, with corrosion & chemical resistance, which accelerates their application in the oil & gas, infrastructure, and marine sectors. Also, their ability to offer longer shelf life and faster drying times contributes to their increasing consumption.
Our in-depth analysis of the global market includes the following segments:
|
Segment |
Subsegments |
|
Resin Type |
|
|
Formulation Technology |
|
|
End user |
|

Vishnu Nair
Head - Global Business DevelopmentCustomize this report to your requirements — connect with our consultant for personalized insights and options.
Protective Coatings Market - Regional Analysis
APAC Market Insights
The Asia Pacific market is estimated to account for 22.5% of the global revenue share through 2035. The rapid urbanization and industrialization activities are boosting the sales of protective coatings. The massive infrastructure investments are also fueling the consumption of protective coatings. The marine, oil & gas, automotive, aerospace, and power generation are prime end use industries for protective coatings. Further, China, India, Japan, and South Korea are expected to lead the protective coating sales throughout the forecast period.
The sales of protective coatings in India are expected to be driven by the strong infrastructure development and industrial expansion activities. The rising public and private spending on infrastructure modernization is attracting numerous international players. According to a study by the India Brand Equity Foundation (IBEF), the country’s infrastructure investment is estimated to steadily expand from 5.3% of GDP in FY24 to 6.5% of GDP by FY29. The expanding automotive and clean energy sectors are also propelling the consumption of protective coatings.
North America Market Insights
The North American protective coatings market is anticipated to hold the second-largest market share through 2035. The robust rise in residential and commercial infrastructure projects is likely to propel the demand for protective coatings. The region’s aging transportation networks, including bridges, highways, and tunnels, are also boosting the consumption of corrosion- and fire-resistant coatings. The manufacturers of protective coatings are also earning hefty revenues from the aerospace and defense industry, owing to the high demand for high-performance coatings that can withstand extreme environments.
The U.S. accounts for the largest share of North America's protective coatings market, owing to the massive infrastructure modernization projects and industrial automation programs. A significant boom in construction activities is also fueling the demand for advanced protective coating solutions. The Federal Reserve Bank of St. Louis discloses that the producer price index for final demand construction stood at 178.865 in July 2025. The constant upward curve is likely to accelerate the consumption of protective coatings in the country.
Europe Market Insights
The European protective coatings market is foreseen to increase at the fastest pace between 2026 and 2035, owing to the strong presence of well-established automotive and renewable energy sectors. The advanced manufacturing enterprises and stringent environmental regulations are also contributing to the increasing sales of protective coatings. The Netherlands, Germany, the U.K., and France are among the lucrative markets for protective coating manufacturers.
The Germany protective coatings market growth is estimated to be driven by its strong industrial base and automotive leadership. The push to update infrastructure and expand clean energy is expected to increase the need for high-quality coatings. Turbine blades, towers, and offshore platforms need coatings that resist UV rays and corrosion to handle tough conditions. Also, the marine industry, especially shipyards in the northern part of the country, keeps driving demand for coatings that prevent buildup on ships.
Key Protective Coatings Market Players:
- The Sherwin-Williams Company
- Company Overview
- Business Strategy
- Key Product Offerings
- Financial Performance
- Key Performance Indicators
- Risk Analysis
- Recent Development
- Regional Presence
- SWOT Analysis
- PPG Industries, Inc.
- Akzo Nobel N.V.
- Jotun A/S
- Hempel A/S
- Nippon Paint Holdings Co., Ltd.
- Axalta Coating Systems Ltd.
- RPM International Inc. (Carboline)
- BASF Coatings GmbH
- Sika AG
- KCC Corporation
- DuluxGroup Limited
- Asian Paints Limited
- Berger Paints India Limited
- Sersol Berhad
The market is characterized by the presence of industry giants and the increasing emergence of start-ups. The big companies are aggressively employing R&D, technological innovations, and mergers & acquisitions strategies to boost their revenue shares. They are entering into strategic partnerships with other players and also collaborating with raw material suppliers to earn hefty profit margins. Some of the key players are expanding their operations into emerging markets to earn lucrative shares from untapped opportunities.
Here is a list of key players operating in the global market:
Recent Developments
- In September 2024, PPG introduced its PPG STEELGUARD 951 epoxy fire protection coating in the American market. This new fire-resistant product is made for advanced manufacturing facilities.
- In April 2024, BASF’s coating division announced the launch of eco-efficient clearcoats and undercoats. These solutions are expected to boost the company’s sustainability goals and profit margins.
- Report ID: 1314
- Published Date: Sep 22, 2025
- Report Format: PDF, PPT
- Explore a preview of key market trends and insights
- Review sample data tables and segment breakdowns
- Experience the quality of our visual data representations
- Evaluate our report structure and research methodology
- Get a glimpse of competitive landscape analysis
- Understand how regional forecasts are presented
- Assess the depth of company profiling and benchmarking
- Preview how actionable insights can support your strategy
Explore real data and analysis
Frequently Asked Questions (FAQ)
Protective Coatings Market Report Scope
Free Sample includes current and historical market size, growth trends, regional charts & tables, company profiles, segment-wise forecasts, and more.
Connect with our Expert


Copyright @ 2026 Research Nester. All Rights Reserved.
