- Introduction
- Market Definition and Segmentation
- Study Assumptions and Abbreviations
- Research Methodology
- Secondary Research
- Primary Research
- SPSS Approach
- Data Triangulation
- Executive Summary
- Global Industry Overview (1/2)
- Market Overview
Client Area of Interest
- Regional Synopsis
- Global Oxo Chemicals Demand Outlook
- Demand Share By Type And Region
- Top Import & Export Markets
- Regional Buyers And Suppliers Overview
- Breakdown Of Oxo Chemicals By Product Category
- Comprehensive End-User Sector Analysis For Oxo Chemicals
- Production Capacity Analysis by Major Companies
- Competitive Landscape
- BASF SE
- Dow
- Eastman Chemical Company
- Evonik Industries
- Exxon Mobil Corporation
- INEOS
- LG Chem
- OQ SAOC
- Perstorp
- The Andhra Petrochemicals Limited
- Industry Supply Chain Analysis
- DROT
- Driver
- Restraint
- Opportunities
- Trends
- Government Regulation: How they would aid businesses?
- Ongoing Technological Advancements
- Price Benchmarking
- SWOT Analysis
- Patents Filed in the Industry
- Strategic Risk Landscape: Navigating Challenges
- Root Cause Analysis (RCA) for the Market
- Pestle Analysis
- Porter Five Forces
- Industry Risk Assessment
- Global Outlook and Projections (1/2)
- Global Overview
- Market Value (USD Million), Volume (Thousand Tons), Current and Future Projections, 2020-2036
- Increment $ Opportunity Assessment, 2020-2036
- Year-on-Year Growth Forecast (%)
- Global Segmentation (USD Million), 2020-2036, By
- Product Type, Value (USD Million), Volume (Thousand Tons)
- N-Butyraldehyde
- 2-Ethylhexanoic acid(2-EHA)
- [Plasticizer] Triethylene glycol-di-(2-ethylhexanoate)₂ (3G8/3GO)
- Triethylene glycol
- Others
- Application, Value (USD Million)
- Plasticizers
- Coatings
- Adhesives
- Textile Chemicals
- Others
- End-Use, Value (USD Million)
- Automotive
- Construction
- Electronics
- Consumer Goods
- Textile
- Pharmaceuticals
- Personal Care
- Others
- Regional Synopsis (USD Million), 2020-2036
- North America, Value (USD Million), Volume (Thousand Tons)
- Europe, Value (USD Million), Volume (Thousand Tons)
- Asia Pacific, Value (USD Million), Volume (Thousand Tons)
- Rest of World, Value (USD Million), Volume (Thousand Tons)
- Product Type, Value (USD Million), Volume (Thousand Tons)
- Global Overview
- North America Market (1/2)
- Overview
- Market Value (USD Million), Volume (Thousand Tons), Current and Future Projections, 2020-2036
- Increment $ Opportunity Assessment, 2020-2036
- Year-on-Year Growth Forecast (%)
- Segmentation (USD Million), 2020-2036, By
- Product Type, Value (USD Million), Volume (Thousand Tons)
- N-Butyraldehyde
- 2-Ethylhexanoic acid(2-EHA)
- [Plasticizer] Triethylene glycol-di-(2-ethylhexanoate)₂ (3G8/3GO)
- Triethylene glycol
- Others
- Application, Value (USD Million)
- Plasticizers
- Coatings
- Adhesives
- Textile Chemicals
- Others
- End-Use, Value (USD Million)
- Automotive
- Construction
- Electronics
- Consumer Goods
- Textile
- Pharmaceuticals
- Personal Care
- Others
- Product Type, Value (USD Million), Volume (Thousand Tons)
- Country Level Analysis, Value (USD Million), Volume (Thousand Tons)
- US
- Canada
- Rest of Americas
- Overview
- Europe Market (1/2)
- Overview
- Market Value (USD Million), Volume (Thousand Tons), Current and Future Projections, 2020-2036
- Increment $ Opportunity Assessment, 2020-2036
- Year-on-Year Growth Forecast (%)
- Segmentation (USD Million), 2020-2036, By
- Product Type, Value (USD Million), Volume (Thousand Tons)
- N-Butyraldehyde
- 2-Ethylhexanoic acid(2-EHA)
- [Plasticizer] Triethylene glycol-di-(2-ethylhexanoate)₂ (3G8/3GO)
- Triethylene glycol
- Others
- Application, Value (USD Million)
- Plasticizers
- Coatings
- Adhesives
- Textile Chemicals
- Others
- End-Use, Value (USD Million)
- Automotive
- Construction
- Electronics
- Consumer Goods
- Textile
- Pharmaceuticals
- Personal Care
- Others
- Product Type, Value (USD Million), Volume (Thousand Tons)
- Country Level Analysis, Value (USD Million), Volume (Thousand Tons)
- UK
- Germany
- France
- Italy
- Spain
- Russia
- Netherlands
- Switzerland
- Poland
- Belgium
- Rest of Europe
- Overview
- Asia Pacific Market (1/2)
- Overview
- Market Value (USD Million), Volume (Thousand Tons), Current and Future Projections, 2020-2036
- Increment $ Opportunity Assessment, 2020-2036
- Year-on-Year Growth Forecast (%)
- Segmentation (USD Million), 2020-2036, By
- Product Type, Value (USD Million), Volume (Thousand Tons)
- N-Butyraldehyde
- 2-Ethylhexanoic acid(2-EHA)
- [Plasticizer] Triethylene glycol-di-(2-ethylhexanoate)₂ (3G8/3GO)
- Triethylene glycol
- Others
- Application, Value (USD Million)
- Plasticizers
- Coatings
- Adhesives
- Textile Chemicals
- Others
- End-Use, Value (USD Million)
- Automotive
- Construction
- Electronics
- Consumer Goods
- Textile
- Pharmaceuticals
- Personal Care
- Others
- Product Type, Value (USD Million), Volume (Thousand Tons)
- Country Level Analysis, Value (USD Million), Volume (Thousand Tons)
- China
- Japan
- India
- South Korea
- Indonesia
- Taiwan
- Thailand
- Singapore
- Philippines
- Vietnam
- Malaysia
- Rest of Asia
- Overview
- Rest of World Market (1/2)
- Overview
- Market Value (USD Million), Current and Future Projections, 2020-2036
- Increment $ Opportunity Assessment, 2020-2036
- Year-on-Year Growth Forecast (%)
- Segmentation (USD Million), 2020-2036, By
- Product Type, Value (USD Million), Volume (Thousand Tons)
- N-Butyraldehyde
- 2-Ethylhexanoic acid(2-EHA)
- [Plasticizer] Triethylene glycol-di-(2-ethylhexanoate)₂ (3G8/3GO)
- Triethylene glycol
- Others
- Application, Value (USD Million)
- Plasticizers
- Coatings
- Adhesives
- Textile Chemicals
- Others
- End-Use, Value (USD Million)
- Automotive
- Construction
- Electronics
- Consumer Goods
- Textile
- Pharmaceuticals
- Personal Care
- Others
- Product Type, Value (USD Million), Volume (Thousand Tons)
- Overview
- About Research Nester
- Our Global Clientele
- We Serve Clients Across World
- Legal Disclaimer
Oxo Chemicals Market Outlook:
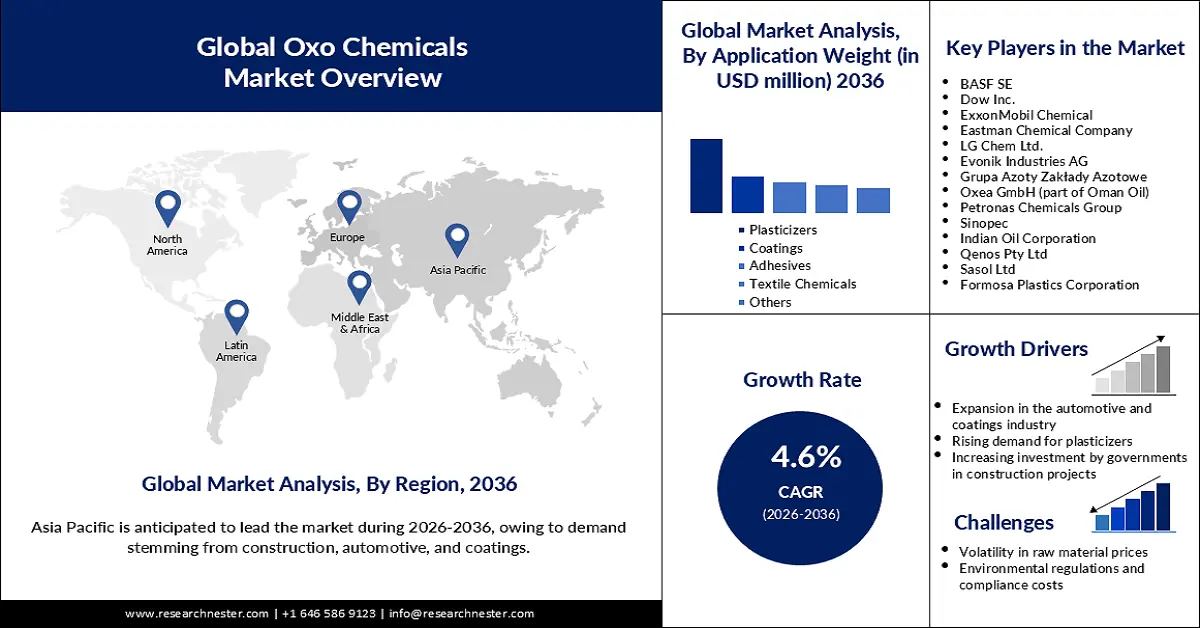
Oxo Chemicals Market size was valued at USD 21,122.6 million in 2025 and is projected to reach USD 35,209.4 million by the end of 2036, rising at a CAGR of 4.6% during the forecast period, i.e., 2026-2036. In 2026, the industry size of oxo chemicals is estimated at USD 22.403.2 million.
The growing demand for oxo derivatives across automotive, construction, consumer electronics, and other chemical-dependent industries is fueling the market growth. As estimated by the National Library of Medicine in May 2025, the plasticizer market globally is expected to reach a value of USD 22.5 billion in 2027 from USD 17 billion in 2022. Companies are active in the production and supply of oxo chemicals domestically as well as internationally to contribute to meeting the rising demand for different Oxo derivatives. For instance, in September 2024, Perstopr introduced Isononanol (INA), Iso-Dodecene, and Oxo Oil 9N to expand the organizational product portfolio of C8-C10 Oxo Alcohols. The PETRONAS Chemicals Isononanol Sdn Bhd (PC INA) is producing the newly added oxo chemicals at the Pengerang Integrated Complex in Malaysia.
Source: ITP
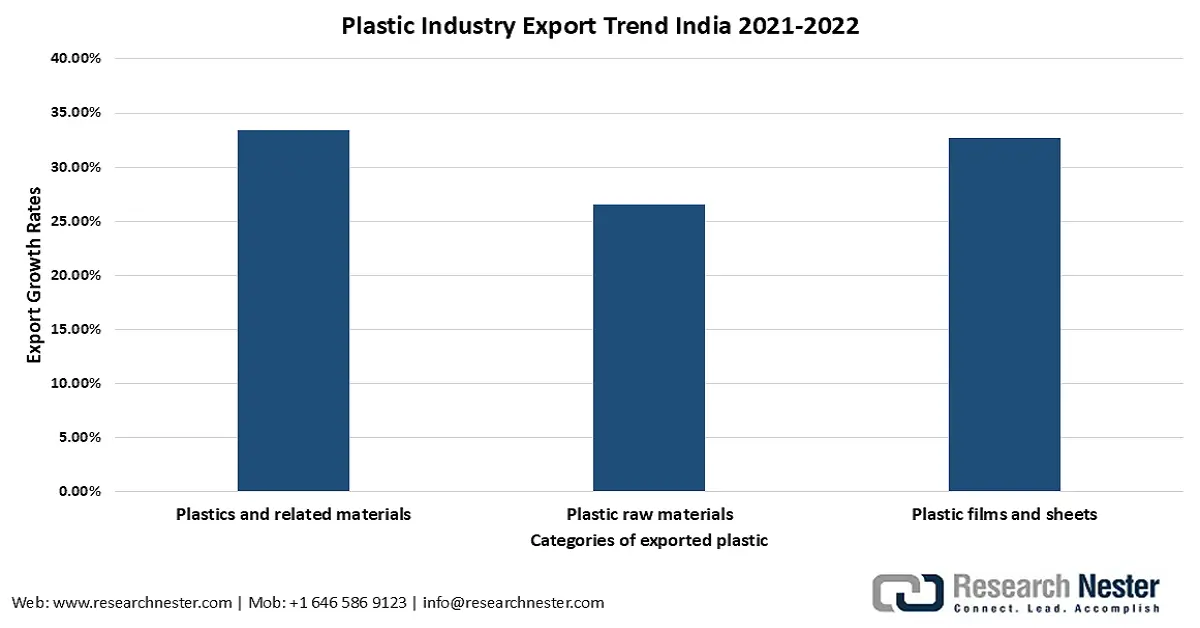
The rapid expansion of the global plastic industry is anticipated to boost the market growth. With rising plastic production, the need for plasticizers increases. As a result, the demand for oxo chemicals, especially oxo alcohol, surges as a derivative of plasticizers. As reported by the International Trade Administration in June 2024, plastic materials and products of USD 44.7 billion were exported by the U.S. in 2023 to the Free Trade Agreement Partners. Developing economies are also engaged in the trade of plastic materials, indicating an adequate demand for oxo chemicals to produce plasticizers.
Key Oxo Chemicals Market Insights Summary:
Regional Highlights:
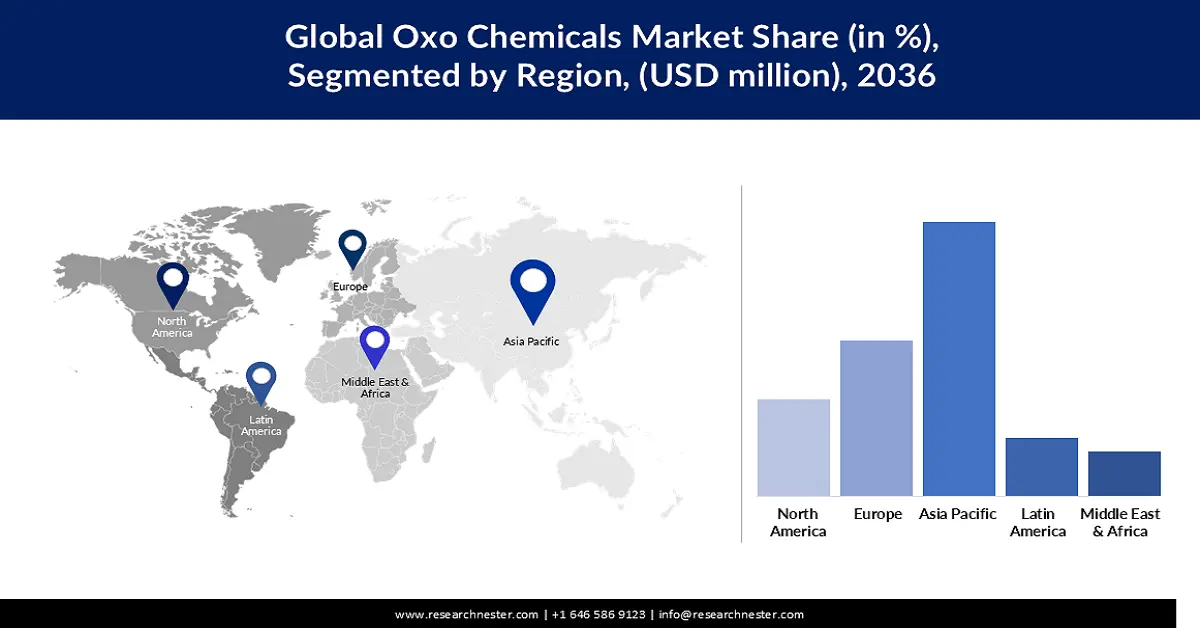
- Asia Pacific is set to hold a 43.7% share of the oxo chemicals market by 2036, supported by rising plasticizer use amid expanding construction activities in India and China.
- Europe is projected to account for 15.0% of the global share by 2036, attributed to sustained demand from construction, automotive, and coatings alongside the EU’s push for greener oxo derivatives.
Segment Insights:
- The plasticizers segment is projected to secure a 51.8% share by 2036 in the oxo chemicals market, propelled by their extensive use in flexible PVC production.
- By 2036, the [Plasticizer] Triethylene glycol-di-(2-ethylhexanoate)₂ (3G8/3GO) segment is anticipated to capture a 46.9% share, owing to the growing need for [Plasticizer] Triethylene glycol-di-(2-ethylhexanoate)₂ (3G8/3GO).
Key Growth Trends:
- Expansion in the automotive and coatings industry
- Rising demand for plasticizers
Major Challenges:
- Volatility in raw material prices
- Environmental regulations and compliance costs
Key Players: BASF SE (Germany), Dow Inc. (U.S.), ExxonMobil Chemical (U.S.), Eastman Chemical Company (U.S.), LG Chem Ltd. (South Korea), Evonik Industries AG (Germany), Grupa Azoty Zakłady Azotowe (Poland), Oxea GmbH (part of Oman Oil) (Germany), Petronas Chemicals Group (Malaysia), Sinopec (China), Indian Oil Corporation (India), Qenos Pty Ltd (Australia), Sasol Ltd (South Africa), Formosa Plastics Corporation (Taiwan).
Global Oxo Chemicals Market Forecast and Regional Outlook:
Market Size & Growth Projections:
- 2025 Market Size: USD 21,122.6 million
- 2026 Market Size: USD 22.403.2 million
- Projected Market Size: USD 35,209.4 million by 2036
- Growth Forecasts: 4.6% CAGR (2026-2036)
Key Regional Dynamics:
- Largest Region: Asia Pacific (43.7% Share by 2036)
- Fastest Growing Region: Asia Pacific
- Dominating Countries: United States, China, Germany, Japan, India
- Emerging Countries: Vietnam, Indonesia, Brazil, Mexico, Poland
Last updated on : 4 November, 2025
Oxo Chemicals Market - Growth Drivers and Challenges
Growth Drivers
- Expansion in the automotive and coatings industry: Global growth in the automotive and coatings industries requires oxo chemicals. As reported by the European Automobile Manufacturers' Association (ACEA) in September 2025, new car registration globally grew by 5% to 37.4 million in the first 6 months of 2025. Oxo derivatives used as solvents and plasticizers in automotive parts and industrial coatings are contributing to growth in the automotive and coatings industry. Increased spending on infrastructure has raised demand for coatings and adhesives, which has also increased demand for oxo chemicals.
- Rising demand for plasticizers: The demand for oxo alcohols, including 2-ethylhexanol and n-butanol, is likely to increase feedstock for plasticizers with the growing need to produce polyvinyl chloride (PVC) products. Construction and automotive demand for flexible PVC in cables and pipes, and for packaging materials, drives demand for plasticizers and ultimately for oxo chemicals. According to the disclosure by NITI Aayog, the demand for oxo alcohols was estimated to reach 47,000 tonnes per annum between April 2024 and April 2025.
- Increasing investment by governments in construction projects: Growing adoption of construction projects across different regions, driven by governments, is likely to fuel the demand for oxo chemicals. In June 2025, Invest India reported that the government of India raised more than USD 3.3 billion for 12 smart city projects under NICDC. Those projects include, but are not limited to, NICDC Industrial Corridors and Smart Cities, PM Gati Shakti Master Plan, Delhi-Mumbai Expressway, High Speed Rail Projects, and others. The use of the oxo chemicals in the construction industry is common for the production of different construction materials that include adhesives, coatings, and sealants.
Demand Supply Scenario Through March 2030 for Oxo Alcohol (n-Butanol and 2-Ethyl Hexanol)
|
Year |
Installed Capacity |
Capacity Utilization |
Production |
Domestic Demand |
Export Demand |
Total Demand |
Gap in Supply |
|
2021-22 |
70,500 |
80% |
56,400 |
110000 |
1000 |
111000 |
54600 |
|
2024-25 |
155500 |
80% |
124400 |
138568 |
1092 |
139660 |
15260 |
|
2029-30 |
155500 |
80% |
124400 |
203601 |
1604 |
205205 |
80805 |
Source: niti.gov
Challenges
- Volatility in raw material prices: The oxo chemicals sector depends heavily on petrochemical feedstocks (propylene, natural gas, and syngas). Crude oil and natural gas price fluctuations affect the price of these feedstocks, leading to uncertainty in the cost of production, which can reduce the margins of profit for manufacturers. In October 2025, the U.S. Energy Information Administration reported that a 22% increase in the average price of the NYMEX contract to $3.8/MMBtu was observed over the 12-month strip from November 2025 to October 2026. Supply disruptions in the global market that cause fluctuations (e.g., geopolitical conflicts, OPEC cutting production, pandemic-related disruptions) contribute to this volatility, making it hard for producers to secure long-term contracts or efficiently manage working capital, as well as giving stable pricing for its downstream customers (in diverse end-use industries).
- Environmental regulations and compliance costs: The oxo chemicals manufacturing is facing increasingly stricter environmental regulations, particularly related to emissions, waste, and solvents. Companies must invest in capital for compliance in the form of cleaner technologies, energy efficiency, and sustainable practices in relation to compliance with regulations such as REACH (EU), EPA (US), and rising carbon tax initiatives. Thus, the costs of operating and expansion of capacity are sometimes delayed, particularly for smaller producers, which, if they are unable to adapt to standards of compliance, will result in greater consolidation in the market. Companies that do not comply face an ever-increasing risk of fines, other penalties, reputational risk, and ultimately restricted, if not banned, entry into regulated economies.
Oxo Chemicals Market Size and Forecast:
| Report Attribute | Details |
|---|---|
|
Base Year |
2025 |
|
Forecast Year |
2026-2036 |
|
CAGR |
4.6% |
|
Base Year Market Size (2025) |
USD 21,122.6 million |
|
Forecast Year Market Size (2036) |
USD 35,209.4 million |
|
Regional Scope |
|
Oxo Chemicals Market Segmentation:
Application Segment Analysis
The plasticizers segment is predicted to gain the largest market share, 51.8%, primarily due to their extensive use in flexible PVC production. Oxo chemicals such as isononyl alcohol (INA), 2-ethylhexanol, and n-butanol serve as key intermediates in manufacturing phthalate and non-phthalate plasticizers. Companies are taking measures to fuel the production of the chemicals. For instance, a technology license agreement was signed between BASF and Ningbo Refining and Chemical Co. Ltd in October 2023 to create a global-scale INA production facility in China. A production capacity of 200,000 tons per year was planned for the plant. The consumption of plasticizers is likely to accelerate with the expansion of the construction, automotive, and consumer goods sectors. As a result, the demand for oxo chemicals for the production of plasticizers is projected to surge.
Additionally, the growing priority among consumers for eco-friendly and phthalate-free alternatives is prompting innovation in oxo-based formulations. A report by the Plastics for Change Foundation, published in February 2025, reveals that 54% of the U.S. population nowadays actively prefers products with eco-friendly packaging.
Product Type Segment Analysis
By 2036, [Plasticizer] Triethylene glycol-di-(2-ethylhexanoate)₂ (3G8/3GO) segment is expected to grow, acquiring a market share of 46.9%. Growth in the market is stimulated by the growing need for [Plasticizer] Triethylene glycol-di-(2-ethylhexanoate)₂ (3G8/3GO), a key intermediate for polyvinyl butyral (PVB) films. It finds an increasing application of [Plasticizer] Triethylene glycol-di-(2-ethylhexanoate)₂ (3G8/3GO) in PVC applications (construction and automotive) that are expanding rapidly. Active involvement of companies in the production of [Plasticizer] Triethylene glycol-di-(2-ethylhexanoate)₂ (3G8/3GO) is also noticed globally, expected to contribute to increasing the use of oxo-chemicals significantly. The sustainable offerings of the business is capable enough to reduce carbon emissions throughout the value chain.
End use Segment Analysis
The construction segment is expected to hold a market share of 32.4% by the end of 2036, owing to the booming need for PVC flooring, pipes, and other plasticized materials, driven by growing initiatives for urbanization, infrastructure development, and government spending on housing and utilities globally. In December 2023, the United Nations Industrial Development Organization disclosed that development in global industrial sectors, encompassing mining, manufacturing, water supply, electricity, waste management, and others, grew by 2.3%, manufacturing industry dominating with a 3.2% increase. Similarly, according to the disclosure by the Global Infrastructure Hub, spending in global infrastructure development is estimated to reach USD 94 trillion by 2040. In addition, a report by the PRS Legislative Research, released in February 2025, states that the government of India planned to launch a scheme worth USD 168.9 million to accomplish the construction of 100,000 housing units in challenging projects. Phthalate and non-phthalate plasticizers derived from oxo chemicals are extensively used in construction, making it the largest and most influential end-use subsegment globally.
Our in-depth analysis of the oxo chemicals market includes the following segments:
|
Segment |
Subsegments |
|
Product Type |
|
|
Application |
|
|
End use |
|

Vishnu Nair
Head - Global Business DevelopmentCustomize this report to your requirements — connect with our consultant for personalized insights and options.
Oxo Chemicals Market - Regional Analysis
Asia Pacific Market Insights
Asia Pacific will represent 43.7% of the global oxo chemicals market by 2036, spurred by the use of plasticizers in India and China's construction growth. As reported by the International Trade Administration in September 2025, China remained the largest market for the construction sector globally at a value of USD 4.8 trillion.
Some of the Mega Construction Projects in India as of 2025
|
Project names |
Milestones |
|
NICDC Industrial Corridors and Smart Cities |
Investment of around USD 3.2 billion surrounding 12 smart city projects |
|
Bharatmala Pariyojana Project |
Allocation of USD 53.1 billion and the completion of 19,826 km of roads |
|
Digital Highways Initiative |
The deployment of optic fibre cable infrastructure in the national highways covering around 10,000 km for the enhancement of connectivity in rural areas and simplification of 5G/6G rollout |
|
Western Dedicated Freight Corridor |
Construction of more than 1,506 km of road from UP to Maharashtra |
|
Delhi-Mumbai Expressway |
Eight-lane highway construction of 1,386 km |
|
Airport projects |
Operationalization of 625 UDAN routes, connecting 90 airports |
|
Khavda Renewable Energy Park |
The plan to establish a solar park covering 72,600 hectares of land with a budget of USD 95.3 million |
|
High Speed Rail Projects |
Allocation of a budget of USD 12.1 billion collaboratively by the governments of India and Japan for the completion of the Mumbai-Ahmedabad corridor only |
|
Vadhavan Port |
The plan for the establishment of a large strategic deep-water port through an investment of USD 8.5 billion |
Source: InvestIndia
The trade liberalization associated with ASEAN and bilateral trade agreements enables stronger sourcing capabilities for raw materials and enhances the export of products. Emerging R&D projects and sustainability-related regulatory developments are shaping the industry and leading to innovation and increased capacity to utilize oxo chemicals across the region, making the Asia Pacific the center of production of oxo chemicals.
China is the main player in the oxo chemicals market within the Asia Pacific region due to its large petrochemical complexes with integrated supply chains (upstream and downstream), as well as high consumption of oxo alcohols and plasticizers by end-user industries such as plastics, paints, coatings, etc. The governmental policies set as part of the 14th Five-Year Plan encourage green chemistry and energy efficiency, and encourage capital investment in advanced production. As revealed by the Information Technology and Innovation Foundation in April 2024, the government is incentivizing and supporting the companies involved in chemical production. Around 44% of the global chemical production took place in China. This indicates access to adequate funding for new entrepreneurs who have plans to be involved in the production of oxo chemicals. The sector is supported by demand for oxo alcohols such as 2-ethylhexanol and n-butanol from the construction and automotive sectors, record export performance, and the increasing adoption of sustainability in achieving NPRFA targets.
The oxo chemicals industry in India is expected to witness a rapid CAGR during the forecast period, on account of the continuous expansion of the automotive sector. As disclosed by the India Brand Equity Foundation in October 2025, automotive production in India reached 2.4 million units in June 2025 alone. The surge in automotive production influences an increased use of oxo chemicals as chemical intermediates and solvents for purposes such as paints, cements, coatings, and others. The expansion of the manufacturing sector is also projected to boost the utilization of the oxo chemicals. According to the report by the Press Information Bureau, published in September 2025, the manufacturing sector witnessed a growth of 5.4% in July 2025, up from 3.7% compared to June of the same business year.
Export Data for Compound Plasticizers
|
Year |
Country |
Export Value (USD thousands) |
Quantity (Kg) |
|
2023 |
China |
4,253.36 |
2,683,400 |
|
2023 |
Indonesia |
38.48 |
15,525 |
|
2023 |
India |
893.74 |
1,296,070 |
Source: WITS
Europe Market Insights
Europe will represent 15.0% of the global oxo chemicals market by 2036, due to demand stemming from construction, automotive, and coatings. Emerging and advanced economies in the EU, including sustainable chemical policies arising from the European Union's Green Deal, are stimulating the adoption of sustainable and green oxo derivatives and their applications. Europe has a significant share of global chemical production, and while functioning better as a specialty intermediary region, growth is still stable in the production of specialty intermediates.
The region has strong R&D basins, regulatory regimes, trade dynamics, and supply chain concentration, providing a high likelihood of capturing future value and economic competitiveness through innovation in the production of oxo-based applications. Oxo production in Europe is also expected to be increasingly sustainable in the upcoming years. As updated by the European Commission in July 2025, an action plan concerned with high costs of energy, unfair competition, and deteriorating demand was implemented to enhance the competitiveness and advancement of the chemical industry.
Germany is the largest producer of chemicals in Europe, where oxo chemicals have wide-ranging applications in automotive, lightweight materials, coatings, and construction products. According to the estimation by the Verband der Automobilindustrie (VDA) in February 2025, registration of approximately 873,000 EVs will take place within the country by the end of 2025. Additionally, with its top-tier infrastructure, high levels of R&D investment, and export-oriented market structure, Germany will continue to dominate the oxo chemicals production industry.
The oxo chemicals market in Italy is poised to experience a rapid expansion throughout the forecast timeline, on account of the requirement of the country to shift away from phthalates to comply with stringent EU regulations. Companies operating in Italy are also investing in the adoption of technologies that can enhance chemical production, influencing the production of oxo chemicals in more sustainable ways. For instance, in August 2024, Technip Energies and Mitsubishi Chemical licensed an enhanced OXO alcohol technology, OXO M-Process. The technology is likely to help significantly in reducing production and operating expenditures.
North America Market Insights
The North America oxo chemicals market is likely to contribute 11.9% of total revenue worldwide by 2036, due to eco-friendly plasticizer demand and federal clean energy policies. Increasing investments in green manufacturing and regulatory emphasis on green chemicals are influencing market conditions. In August 2025, the U.S. Environmental Protection Agency revealed that the government announced the Green Chemistry Challenge Awards to promote the development and utilization of green chemistry, which influenced the emergence of 133 relevant winning technologies through 2022.
North America has an established petrochemical infrastructure and innovation around many downstream applications, such as plasticizers and solvents. These activities around trade and regional agreements, along with cross-border supply agreements, strengthen the regional capacity and production ecosystem. In addition, partnerships between producers and organizations and research partners are enabling technology-oriented growth, especially in specialty oxo derivatives.
In the U.S., oxo chemicals market growth is driven by the growing demand for the compound in the development of plastics, adhesives, coatings, and pharmaceutical intermediates. A large pool of key players drives the market growth, contributing to increasing market accessibility of oxo chemicals through active production. For instance, in April 2024, Celanese Corporation announced the establishment of a novel 1.3-million-ton Clear Lake acetic acid facility. The company demands the facility as the lowest-cost and lowest-carbon footprint plant in the world. The key market players based in the U.S. foster further enhancement of the chemical and its products through investment in research and development, and the establishment of large distribution networks.
Canada is projected to emerge as an expanding oxo chemicals market at a robust CAGR during the stipulated timeframe, owing to the feedstock advantages that include the low cost of energy and natural gas. This is leading to a cost-effective production of the oxo chemicals within the country. Rising construction investments are also expected to fuel the consumption of the oxo chemicals. As reported by Statistics Canada in September 2025, the total building construction investment value surged by 0.4% to USD 22.7 billion in July. EV adoption in Canada is also on the rise, influencing an increasing use of oxo alcohols and their derivatives in coatings, solvents, plastics, and sealants. As disclosed by Transport Canada in October 2025, as a part of Canada’s 2030 Emissions Reduction Plan, the government is committed to achieving optimal sales of 100 zero-emission vehicles by 2035, following 20% and 60% increases by 2026 and 2030, respectively.
Key Oxo Chemicals Market Players:
- BASF SE (Germany)
- Company Overview
- Business Strategy
- Key Product Offerings
- Financial Performance
- Key Performance Indicators
- Risk Analysis
- Recent Development
- Regional Presence
- SWOT Analysis
- Dow Inc. (U.S.)
- ExxonMobil Chemical (U.S.)
- Eastman Chemical Company (U.S.)
- LG Chem Ltd. (South Korea)
- Evonik Industries AG (Germany)
- Grupa Azoty Zakłady Azotowe (Poland)
- Oxea GmbH (part of Oman Oil) (Germany)
- Petronas Chemicals Group (Malaysia)
- Sinopec (China)
- Indian Oil Corporation (India)
- Qenos Pty Ltd (Australia)
- Sasol Ltd (South Africa)
- Formosa Plastics Corporation (Taiwan)
- BASF is a global chemical powerhouse with a diverse portfolio spanning industrial chemicals, plastics, and performance products. In the oxo chemicals segment, BASF produces aldehydes, alcohols, and derivatives used in coatings, plasticizers, and solvents. Its strong R&D capabilities and integrated production facilities across Europe and Asia enable consistent innovation and sustainable manufacturing practices. BASF serves a broad range of industries, including automotive, construction, and consumer goods, strengthening its global market position.
- Dow Inc. is a leading multinational chemical company with extensive operations in specialty and industrial chemicals. Its oxo chemicals portfolio includes linear and branched alcohols, aldehydes, and plasticizers, supporting industries like adhesives, coatings, and lubricants. Dow leverages advanced process technologies and global manufacturing facilities to ensure supply chain reliability. Sustainability and eco-efficient solutions are central to its strategy, enhancing product appeal in environmentally conscious markets.
- ExxonMobil Chemical is a major global producer of base and specialty chemicals, including oxo alcohols and aldehydes. Its products are widely applied in plastics, coatings, personal care, and lubricant formulations. The company emphasizes technological innovation and operational efficiency, with integrated facilities that optimize production and reduce environmental impact. ExxonMobil Chemical’s strong global distribution network ensures accessibility to diverse industrial markets.
- Eastman Chemical Company focuses on specialty chemicals and materials with applications in adhesives, coatings, and performance plastics. In the oxo chemicals segment, Eastman produces alcohols, aldehydes, and derivatives for downstream chemical manufacturing. Its emphasis on research, sustainable processes, and product innovation supports market competitiveness. Eastman serves a broad spectrum of industries globally, including automotive, construction, and consumer products.
- LG Chem is a leading South Korean chemical company with operations in petrochemicals, advanced materials, and specialty chemicals. Its oxo chemicals portfolio includes linear alcohols and aldehydes used in coatings, plasticizers, and intermediates. The company combines large-scale production capacity with research-driven innovation to meet global demand. LG Chem’s strong presence in Asia and strategic partnerships expand its reach in the international oxo chemicals market.
Below is the list of the key players operating in the global oxo chemicals market:
The key players in the global oxo chemicals market are experiencing a high intensity of competition and are focused on sustainable production, technological innovation, and strategic partnerships to contribute to the industry's growth. They are even emphasizing bio-based oxo chemicals to comply with the stringent environmental regulations. Further, to enhance the efficiency of oxo chemical synthesis, Dow Chemical and Evonik Industries are applying state-of-the-art catalysts. Mergers and acquisitions within the market are being reported, leading expansion of the distribution network of the compound.
Corporate Landscape of the Oxo Chemicals Market:
Recent Developments
- In August 2024, BASF signed a Memorandum of Understanding (MoU) with UPC Technology Corporation, reinforcing their long-standing collaboration. This strategic partnership aims to strengthen long-term regional cooperation, focusing on the supply of plasticizer alcohols and catalysts for phthalic anhydride (PA) and maleic anhydride (MA). Additionally, the collaboration emphasizes the development of sustainable solutions to lower carbon emissions across both operations and products.
- In September 2022, Johnson Matthey (JM) and Dow announced that Anqing Shuguang Petrochemical Oxo Co., Ltd. (Anqing) had licensed LP Oxo Technology to produce approximately 200 kta of 2‑ethylhexanol and 25 kta of iso‑butyraldehyde. This marks Anqing’s second LP Oxo licence and the 23rd globally in China, supporting the expansion of its oxo alcohols business in the growing market. The new plant is expected to commence operations in 2024. Anqing initially adopted LP Oxo Technology in 2016, producing 100 kta of 2‑ethylhexanol, 115 kta of normal butanol, and 23 kta of iso‑butanol.
- Report ID: 983
- Published Date: Nov 04, 2025
- Report Format: PDF, PPT
- Explore a preview of key market trends and insights
- Review sample data tables and segment breakdowns
- Experience the quality of our visual data representations
- Evaluate our report structure and research methodology
- Get a glimpse of competitive landscape analysis
- Understand how regional forecasts are presented
- Assess the depth of company profiling and benchmarking
- Preview how actionable insights can support your strategy
Explore real data and analysis
Frequently Asked Questions (FAQ)
Oxo Chemicals Market Report Scope
Free Sample includes current and historical market size, growth trends, regional charts & tables, company profiles, segment-wise forecasts, and more.
Connect with our Expert


Copyright @ 2026 Research Nester. All Rights Reserved.
