Organic Dispersants Market Outlook:
Organic Dispersants Market size was over USD 6.09 billion in 2025 and is poised to exceed USD 10.5 billion by 2035, witnessing over 5.6% CAGR during the forecast period i.e., between 2026-2035. In the year 2026, the industry size of organic dispersants is estimated at USD 6.4 billion.
One of the most significant growth factors, driving the growth of this market is the increasing demand for organic dispersants in the real estate and construction industry. Day by day, the real estate and construction industry is rising in developing countries which is a further leading rise in this market. As per data, China is planning to exceed its railway line by 80,000 km in the coming years.
Additionally, the increasing demand for organic dispersants in the automotive industry is widely driving the growth of this market. Organic dispersants are used in the automotive industry in various ways such as it is used in painting and coating the automobile, used as lubricating oil for engines, and many more applications are there. As per the International Organization for Vehicle Motor Manufacturers, commercial vehicle production has grown 31.4% at 5731162 units in 2020 as compared to 4360475 units in 2019.
Key Organic Dispersants Market Insights Summary:
Regional Insights:
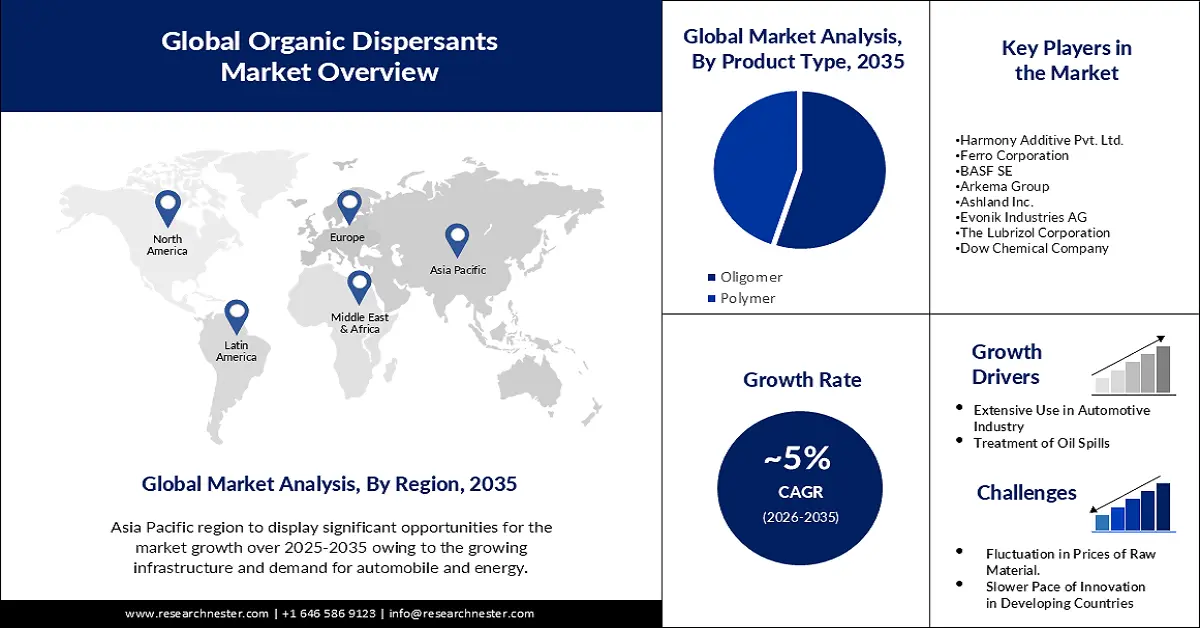
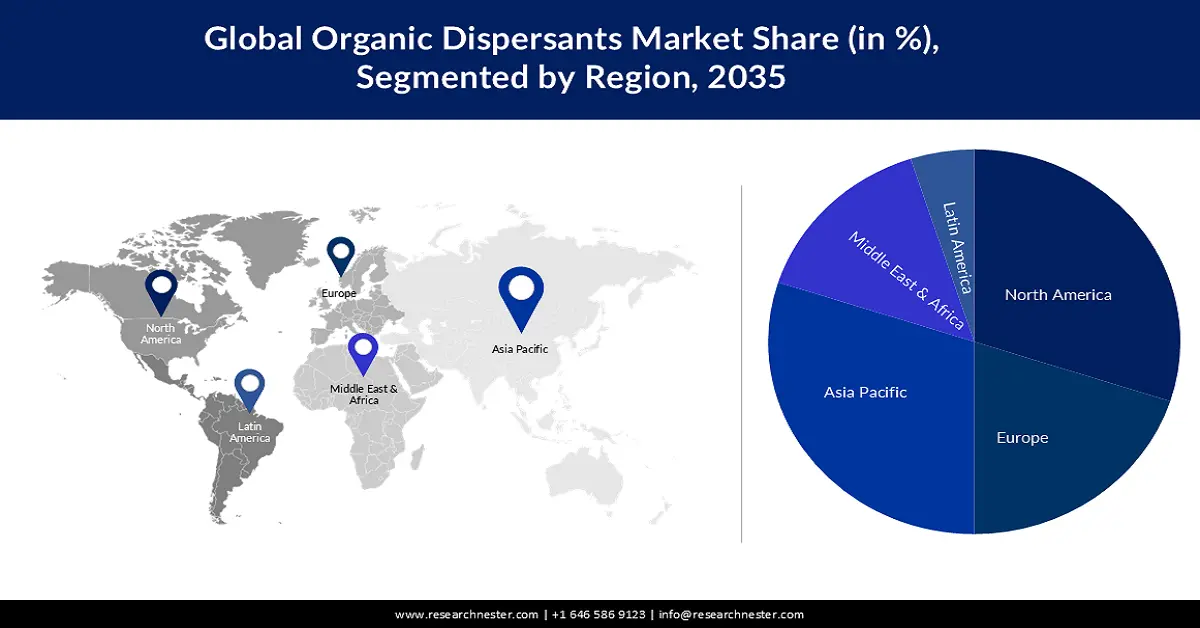
- By 2035, North America is expected to command the majority revenue share in the Organic Dispersants Market, attributable to rising energy demand and increasing investment in oil drilling activities.
- By 2035, the Asia Pacific region is projected to expand its market presence, spurred by accelerating automobile production and growing use of organic dispersants in automotive coatings.
Segment Insights:
- By 2035, the automotive industry segment in the Organic Dispersants Market is projected to hold the highest share, supported by the rising use of organic dispersants in automotive paints, coatings, and engine lubrication.
- By 2035, the oligomer organic dispersants segment is anticipated to secure a notable share, bolstered by its expanding utilization across cosmetics and pharmaceutical applications.
Key Growth Trends:
- Extensive Use in Automotive Industry
- Treatment of Oil Spills
Major Challenges:
- Fluctuation in the Prices of Raw Materials
- Stringent Government Regulations Imposed in Some Developed Countries
Key Players: Clariant Ltd., Harmony Additive Pvt. Ltd., Ferro Corporation, BASF SE, Arkema Group, Ashland Inc., Evonik Industries AG, The Lubrizol Corporation, Dow Chemical Company, DCL Corporation.
Global Organic Dispersants Market Forecast and Regional Outlook:
Market Size & Growth Projections:
- 2025 Market Size: USD 6.09 billion
- 2026 Market Size: USD 6.4 billion
- Projected Market Size: USD 10.5 billion by 2035
- Growth Forecasts: 5.6%
Key Regional Dynamics:
- Largest Region: North America (Majority Revenue Share by 2035)
- Fastest Growing Region: Asia Pacific
- Dominating Countries: United States, China, Germany, Japan, United Kingdom
- Emerging Countries: India, South Korea, Brazil, Indonesia, Mexico
Last updated on : 21 November, 2025
Organic Dispersants Market - Growth Drivers and Challenges
Growth Drivers
-
Extensive Use in Automotive Industry – Dispersants are added to lubricating oils in engines to prevent the buildup of sludge and varnish on cylinder walls, keeping them clean. This demand is anticipated to improve the organic dispersants’ market share. For instance, China’s domestic production of vehicles is expected to reach around 35 million by the year 2025. In 2020, it sold over 25 million vehicles.
- Treatment of Oil Spills - In an oil spill, dispersants break down petroleum into smaller droplets and help to clear the oil from the water's surface. As per the International Tanker Owners Pollution Federation (ITOPF), approximately 10,000 tons of oil were spilled in 2021, far more than in 2020.
- Increasing Use in Paper Industry - The growing demand for good quality, cost-effective paper in developing countries such as China and India are predicted to drive the market for organic dispersants. As per the latest studies, India alone manufactures more than 12 million tons of paper, contributing to around 3% share of the world’s paper production.
- Rising Use in Agriculture- Organic dispersants increase the efficiency of biocides and pesticides used in agriculture. According to the Food and Agriculture Organization of the United Nations, around 4.2 million tons of pesticides were used worldwide in the year 2019.
Challenges
-
Fluctuation in the Prices of Raw Materials –Starting from unexpectedly high energy prices to fluctuations in the prices of raw materials make it is tough for manufacturers to offer a quality product at a low price. As the prices of raw materials fluctuate it becomes a task for manufacturers to offer the product at a reasonable cost, they would also need to keep their margin and it might not be possible for the customer also to spend a high amount of money.
-
Stringent Government Regulations Imposed in Some Developed Countries
-
Slower Pace of Innovation in Developing Countries
Organic Dispersants Market Size and Forecast:
| Report Attribute | Details |
|---|---|
|
Base Year |
2025 |
|
Forecast Year |
2026-2035 |
|
CAGR |
5.6% |
|
Base Year Market Size (2025) |
USD 6.09 billion |
|
Forecast Year Market Size (2035) |
USD 10.5 billion |
|
Regional Scope |
|
Organic Dispersants Market Segmentation:
End-user Segment Analysis
The global organic dispersants market is segmented and analyzed for demand and supply based on end-users into construction, automotive, paper, oil & gas, agriculture, pharmaceutical, and others. Amongst this automotive industry is anticipated to witness the highest market share in the forecast period. This can be attributed to organic dispersant being used to stabilize the paint and coating along with this it reduces the viscosity on the surface of the automobile. Additionally, the organic dispersant is also used as lubricating oil added to the engine which keeps it clean and prevents the buildup of sludge. As per the International Organization of Motor Vehicles Manufacturers (OICA), global vehicle production increased by 22 million in January-March 2021 as compared to 19 million in January-March 2020.
Product Type Segment Analysis
The global organic dispersants market is segmented and analyzed for demand and supply based on product type into oligomer and polymer organic dispersants. Out of these, the oligomer sub-segment is projected to grow at a significant mark during the forecast period. This can be attributed owing to its utility in many industries, such as the cosmetics and pharmaceutical industries.
Our in-depth analysis of the global market includes the following segments:
|
Product Type |
|
|
Application |
|
|
End-User |
|

Vishnu Nair
Head - Global Business DevelopmentCustomize this report to your requirements — connect with our consultant for personalized insights and options.
Organic Dispersants Market - Regional Analysis
APAC Market Insights
North America industry is predicted to dominate majority revenue share by 2035. This can be attributed on the back of the growing demand for energy and automobiles in the region. The developing infrastructure owing to rapid urbanization and industrialization is expected to multiply the market share in the region. Around 31% of global construction companies are based in the APAC region. Additionally, rapid growth in the demand for automobiles in the Asia Pacific region is expected to drive the market in the forecast period. This is attributed to the fact that organic dispersant is widely used for painting and coating purposes in automobiles.
North American Market Insights
Furthermore, the market in the North American region is anticipated to garner a significant share over the forecast period. This can be attributed owing to the growing investment in oil drilling activities. The organic dispersant lowers the ability to absorb oil from the ocean surface. It is sprayed on the surface to increase the range of sticky oil and break down it into small particles. As per the Canadian Association of Petroleum Producers, investment in oil sand projects and oil & gas production grew from USD 19 billion in 2019 to USD 21 billion in 2021.
Furthermore, the EPA's strict environmental regulations regarding the wetting agents used in the paint and coatings industry, along with a growing focus on energy efficiency in the construction industry, are expected to contribute to Europe's moderate growth over the forecast period.
Organic Dispersants Market Players:
- Clariant Ltd.
- Company Overview
- Business Strategy
- Key Product Offerings
- Financial Performance
- Key Performance Indicators
- Risk Analysis
- Recent Development
- Regional Presence
- SWOT Analysis
- Harmony Additive Pvt. Ltd.
- Ferro Corporation
- BASF SE
- Arkema Group
- Ashland Inc.
- Evonik Industries AG
- The Lubrizol Corporation
- Dow Chemical Company
- DCL Corporation
Recent Developments
- Clariant Ltd. has launched its new product Dispersogen Flex 100 which is the only choice for superior and sustainable pigment preparation. Waterborne pigment preparation with Dispersogen Flex 100 can be compatible with solvent-borne base paint systems.
- BASF SE has recently launched a new high molecular weight dispersing agent: Dispex Ultra PX 4290, which features excellent performance in pigment stabilization, outstanding color strength, and brilliant viscosity reduction. It offers the benefit of higher pigment loading while maintaining exceptional flow characteristics.
- Report ID: 4196
- Published Date: Nov 21, 2025
- Report Format: PDF, PPT
- Explore a preview of key market trends and insights
- Review sample data tables and segment breakdowns
- Experience the quality of our visual data representations
- Evaluate our report structure and research methodology
- Get a glimpse of competitive landscape analysis
- Understand how regional forecasts are presented
- Assess the depth of company profiling and benchmarking
- Preview how actionable insights can support your strategy
Explore real data and analysis
Frequently Asked Questions (FAQ)
Organic Dispersants Market Report Scope
Free Sample includes current and historical market size, growth trends, regional charts & tables, company profiles, segment-wise forecasts, and more.
Connect with our Expert


Copyright @ 2026 Research Nester. All Rights Reserved.
