Energy Recovery Ventilator Market Outlook:
Energy Recovery Ventilator Market size was valued at USD 4.36 billion in 2025 and is likely to cross USD 12.6 billion by 2035, expanding at more than 11.2% CAGR during the forecast period i.e., between 2026-2035. In the year 2026, the industry size of energy recovery ventilator is assessed at USD 4.8 billion.
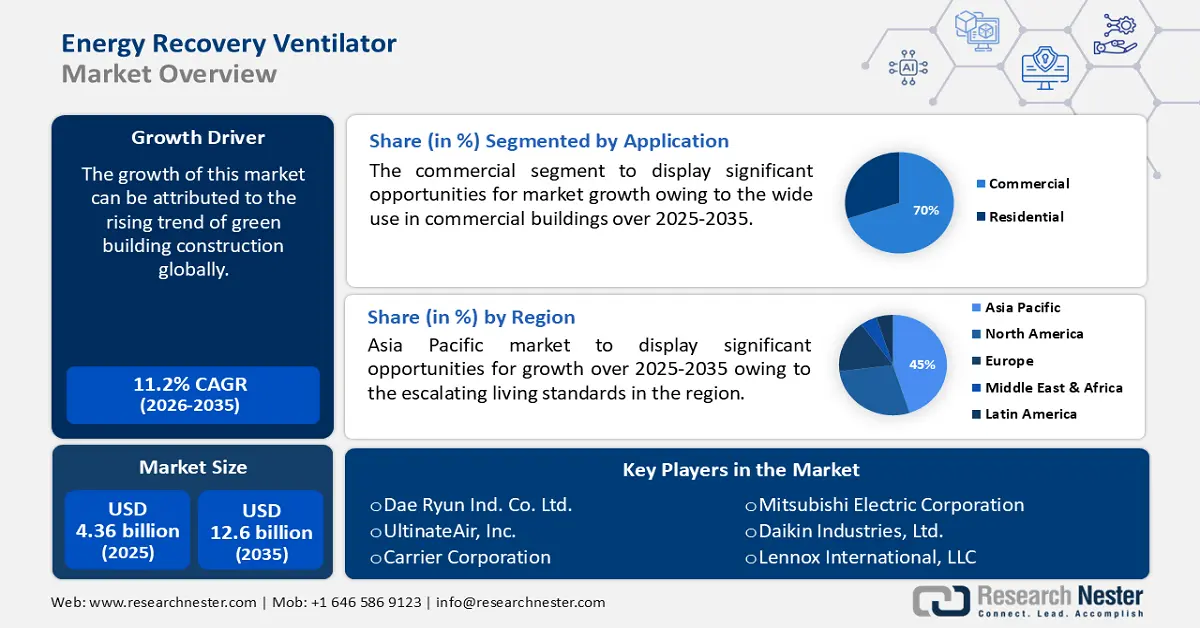
The growth of this market can be attributed to the rising trend of green building construction globally. The trend of constructing green buildings is rising owing to environmental conditions, strict government regulations, standards of energy consumption, and a rise in hazardous emissions. The building manufacturers now are focusing on constructing green buildings in order to get more profit from the income generated from the property business. Therefore, with the rise in the deployment of ventilators the market of energy ventilators is expected to grow more in the upcoming years. Anyhow, the key suppliers align their products in line with green building certifications, Thus, the rise in the construction of the green building is expected to drive the industry growth. The green building consumes 40-50% less energy and 10-20% less water.
On the other hand, the maintenance of air quality has become a major concern nowadays. Deficient indoor air quality poses an adverse impact on the health, productivity, cognitive function, and well-being of people. The ability of energy recovery ventilator to replace stale indoor air with fresh outdoor air, its ability to remove all the pollutant particles from the environment, optimize energy efficiently, minimizes carbon footprints and others are factors driving the growth of this market in the forecast period. In 2020, globally around 3.2 million people died out of bad indoor air quality.
Key Energy Recovery Ventilator Market Insights Summary:
Regional Highlights:
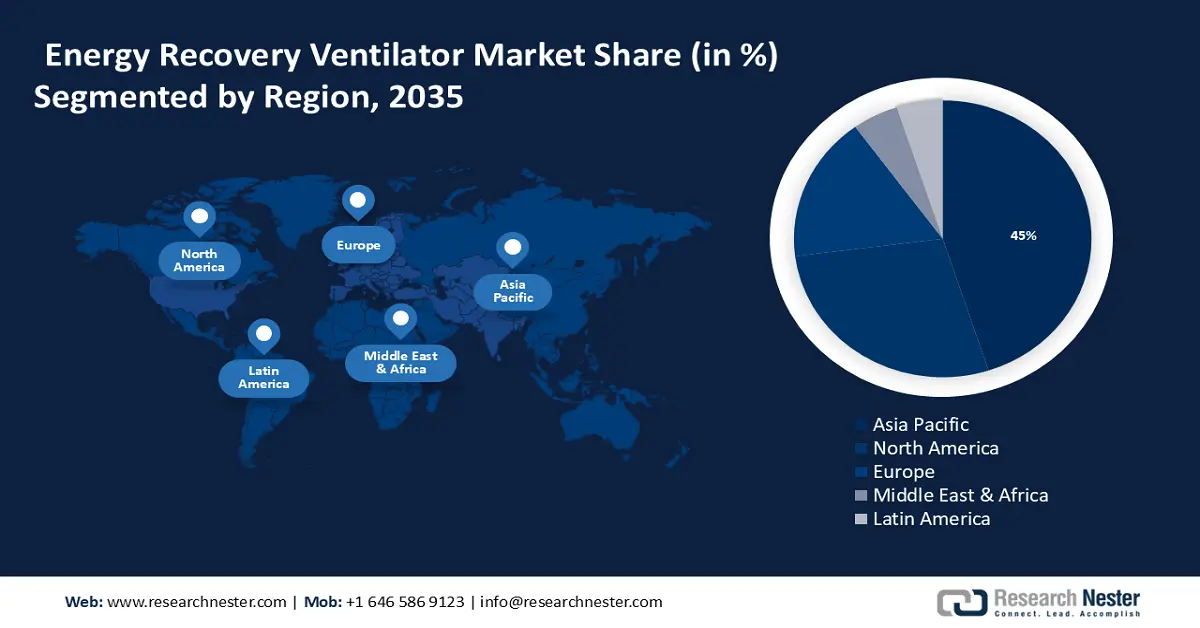
- The Asia Pacific energy recovery ventilator market is poised to capture 45% share by 2035, attributed to rising living standards and robust real estate sector.
- The North America market enjoys a lucrative share by 2035, driven by harsh climatic conditions and growing energy needs.
Segment Insights:
- The commercial segment in the energy recovery ventilator market is anticipated to secure a substantial share by 2035, attributed to energy efficiency initiatives in green commercial buildings.
- The ceiling-mount segment in the energy recovery ventilator market is poised for remarkable share by 2035, driven by reduced installation costs and efficient use of indoor space.
Key Growth Trends:
- Increasing Construction of Green Buildings Around the World
- Growing Consciousness for Indoor Air Quality
Major Challenges:
- Complex Installation Mechanism
- Noise and Discomfort
Key Players: Panasonic Corporation, Mitsubishi Electric Corporation, Daikin Industries, Ltd., Lennox International, LLC, Nortek Air Solutions, LLC, Dae Ryun Ind. Co. Ltd., UltinateAir, Inc., Carrier Corporation, General Electric Company, LG Electronics.
Global Energy Recovery Ventilator Market Forecast and Regional Outlook:
Market Size & Growth Projections:
- 2025 Market Size: USD 4.36 billion
- 2026 Market Size: USD 4.8 billion
- Projected Market Size: USD 12.6 billion by 2035
- Growth Forecasts: 11.2% CAGR (2026-2035)
Key Regional Dynamics:
- Largest Region: Asia Pacific (45% Share by 2035)
- Fastest Growing Region: Asia Pacific
- Dominating Countries: United States, Japan, Germany, China, South Korea
- Emerging Countries: China, India, Japan, South Korea, Indonesia
Last updated on : 9 September, 2025
Energy Recovery Ventilator Market Growth Drivers and Challenges:
Growth Drivers
- Increasing Construction of Green Buildings Around the World – The growing construction of green buildings all over the world is boosting the market growth in the upcoming times. This can be attributed owing to rising hazardous emissions, growing awareness about green buildings among the people, and standards of energy consumption. As per the U.S. Green Building Council, green and healthier buildings streamlined with promotive ventilation can grow to return on investment by 19% and building asset value by 10%.
- Growing Consciousness for Indoor Air Quality – Nowadays, maintenance of indoor air quality has become one of the most significant concerns. An energy recovery ventilator has the ability to replace bad indoor air with fresh outdoor air. Additionally, it also removes all pollutant particles such as viruses, bacteria, and household chemicals from the environment, minimizes carbon footprints, optimizes energy efficiency, and others. Globally around 4.1% of death takes place owing to bad indoor air quality.
- Government Regulations - Several governments around the world have introduced regulations and standards to improve the energy efficiency of buildings and reduce greenhouse gas emissions. For instance, the European Union's Building Energy Performance Directive requires all new buildings to be near-zero energy buildings by 2020. Energy recovery fans help buildings comply with these regulations and standards.
- Growing Demand in New Commercial and Residential Projects – Rising demand for new commercial and residential projects in turn is giving rise to the energy recovery ventilator market owing to indoor air quality purposes. The U.S. Environmental Protection Agency (EPA) has identified indoor air pollution as a major environmental problem because indoor air can be up to five times more polluted than outdoor air. To address this issue, the EPA recommends using ventilation systems to improve indoor air quality in commercial and residential projects.
Challenges
- Complex Installation Mechanism – The demand for energy recovery ventilators seems to have risen with the concern of indoor air quality. However, its complex installation procedure might hamper the market growth in the forecast period. Also, the task becomes a bit challenging to install energy recovery ventilators in the old design houses.
- Noise and Discomfort
- High Maintenance Cost of Energy Recovery Ventilator
Energy Recovery Ventilator Market Size and Forecast:
| Report Attribute | Details |
|---|---|
|
Base Year |
2025 |
|
Forecast Period |
2026-2035 |
|
CAGR |
11.2% |
|
Base Year Market Size (2025) |
USD 4.36 billion |
|
Forecast Year Market Size (2035) |
USD 12.6 billion |
|
Regional Scope |
|
Energy Recovery Ventilator Market Segmentation:
Application Segment Analysis
In energy recovery ventilator market, commercial segment is poised to capture substantial share by the end of 2035. Energy recovery ventilators are widely used in commercial buildings such as hospitals, schools, offices, restaurants, commercial kitchens, and other commercial areas. Also, there are more and more "green" buildings, and various government laws to reduce energy use in buildings are being created and strictly enforced. Moreover, the market is expanding owing to the increased demand for these devices globally. For instance, 17.2% of green building in the United States belongs to the commercial department.
Type Segment Analysis
In energy recovery ventilator market, Ceiling mount segment is expected to capture remarkable share by the end of 2035, owing to their wiring and ducting over the walls and to reduce the installation cost and invasiveness. The ceiling mount type energy recovery ventilator is high in demand for commercial and residential areas as it lowers the consumption of central spaces and creates afresh indoor air quality.
Our in-depth analysis of the global market includes the following segments:
|
By Technology Type
|
|
|
By Application |
|
|
By Type |
|

Vishnu Nair
Head - Global Business DevelopmentCustomize this report to your requirements — connect with our consultant for personalized insights and options.
Energy Recovery Ventilator Market Regional Analysis:
APAC Market Insights
Asia Pacific region is estimated to account for significant share by 2035, on the back of the escalating living standards in countries namely China, India, and South Korea, and the increasing modernization of residential and commercial building stocks. In addition, robust growth of the real estate sector is also projected to boost market growth. According to the International Finance Corporation, East and Pacific Asia accounts for the most significant share of the real estate industry as of now. The rising demand for energy recovery ventilators, the growing population, and the rising disposable income are some of the major factors fueling the market’s expansion. Also, the growth in the area would have an even greater impact on people’s rising living standards. The upgrading of homes and businesses in developing nations will support the region’s substantial market expansion.
North American Market Insights
North America region is anticipated to hold lucrative share by 2035, due to rise in residential fixed investments and intensifying need for installing energy recovery ventilators resulting from the presence of harsh climatic conditions in the region. Residential and commercial buildings in North American regions consume large amounts of energy for heating and cooling purposes. The United States and Canada have cooler climates as compared to other parts of the world. Thus, there is a need for equipment that can heat and humidify the climate in this region. Also, there are significant government investments to boost the economy through federal tax credit initiatives, growing concerns about greenhouse gas emissions, and extremely positive economic development in the United States.
Europe Market Insights
The Europe region is anticipated to account for a significant market share by the end of 2035, driven by factors such as increasing awareness of the importance of indoor air quality and energy efficiency, and government efforts to promote sustainable building practices. Increased demand for energy-efficient HVAC systems in residential and commercial buildings is expected to drive market growth. Moreover, technological advancements and the development of intelligent ventilation systems are expected to drive growth.
Energy Recovery Ventilator Market Players:
- Panasonic Corporation
- Company Overview
- Business Strategy
- Key Product Offerings
- Financial Performance
- Key Performance Indicators
- Risk Analysis
- Recent Development
- Regional Presence
- SWOT Analysis
- Mitsubishi Electric Corporation
- Daikin Industries, Ltd.
- Lennox International, LLC
- Nortek Air Solutions, LLC
- Dae Ryun Ind. Co. Ltd.
- UltinateAir, Inc.
- Carrier Corporation
- General Electric Company
- LG Electronics
Recent Developments
- The Intelli-Balance 100 Mirror Energy Recovery Ventilator from Panasonic Corporation will be unveiled at the 2023 International Builders' Exhibition. The new design is the business's most recent addition to its line of ERVs, which balances air pressure at homes, buildings and enhances indoor air quality. The Mirror ERV is the best option for confined spaces where duplicate floorplans call for ventilation on each side of a structure and is ideal for large, multi-family projects.
- Mitsubishi Electric Trane HVAC US introduces Lossnay RVX2, the next generation of Lossnay Energy Recovery Ventilator (ERV) units helping building owners, engineers, and architects meet ventilation requirements and improve indoor air quality.
- Report ID: 3598
- Published Date: Sep 09, 2025
- Report Format: PDF, PPT
- Explore a preview of key market trends and insights
- Review sample data tables and segment breakdowns
- Experience the quality of our visual data representations
- Evaluate our report structure and research methodology
- Get a glimpse of competitive landscape analysis
- Understand how regional forecasts are presented
- Assess the depth of company profiling and benchmarking
- Preview how actionable insights can support your strategy
Explore real data and analysis
Frequently Asked Questions (FAQ)
About this Report
Connect with our Expert

Report, 2026-2035


Copyright @ 2026 Research Nester. All Rights Reserved.
