Natural Surfactants Market Outlook:
Natural Surfactants Market size was valued at USD 21.7 billion in 2025 and is projected to reach USD 31.2 billion by the end of 2035, rising at a CAGR of 4.3% during the forecast period, i.e., 2026-2035. In 2026, the industry size of natural surfactants is assessed at USD 22.5 billion.
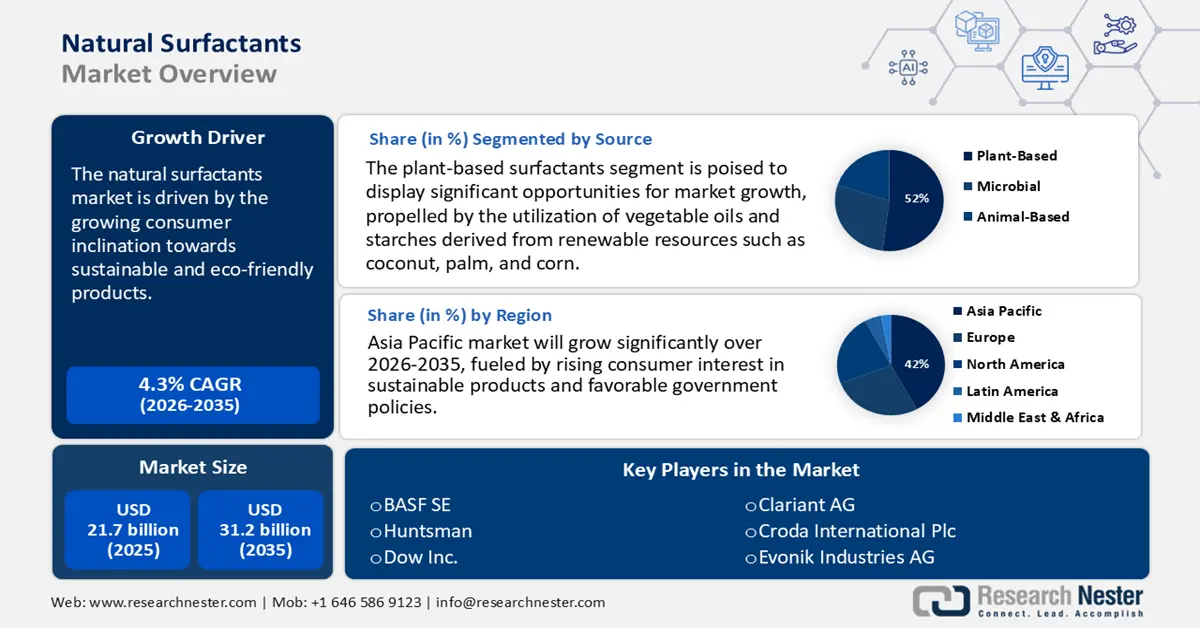
The market for natural surfactants is primarily driven by the growing consumer inclination towards sustainable and eco-friendly products. Most consumers are prepared to spend more on sustainable brands, which motivates manufacturers to utilize biodegradable and low-toxicity surfactants derived from renewable resources such as plant oils and sugars. Furthermore, stringent government regulations, including the EU’s REACH guidelines, compel companies to seek safer chemical alternatives, thereby enhancing the global adoption of natural surfactants.
The supply chain for natural surfactants is significantly dependent on raw materials such as coconut, palm, and vegetable oils. The processes involved in their extraction and processing are intricate and expensive, necessitating specialized equipment. When applied at a concentration of 0.2 weight percent, saponins derived from plants have been shown to decrease the interfacial tension between the water and oil phases by up to 93.2% at high temperatures and up to 76% at normal temperatures. Other natural surfactants, such as sophorolipids and rhamnolipids, have also demonstrated encouraging outcomes in lowering the percentage of interfacial tension. Moreover, the restricted availability of raw materials and the competition posed by the food and biofuel industries contribute to supply uncertainties, complicating consistent production and limiting broader acceptance in sectors driven by cost considerations.
Key Natural Surfactants Market Insights Summary:
Regional Insights:
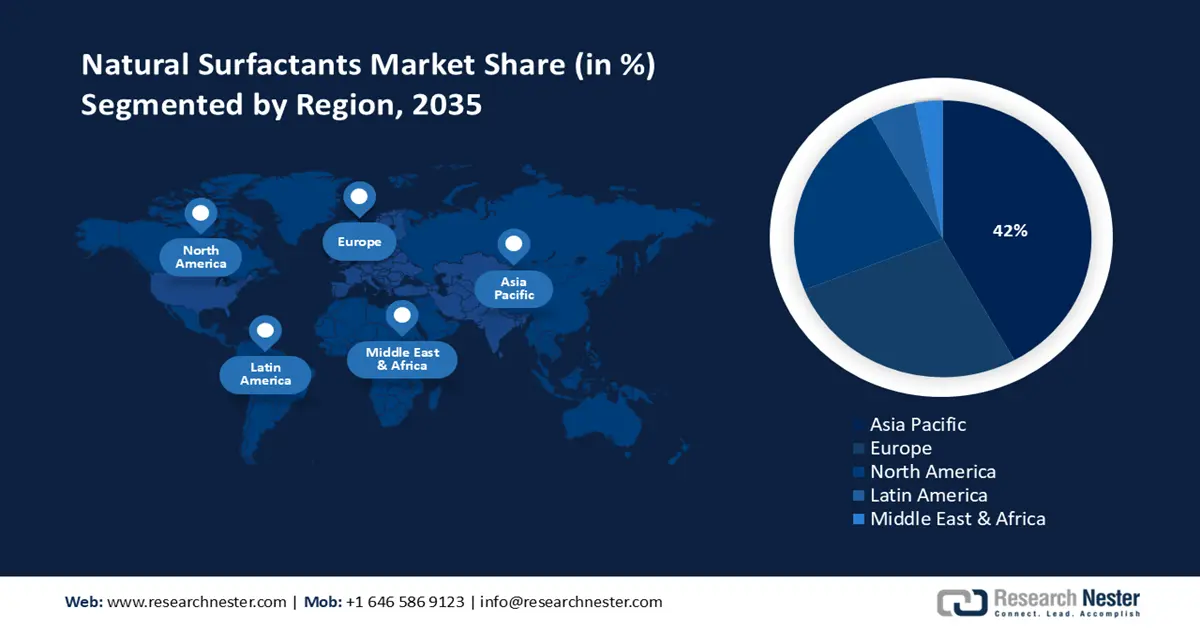
- By 2035, Asia-Pacific is projected to command a 42% share of the Natural Surfactants Market, spurred by expanding consumer preference for sustainable products and supportive government policies.
- Europe is anticipated to secure a 27% market share by 2035, underpinned by stringent environmental regulations, the European Green Deal’s sustainability agenda, and growing demand for bio-based chemicals.
Segment Insights:
- The plant-based surfactants segment is poised to capture a 52% share by 2035 in the Natural Surfactants Market, propelled by the increasing use of renewable vegetable oils and starches.
- The personal care and cosmetics segment is projected to hold a 47% share by 2035, supported by escalating consumer demand for natural formulations and stricter regulatory guidelines promoting safer ingredients.
Key Growth Trends:
- Advancements in green chemistry
- Consumer demand for sustainable products
Major Challenges:
- Complex pricing models and cost competitiveness
- Market access barriers and trade policies
Key Players: BASF SE,Dow Chemical Company,Clariant AG,Evonik Industries AG,Kao Corporation,Croda International Plc,Huntsman Corporation,Solvay S.A.,Galaxy Surfactants Ltd.,Mitsubishi Chemical Holdings,Wilmar International,LG Chem,Oleon NV,KLK Oleo
Global Natural Surfactants Market Forecast and Regional Outlook:
Market Size & Growth Projections:
- 2025 Market Size: USD 21.7 billion
- 2026 Market Size: USD 22.5 billion.
- Projected Market Size: USD 31.2 billion by 2035
- Growth Forecasts: 4.3% CAGR (2026-2035)
Key Regional Dynamics:
- Largest Region: Asia-Pacific (42% Share by 2035)
- Fastest Growing Region: North America
- Dominating Countries: United States, China, Germany, Japan, United Kingdom
- Emerging Countries: India, South Korea, Brazil, Indonesia, Mexico
Last updated on : 9 September, 2025
Natural Surfactants Market - Growth Drivers and Challenges
Growth Drivers
- Advancements in green chemistry: Advancements in green chemistry are fundamentally accelerating the market by developing more efficient, eco-friendly synthesis pathways that utilize renewable feedstocks like plant oils and sugars. These innovations reduce energy consumption, waste generation, and reliance on petroleum-based raw materials, making natural surfactants more cost-competitive and scalable. Furthermore, green chemistry principles enhance the biodegradability and non-toxicity of these surfactants, aligning with stringent international regulations and growing consumer demand for sustainable products. As industries such as personal care, agriculture, and cleaning increasingly prioritize environmental responsibility, the adoption of bio-based surfactants continues to rise. This technical and ecological synergy positions green chemistry as a critical enabler for market expansion and innovation in renewable surfactant solutions.
- Consumer demand for sustainable products: Rising consumer demand for sustainable products is a powerful force driving the market, as increasingly environmentally conscious buyers seek transparency, biodegradability, and plant-based ingredients in everything from household cleaners to personal care items. This shift in purchasing behavior pressures brands to reformulate products, replacing synthetic, petroleum-based surfactants with eco-friendly alternatives derived from renewable sources like coconut, palm kernel, or corn. In response, manufacturers are investing in and scaling production of natural surfactants to meet certifications such as "EU Ecolabel" or "USDA BioPreferred," which serve as key marketing tools. Furthermore, social media and digital awareness have accelerated this trend, making sustainability a competitive advantage and market expectation. As a result, what began as a niche preference has evolved into a major market driver, spurring innovation, expanding supply chains, and solidifying the commercial viability of natural surfactants globally.
- Rising demand in agriculture and food processing: In agriculture, natural surfactants serve as adjuvants in pesticides, herbicides, and foliar sprays to enhance solubility and ensure efficacy while reducing chemical residues. The U.S. vegetable oil imports were above $8.0 billion until they crossed $10.9 billion in 2022. Much of the growth in demand in 2022 was due to increased use of biodiesel and renewable diesel, both of which are transportation fuels produced from agricultural feedstocks, including vegetable oils. Production of biofuels increased to 3.1 billion gallons in 2022. In this context, increasing government programs favoring sustainable agriculture and food safety enable further adoption of natural surfactants in these sectors and good secular growth opportunities.
- Palm Oil Production
Palm oil production plays a pivotal role in driving the market, as it serves as a key renewable and cost-effective feedstock for deriving bio-based surfactant raw materials such as fatty alcohols and methyl esters. The scalability and efficiency of palm cultivation ensure a steady supply chain, enabling mass production of environmentally compliant surfactants used in detergents, personal care, and industrial cleaners. However, this growth is increasingly shaped by sustainability certifications and regulatory pressures aimed at minimizing deforestation and promoting responsible sourcing. As a result, palm oil continues to underpin the economic and material foundation of the natural surfactants industry, while simultaneously pushing it toward greater ecological accountability.
Palm Oil Production 2024-2025
|
Country |
% of Global Production |
Total Production (Metric Tons) |
|
Indonesia |
58% |
46,000,000 |
|
Malaysia |
25% |
19,400,000 |
|
Thailand |
4% |
3,330,000 |
|
Colombia |
2% |
1,900,000 |
|
Nigeria |
2% |
1,500,000 |
|
Guatemala |
1% |
990,000 |
|
Papua New Guinea |
1% |
830,000 |
|
Brazil |
0.76% |
600,000 |
|
Côte d'Ivoire |
0.76% |
600,000 |
|
Honduras |
0.75% |
595,000 |
Source: USDA
2. Expansion of Natural Surfactants in the Personal Care and Cosmetics Industry
The personal care sector increasingly adopts natural surfactants in soaps and organic surface-active products, driven by demand for clean-label, vegan, and skin-friendly formulations, fueling rapid growth in sustainable ingredient consumption.
Exporting Countries for Soap and Organic Surface-Active Products in Bar (2023)
|
Country/Region |
Export Value ( 1000 USD ) |
Quantity Exported (Kg) |
|
China |
831,692.99 |
498,162,000 |
|
European Union |
115,528.28 |
40,892,400 |
|
Poland |
103,996.11 |
46,930,600 |
|
Turkey |
93,635.37 |
66,523,500 |
|
Honduras |
93,528.09 |
60,029,000 |
|
Mexico |
87,075.30 |
39,675,300 |
|
Cameroon |
85,717.90 |
66,591,000 |
|
Italy |
83,745.91 |
30,235,700 |
|
Germany |
83,548.04 |
24,573,000 |
Source: WITS
Challenges
-
Complex pricing models and cost competitiveness: Natural surfactants frequently encounter pricing challenges when compared to synthetic options, primarily because of elevated raw material and processing expenses. According to WTO data from 2022, the lack of price competitiveness continues to hinder progress in emerging markets, where natural surfactants are typically priced higher on average, which in turn impedes their adoption.
- Market access barriers and trade policies: Tariffs and non-tariff barriers impede the seamless flow of trade. For instance, the implementation of new import tariffs on bio-based chemicals in China postponed the launch of certain natural surfactant products by six months in 2022. This situation obstructs global supply chains and affects adoption rates.
Natural Surfactants Market Size and Forecast:
| Report Attribute | Details |
|---|---|
|
Base Year |
2025 |
|
Forecast Year |
2026-2035 |
|
CAGR |
4.3% |
|
Base Year Market Size (2025) |
USD 21.7 billion |
|
Forecast Year Market Size (2035) |
USD 31.2 billion |
|
Regional Scope |
|
Natural Surfactants Market Segmentation:
Source Segment Analysis
The plant-based surfactants are anticipated to hold a 52% share in the global market in 2035, which is mainly propelled by the utilization of vegetable oils and starches derived from renewable resources such as coconut, palm, and corn. These surfactants are biodegradable, non-toxic, and environmentally sustainable, rendering them highly favored in the personal care, cosmetics, and home care sectors. The increasing consumer demand for eco-friendly products, along with regulatory backing for sustainable chemicals, is further hastening their adoption, thereby establishing plant-based surfactants as a crucial factor in the long-term growth and innovation of the market.
Application Segment Analysis
The personal care and cosmetics segment is expected to hold a 47% share in the global market in 2035. The growing consumer inclination towards natural and organic personal care items drives the demand for natural surfactants within this sector. As reported by the U.S. National Institutes of Health (NIH), natural components minimize skin irritation and lessen environmental effects, thereby promoting their wider acceptance. Additionally, regulations imposed by the European Chemicals Agency (ECHA) limit the use of harmful substances in cosmetics, thereby encouraging the utilization of natural surfactants.
Product Type Segment Analysis
The alkyl polyglucosides segment is expected to hold a 35% share by 2035, due to their significant biodegradability, low irritability, and compatibility with skin and environmental standards. They are used in household cleaning, personal care, and industrial applications, and have the most significant market presence due to the growing need for eco-friendly and safe formulations. Their continued, strong growth has been bolstered by ongoing adoption in Europe and North America. In addition, cost-effectiveness and performance efficiency will continue to strengthen their leading position relative to sophorolipids, rhamnolipids, saponins, and other categories of natural surfactants.
Our in-depth analysis of the global market includes the following segments:
| Segment | Subsegment |
|
Source |
|
|
Application |
|
|
Product Type |
|
|
Form |
|

Vishnu Nair
Head - Global Business DevelopmentCustomize this report to your requirements — connect with our consultant for personalized insights and options.
Natural Surfactants Market - Regional Analysis
Asia Pacific Market Insights
Asia-Pacific is anticipated to capture a 42% share of the global market by 2035, fueled by rising consumer interest in sustainable products and favorable government policies. Countries like China and India are making significant investments in clean technologies and initiatives related to green chemistry. This movement is further enhanced by the increasing use of plant-based surfactants across personal care, household, and industrial sectors.
By the year 2035, Indonesia's capacity to produce biodiesel and oleochemicals has expanded significantly over the last ten years. In 2025, the country's biodiesel production capacity is expected to increase by 1.5 billion liters over its current capacity of 19.7 billion liters. According to Indonesia's biodiesel producers’ association, Indonesia will require an additional 4 billion liters of production capacity to be able to meet Indonesia's next blending mandate target of B50. As for the oleochemical industry, some new oleochemical plants, that together have a capacity of 900,000 MT, are expected to come online this year in East Java, North Sumatra, and Batam.
Europe Market Insights
By the year 2035, it is expected that Europe will contribute 27% to the global revenue generated from the natural surfactants market. This growth is primarily fueled by rigorous environmental regulations, the emphasis on sustainability outlined in the European Green Deal, and a rising demand for bio-based chemicals in sectors such as cosmetics, personal care, and industrial applications. Additionally, investments in green technologies and initiatives aimed at promoting a circular economy are further propelling market growth. The area benefits from strong policy support, encompassing financial assistance from the European Chemicals Agency (ECHA) and the European Chemical Industry Council (CEFIC), both of which encourage innovation and advocate for safer chemical manufacturing.
In the U.K., the natural surfactants market is expanding, driven by rising demand for eco-friendly and sustainable products. Crude palm oil remains a key raw material, widely used in the production of surfactants such as fatty acid esters and alkyl polyglucosides. Increasing imports of palm oil support domestic manufacturing, while government initiatives encourage renewable, low-impact surfactant production.
Crude Palm Oil Exports in 2023
|
Region / Country |
Export Value (USD thousands) |
Quantity (Kg) |
|
United Kingdom |
1,248.79 |
847,393 |
|
Germany |
2,455.80 |
858,647 |
|
France |
1,136.55 |
957,108 |
|
Italy |
4,764.71 |
2,211,420 |
|
Spain |
7,455.03 |
4,267,360 |
Source: WITS
North America Market Insights
By the year 2035, it is expected that North America will contribute 23% to the global revenue generated from the natural surfactants market. The market is primarily driven by increasing consumer demand for eco-friendly and sustainable products, particularly in the personal care and household cleaning sectors. Synthetic surfactants currently dominate the market, but biobased surfactants are experiencing the fastest growth due to their renewable nature and biodegradability.
The natural surfactants market in the U.S. is expected to grow due to a growing consumer preference for natural ingredients in personal care and household products, as well as stricter regulations promoting biodegradable surfactants. Biofuel production increased to 3.1 billion gallons in 2022, which has subsequently raised demand for vegetable oil. The majority of USA imports are food imports, including canola ($3.6B, 96% from Canada), palm ($2.2B, 82% from Indonesia), and olive oil ($1.7B, 78% from the EU).
Key Natural Surfactants Market Players:
- BASF SE
- Company Overview
- Business Strategy
- Key Product Offerings
- Financial Performance
- Key Performance Indicators
- Risk Analysis
- Recent Development
- Regional Presence
- SWOT Analysis
- Dow Chemical Company
- Clariant AG
- Evonik Industries AG
- Kao Corporation
- Croda International Plc
- Huntsman Corporation
- Solvay S.A.
- Galaxy Surfactants Ltd.
- Mitsubishi Chemical Holdings
- Wilmar International
- LG Chem
- Oleon NV
- KLK Oleo
The market for natural surfactants is intensely competitive, primarily led by multinational chemical corporations from Europe, North America, and Asia. Major participants concentrate on strategic efforts, including sustainable sourcing, increasing production capacity, and making substantial investments in research and development to create biodegradable and environmentally friendly surfactants. Partnerships and acquisitions are intended to enhance regional presence and address the rising regulatory and consumer demands for green products. This table ranks the top 15 global natural surfactant chemical manufacturers by 2022 sales and profits. It highlights regional distribution, financial performance, and key strategic trends shaping market leadership
Some of the key players operating in the market are listed below:
Recent Developments
- In March 2024, Croda International introduced a surfactant derived from natural sources that offers enhanced biodegradability and gentleness on the skin, targeting the cosmetics and detergents sectors. Within six months of its introduction, the product was incorporated into more than 200 formulations, resulting in a 13% year-over-year growth for Croda’s personal care division.
- In January 2024, BASF introduced Glucopon 426 N, a biodegradable non-ionic surfactant specifically designed for personal care and household applications. This introduction has resulted in a 16% growth in BASF’s market share of natural surfactants in Q2 2024, fueled by the increasing demand for environmentally friendly formulations in Europe and North America.
- Report ID: 2610
- Published Date: Sep 09, 2025
- Report Format: PDF, PPT
- Explore a preview of key market trends and insights
- Review sample data tables and segment breakdowns
- Experience the quality of our visual data representations
- Evaluate our report structure and research methodology
- Get a glimpse of competitive landscape analysis
- Understand how regional forecasts are presented
- Assess the depth of company profiling and benchmarking
- Preview how actionable insights can support your strategy
Explore real data and analysis
Frequently Asked Questions (FAQ)
Natural Surfactants Market Report Scope
Free Sample includes current and historical market size, growth trends, regional charts & tables, company profiles, segment-wise forecasts, and more.
Connect with our Expert


Copyright @ 2026 Research Nester. All Rights Reserved.
