Methanol Market Outlook:
Methanol Market size was valued at USD 35.9 billion in 2025 and is expected to reach USD 53.3 billion by the end of 2035, registering a CAGR of 4.5% during the forecast period, i.e., 2026-2035. In 2026, the industry size of methanol is evaluated at USD 37.5 billion.
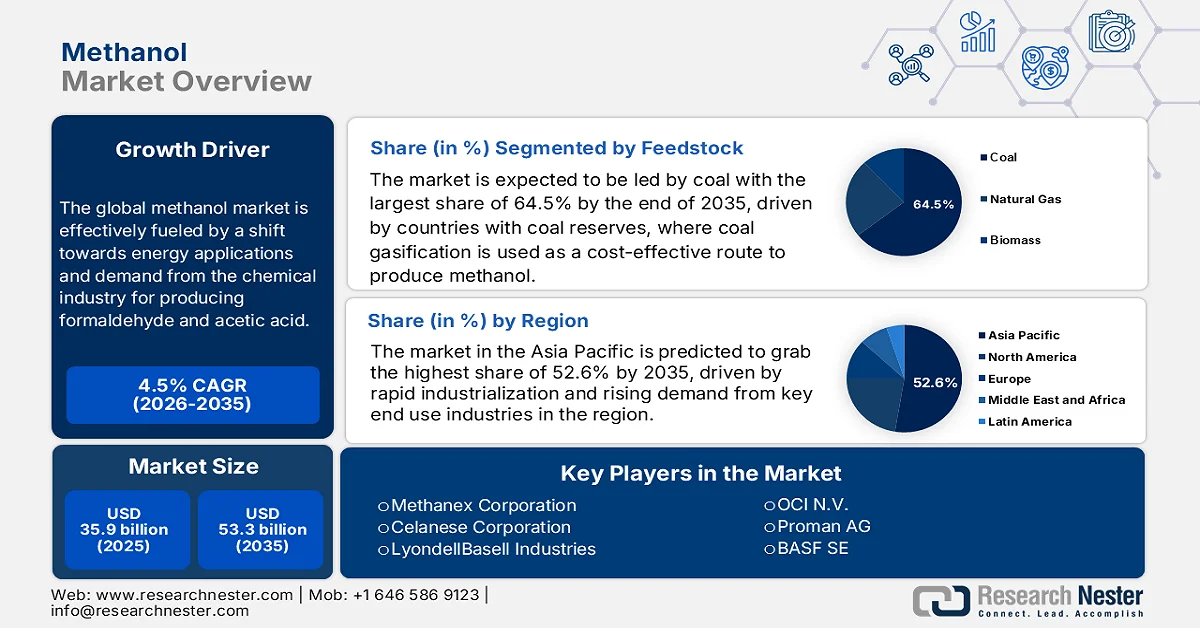
The global methanol market is undergoing significant transformations, mainly driven by a major shift towards energy applications as well as sustainable production pathways. Also, the demand arises from the chemical industry for producing formaldehyde and acetic acid, which remains a foundational pillar, supporting extensive use in construction and automotive sectors for resins, adhesives, and coatings. As per the article published by World Integrated Trade Solution (WITS) in 2023, methanol export activity remained concentrated among a small group of energy- and petrochemical-integrated economies, wherein Trinidad and Tobago led the global exports at USD 1.5 billion, Saudi Arabia at USD 1.2 billion, and the U.S. at USD 923 million. This trade concentration indicates that export activity is closely aligned with upstream hydrocarbon availability as well as large-scale processing infrastructure.
Global Methanol Exports 2023: Top Exporting Countries by Trade Value and Volume
|
Country |
Export Value (USD ‘000) |
Quantity (Kg) |
|
Trinidad and Tobago |
1,545,105.09 |
- |
|
Saudi Arabia |
1,229,753.95 |
- |
|
U.S. |
923,385.34 |
3,533,820,000 |
|
Netherlands |
691,937.36 |
1,888,850,000 |
|
Oman |
515,508.77 |
1,052,070,000 |
|
Malaysia |
434,114.29 |
1,557,110,000 |
|
Chile |
320,054.92 |
882,700,000 |
|
Egypt, Arab Rep. |
212,736.47 |
- |
|
Belgium |
195,046.08 |
557,970,000 |
|
Brunei |
160,068.55 |
621,529,000 |
|
Bahrain |
155,610.56 |
317,575,000 |
|
Europe |
150,695.50 |
344,973,000 |
Source: WITS
Furthermore, the emerging trends in the methanol market show associated energy-related uses, especially methanol-to-olefins and marine fuels, expanding rapidly as industries are looking for cleaner alternatives to fossil fuels. Meanwhile, in June 2024, the article published by SDEWES Organization stated that technological learning and capacity expansion are expected to reduce methanol production costs over the long term. It also stated that the global methanol synthesis capacity is projected to rise from 76 GW in 2022 to 118 GW by 2030 and 345 GW, which is equal to around 500 Mt, by 2050 under growth scenarios. Investment cost reductions for methanol systems are estimated at around 24% to 30% by 2050, supported by scale effects and incremental efficiency gains in plant engineering rather than full equipment transformation. Moreover, the methanol production costs remain structurally dependent on low-cost renewable power access and high-capacity utilization to achieve meaningful parity with fossil-based alternatives.
Key Methanol Market Insights Summary:
Regional Highlights:
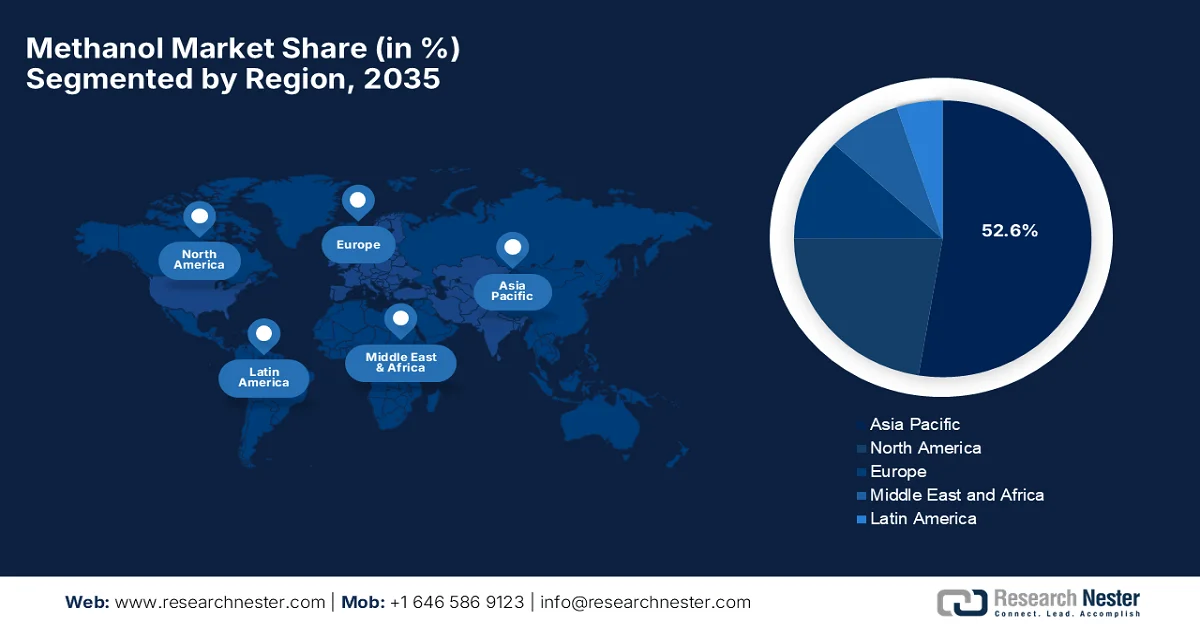
- Asia Pacific methanol market is projected to dominate with a 52.6% share by 2035, bolstered by coal-based production, rapid industrialization, and rising demand from automotive, construction, and chemical industries
- North America is anticipated to secure a notable share during the forecast period, supported by abundant natural gas-based production and increasing investments in low-carbon fuel initiatives
Segment Insights:
- The coal sub-segment in the methanol market is expected to account for a dominant 64.5% share by 2035, propelled by cost-effective large-scale production enabled by abundant coal reserves and widespread adoption of coal gasification technologies
- The formaldehyde sub-segment is projected to capture a significant revenue share over the forecast period, driven by robust demand from housing and infrastructure development in emerging economies
Key Growth Trends:
- Rising demand from chemical manufacturing industry
- Increasing adoption as a fuel and fuel additive
Major Challenges:
- Feedstock price volatility and supply risk
- Environmental concerns and regulatory pressure
Key Players: Methanex Corporation (Canada), Celanese Corporation (U.S.), LyondellBasell Industries (Netherlands), OCI N.V. (Netherlands), Proman AG (Switzerland), BASF SE (Germany), SABIC (Saudi Arabia), Mitsubishi Gas Chemical Company, Inc. (Japan), Mitsui & Co., Ltd. (Japan), Itochu Corporation (Japan), BP Plc (London), Transition Industries (U.S.), Petroliam Nasional Berhad (PETRONAS) (Malaysia), Sarawak Petchem Sdn. Bhd. (Malaysia), Reliance Industries Limited (India), Gujarat Narmada Valley Fertilizers & Chemicals Limited (India), Southern Chemical Corporation (U.S.), Valero Energy Corporation (U.S.), Zagros Petrochemical Company (Iran), Yankuang Energy Group Company Limited (China), Metanol Group (Czech Republic), Exolum (Spain), Ørsted (Denmark), Australian Gas Infrastructure Group (Australia).
Global Methanol Market Forecast and Regional Outlook:
Market Size & Growth Projections:
- 2025 Market Size: USD 35.9 billion
- 2026 Market Size: USD 37.5 billion
- Projected Market Size: USD 53.3 billion by 2035
- Growth Forecasts: 4.5% CAGR (2026-2035)
Key Regional Dynamics:
- Largest Region: Asia Pacific (52.6% Share by 2035)
- Fastest Growing Region: North America
- Dominating Countries: China, United States, India, Germany, Japan
- Emerging Countries: Brazil, Indonesia, Vietnam, Mexico, Saudi Arabia
Last updated on : 17 April, 2026
Methanol Market - Growth Drivers and Challenges
Growth Drivers
- Rising demand from chemical manufacturing industry: The global methanol market is largely driven by its strong usage as a basic chemical building block. This is the main raw material that is used for producing formaldehyde, acetic acid, methyl tertiary butyl ether, and various solvents and resins. In this context, the article published by WITS revealed that India’s methanal, i.e., formaldehyde, export in 2024 was valued at almost USD 6.67 million, with a total shipment volume of 30.24 million kg, indicating steady international demand for basic chemical intermediates. At the same time, the total exports were highly concentrated, with Nepal alone accounting for over 25 million kg, i.e., USD 4.66 million, showing strong regional dependence. Hence, overall, exports are driven by proximity industries and developing economies requiring formaldehyde for resins, adhesives, and industrial chemical applications.
Top 10 India Methanal (Formaldehyde) Export Destinations in 2024 by Value and Volume
|
Country |
Export Value (USD ‘000) |
Quantity (Kg) |
|
Nepal |
4,661.74 |
25,031,100 |
|
Chile |
334.51 |
528,000 |
|
Nigeria |
246.26 |
717,761 |
|
Bhutan |
174.10 |
863,371 |
|
Kenya |
168.15 |
517,103 |
|
Dominican Republic |
108.19 |
307,110 |
|
Sri Lanka |
96.32 |
172,445 |
|
Australia |
87.08 |
190,408 |
|
Madagascar |
82.79 |
160,922 |
|
Panama |
73.07 |
171,521 |
Source: WITS
- Increasing adoption as a fuel and fuel additive: Methanol is being used as an alternative fuel and gasoline blending component, influenced by its lower emissions and cost advantages when compared to conventional fuels. It can also be converted into dimethyl ether and biodiesel, which are cleaner-burning alternatives. As stated by the Press Information Bureau (PIB) in January 2023, the Ministry of Petroleum & Natural Gas flagged off the low-carbon cruise on the Mahabahu Brahmaputra as a demonstration of cleaner fuel adoption in inland waterways transport. This particular initiative featured an inland water vessel which was powered by methanol-blended diesel (MD15). In addition, this pilot project highlights methanol’s prominent role as an alternative fuel and diesel blending component, which is aimed at reducing emissions and promoting low-carbon mobility in the shipping and transport sector, thus benefiting the overall methanol market.
- Growing demand from the marine and shipping industry: The maritime category is considered to be the main catalyst for the methanol market, as there has been a rising pressure to reduce greenhouse gas emissions. Shipping companies across the globe are gradually adopting methanol-powered vessels and dual-fuel engines in order to comply with the evolving worldwide regulations. In this context, the 2023 IMO Strategy on Reduction of GHG Emissions from Ships, which was adopted at MEPC 80 in July 2023, established a global framework to decarbonize international shipping and accelerate the uptake of low and zero-emission fuels. In addition, it has set a target including a 40% reduction in carbon intensity by 2030 and at least 5% to 10% uptake of zero or near-zero emission fuels by 2030. Hence, such instances are supporting the growing adoption of cleaner fuels such as methanol as part of the energy transition in maritime transport.
Challenges
- Feedstock price volatility and supply risk: This is the major burden for the methanol market since the production is mainly dependent on feedstocks such as natural gas, coal, and increasingly biomass. Fluctuations in terms of natural gas prices, especially in regions such as Europe and the Asia Pacific, directly impact production costs and profit margins. At the same time, coal-based methanol, dominant in China, faces huge regulatory and environmental pressures, adding another uncertainty. On the other hand, supply chain disruptions, which are caused by geopolitical tensions, trade restrictions, or infrastructure constraints, can also destabilize availability. Producers in this field need to balance sourcing strategies constantly, long-term contracts, and spot purchases to manage cost risks. Therefore, this volatility makes pricing less predictable for downstream industries, thereby complicating planning and investment decisions across the value chain.
- Environmental concerns and regulatory pressure: Methanol is being promoted as a cleaner alternative fuel, but the production process is still carbon-intensive, especially when it is derived from fossil fuels. Government and regulatory bodies across different nations are tightening emission standards, encouraging companies to reduce their carbon footprint. At the same time, compliance requires huge investments in carbon capture, cleaner technologies, and reporting systems. Methanol is toxic and poses environmental risks if improperly handled, leading to stricter safety and transportation regulations. These factors increase operational costs and create barriers for smaller producers in the methanol market. In addition, the transition toward green methanol is necessary but complicated, as it requires alignment with evolving global climate policies and sustainability frameworks.
Methanol Market Size and Forecast:
| Report Attribute | Details |
|---|---|
|
Base Year |
2025 |
|
Forecast Year |
2026-2035 |
|
CAGR |
4.5% |
|
Base Year Market Size (2025) |
USD 35.9 billion |
|
Forecast Year Market Size (2035) |
USD 53.3 billion |
|
Regional Scope |
|
Methanol Market Segmentation:
Feedstock Segment Analysis
The feedstock segment in the methanol market is predicted to be led by coal with the largest share of 64.5% by the end of 2035. The dominance is mainly driven by countries with abundant coal reserves, where coal gasification is used as a cost-effective route to produce methanol at a large industrial scale. Coal-based production is particularly significant in regions such as China, where energy security and domestic resource availability support its extensive use. In June 2024, ChinaCoal announced that it had officially begun construction of the main plant at its Yulin coal in‑depth processing base project, which marks the first coal chemical project approved after China’s carbon neutrality pledge. This project includes a large methanol plant, a polyolefin facility, and upgrades to existing operations. At the same time, such expansion projects effectively drive local economic growth, optimize industrial structure, and thus denote a wider segment scope.
Derivatives Segment Analysis
Under the derivatives segment, formaldehyde is expected to garner a significant revenue share in the methanol market during the stipulated timeframe. The growth of this segment is largely attributable to strong demand from housing and infrastructure development, particularly in emerging economies, which supports long-term growth. In March 2025, as stated by the Securities and Exchange Commission, Methanex observed that global methanol demand includes significant use in chemical derivatives such as formaldehyde, which is ultimately produced from methanol. The document notes that demand for methanol and its derivatives is influenced by industrial production and economic activity, including construction growth. This directly supports the association between methanol-derived formaldehyde demand and housing and infrastructure development, particularly in emerging economies, hence contributing to wider methanol market expansion.
Application Segment Analysis
In the application segment, construction is anticipated to grow with a considerable share in the methanol market over the forecasted years. The extensive use of methanol-derived products such as formaldehyde-based resins, plastics, adhesives, insulation materials, plywood, and flooring solutions is essential in modern construction activities, driving the segment’s leadership. As infrastructure development and urbanization continue to expand globally, the demand for these materials increases significantly, directly boosting methanol consumption. In May 2023, Fraunhofer WKI introduced a formaldehyde-free bio-adhesive at LIGNA 2023 to offer a healthier and sustainable alternative to conventional phenol-formaldehyde resins. It is developed from lignin and hydroxymethylfurfural, and the resin is fully bio-based, recyclable, and compatible with existing production technologies. Hence, such developments meet rising demands for eco-friendly and health-conscious wood-based materials in construction, furniture, and beyond.
Our in-depth analysis of the methanol market includes the following segments:
|
Segment |
Subsegments |
|
Feedstock |
|
|
Derivatives |
|
|
Application |
|
|
Sub Derivatives |
|

Vishnu Nair
Head - Global Business DevelopmentCustomize this report to your requirements — connect with our consultant for personalized insights and options.
Methanol Market - Regional Analysis
APAC Market Insights
The Asia Pacific methanol market is forecasted to be the largest, capturing the highest revenue share of 52.6% by the end of 2035. The region’s dominance is largely attributable to coal-based production, rapid industrialization, and rising demand from key end use industries such as automotive, construction, and chemicals. The increasing adoption of methanol-to-olefins processes and their expanding use as a cleaner fuel are efficiently supporting regional market expansion. In 2025, the report published by the International Energy Agency (IEA) stated that hydrogen demand in Southeast Asia reached 4 Mt in 2024, wherein methanol accounted for a significant 20% of total hydrogen use, indicating its strong industrial role in the region’s chemical sector. It mentions that Malaysia alone represents about 69% of methanol-related hydrogen consumption, highlighting its position as a key production and consumption hub in the Asia Pacific, thus making it suitable for standard methanol market growth.
The strong domestic demand and increasing consumption in both chemical manufacturing and fuel applications are responsibly driving the methanol market in China. At the same time, continued investment in cleaner manufacturing processes, renewable integration, and efficient logistics is strengthening the country’s position in the market. Based on government data published in April 2026, a green fuel demonstration program has begun construction in Shenyang, China, with a total annual capacity of 500,000 tons. Besides, its first phase is a 100,000‑ton green methanol project, which is to be completed in two years, followed by 300,000 tons of sustainable aviation fuel and 100,000 tons of green ammonia. After becoming operational, this project will consume 3 million tons of biomass annually, thus positively impacting the methanol market’s growth.
The strong government backing with suitable initiatives to reduce reliance on imported crude oil is driving the methanol market in India. A major visible trend in the industry is the shift toward green methanol, which is produced from renewable feedstocks, biomass, and captured carbon dioxide, along with constant efforts to leverage India's abundant high-ash coal reserves through gasification technology. In this context, the PIB article published in March 2026 stated that India launched the green ammonia and green methanol standards under the National Green Hydrogen Mission with the main goal of boosting trade in hydrogen derivatives. In addition, the green ammonia threshold was set at not more than 0.38 kg CO₂ eq/kg NH₃, whereas the green methanol was capped at 0.44 kg CO₂ eq/kg CH₃OH, both averaged over 12 months. Moreover, CO₂ for methanol can be sourced from biogenic sources, DAC, or industrial streams, with renewable energy, including stored or banked electricity.
North America Market Insights
The North America methanol market is expected to attain a considerable share during the forecast period. The regional market growth is largely attributable to abundant natural gas-based methanol production and increasing investments in low-carbon fuels. Demand is primarily driven by methanol use in gasoline blending, petrochemical production, and emerging sustainability-focused projects, including renewable methanol initiatives. In March 2024, Ørsted was selected by the U.S. Department of Energy to receive up to USD 100 million in funding for its star e-methanol facility on the Texas Gulf Coast. This project will produce up to 300,000 metric tons of e-methanol annually by cutting CO₂ emissions by more than 90% when compared to conventional marine fuel. With such federal support, pioneers in the region are reaping encouraging growth opportunities to be competitive in this sector.
The supportive federal initiatives and grants are readily driving the upliftment of the methanol market in the U.S. The market is primarily supported by noteworthy demand from the construction and automotive sectors for chemical intermediates such as formaldehyde and acetic acid, alongside a burgeoning role in the maritime industry. In March 2026, Southern Energy Renewables announced a total of USD 1.4 billion investment to build a green methanol and sustainable aviation fuel facility in St. Charles Parish, Louisiana. The project will convert locally sourced wood-waste biomass into low-carbon transportation fuels by leveraging existing energy infrastructure and regional supply chains. This particular project is positioned as a large-scale clean fuel initiative, which will support aviation and maritime fuel demand, thereby expanding U.S. alternative fuel production capacity.
Canada methanol market is poised for extensive growth in the years ahead, owing to the strategic use of vast natural gas reserves and a rapidly growing focus on low-carbon innovation. A major growth driver for the market is the clean fuel regulations, which encourage the adoption of sustainable alternatives in the transportation and marine sectors. As of the December 2024 article published by the country’s government, Quantiam Technologies Inc. is leading the Methanol+ project in Edmonton, Canada, with almost USD 3.15 million in EIP support and a total cost of USD 4.9 million. This particular initiative aims to develop and prototype CO₂-to-methanol technology at a lab-scale pilot level by scaling critical process variables by 10 to 100X to validate catalysts and processes. The ultimate goal is carbon-negative methanol production using captured CO₂ and solar hydrogen, replacing fossil-based syngas routes, thus suitable for bolstering methanol market growth in the overall country.
Europe Market Insights
In Europe, the methanol market is undergoing a major evolution as it is making a shift from a traditional chemical feedstock hub toward a leader in the global energy transition. Growth in the region’s market is increasingly dictated by stringent climate policies. A defining trend is the rapid scaling of renewable methanol fueled by certain mandates that incentivize the adoption of cleaner marine fuels at major ports. In June 2023, the article published by the National Institute of Health (NIH) revealed that methanol is a key industrial chemical widely used as a fuel, fuel additive, and feedstock for producing olefins, aromatics, and other essential compounds. The energy crisis in the region has led to a sharp rise in natural gas prices, which has significantly increased the cost of conventional methanol production. The study finds that methanol from captured CO₂ and renewable hydrogen became cost-competitive, supporting Europe’s shift toward green methanol.
The methanol market in Germany has a huge opportunity to grow owing to its role as a major force of the country’s industrial landscape, serving as a vital raw material for its massive chemical and pharmaceutical sectors. The country is aggressively pivoting toward green methanol to align with its national hydrogen strategy and climate neutrality goals. In August 2023, the Leuna100 project was launched at Germany’s Leuna Chemical Park, and it was funded with almost USD 11.3 million by the country’s Federal Ministry of Digital Affairs and Transport. It aims to scale green methanol production for shipping and aviation using C1’s new catalyst technology to convert CO₂ and renewable feedstocks. Such projects have the complete potential to save over a gigaton of CO₂ annually, marking a major step toward defossilizing hard-to-electrify sectors, thus indicating an optimistic methanol market opportunity.
The heightened demand which is arising from chemical manufacturing and a huge focus on cleaner energy solutions are certain factors supporting the growth of the methanol market in the UK. The presence of government policies that are aimed at decarbonization, along with advancements in sustainable fuel technologies and carbon capture integration, is also encouraging the development as well as adoption of methanol across industrial and energy applications. In September 2025, Associated British Ports (ABP) secured funding under the UK Department for Transport’s Clean Maritime Demonstration Competition Round 6, which provides up to USD 38 million in total funding, for the TURBO-METH project focused on green methanol production technology trials with partners including Shoreham Port and Newcastle University. This project will evaluate bio-methanol production, logistics, and bunkering systems to support large-scale maritime applications and assess demand for methanol as a clean fuel.
Key Methanol Market Players:
- Methanex Corporation (Canada)
- Celanese Corporation (U.S.)
- LyondellBasell Industries (Netherlands)
- OCI N.V. (Netherlands)
- Proman AG (Switzerland)
- BASF SE (Germany)
- SABIC (Saudi Arabia)
- Mitsubishi Gas Chemical Company, Inc. (Japan)
- Mitsui & Co., Ltd. (Japan)
- Itochu Corporation (Japan)
- BP Plc (London)
- Transition Industries (U.S.)
- Petroliam Nasional Berhad (PETRONAS) (Malaysia)
- Sarawak Petchem Sdn. Bhd. (Malaysia)
- Reliance Industries Limited (India)
- Gujarat Narmada Valley Fertilizers & Chemicals Limited (India)
- Southern Chemical Corporation (U.S.)
- Valero Energy Corporation (U.S.)
- Zagros Petrochemical Company (Iran)
- Yankuang Energy Group Company Limited (China)
- Metanol Group (Czech Republic)
- Exolum (Spain)
- Ørsted (Denmark)
- Australian Gas Infrastructure Group (Australia)
- Company Overview
- Business Strategy
- Key Product Offerings
- Financial Performance
- Key Performance Indicators
- Risk Analysis
- Recent Development
- Regional Presence
- SWOT Analysis
- Methanex Corporation is considered to be one of the largest methanol producers and suppliers, and it has production facilities across North America, South America, and New Zealand. The company’s strength is its worldwide distribution network and long-term client base, which allows it to maintain a leading position in this field.
- SABIC is one of the prominent petrochemical giants that has a strong presence in methanol production. The firm benefits from access to low-cost feedstock and large-scale integrated operations, and it is focused on sustainable chemicals and circular economy initiatives.
- Proman AG has significant production assets in Trinidad and the U.S. The company is making heavy investments in terms of green methanol and clean energy solutions, including renewable methanol and hydrogen projects. Proman is also involved in promoting methanol as a marine fuel.
- OCI N.V. is considered to be a leading producer of methanol and nitrogen-based fertilizers that has production facilities in Europe, the Middle East, and the U.S. The company has been making a shift toward low-carbon methanol, including bio- and e-methanol projects.
- Celanese Corporation is a global chemical and specialty materials company that uses methanol as a key feedstock in its acetyl chain operations. The company plays a crucial role in downstream demand. In addition, the company is highly focused on operational efficiency, integration, and sustainable product innovation.
Below is the list of some prominent players operating in the global methanol market:
The global methanol market is considered to be a consolidated landscape, which is being led by large-scale producers such as Methanex Corporation, SABIC, and Proman AG, supported by integrated chemical firms along with some of the regional players. To secure their market positions and strengthen supply chains, companies in this field are proactively pursuing capacity expansions, mergers & acquisitions, and vertical integrations. In addition, firms are also forming partnerships in the marine fuel and energy sectors, positioning methanol as a key alternative fuel in the global decarbonization transition. In this context, Mitsubishi Gas Chemical in November 2025 signed a long‑term agreement with Transition Industries to offtake around 1 million tons annually of ultra‑low carbon methanol from the Pacifico Mexinol Project in Mexico. This particular deal supports Japan and Asia’s decarbonization goals, strengthening MGC’s Carbopath™ carbon‑circular initiative.
Corporate Landscape of the Methanol Market:
Recent Developments
- In February 2026, Exolum, Methanex, and Ørsted together launched the U.K.’s first commercial bio methanol bunkering service at the Port of Immingham. This initiative leverages existing infrastructure to supply ISCC‑certified bio methanol, which cuts emissions by up to 80% when compared to conventional fuels.
- In September 2025, ITOCHU Corporation announced it supplied biomass-based low-carbon methanol fuel to Nippon Yusen Kabushiki Kaisha and completed ship-to-ship bunkering for a dual-fuel vessel at Port of Ulsan. This supports emission reduction, and it leverages existing fuel infrastructure for easier adoption in global shipping.
- In July 2023, BP Plc invested USD 10 million in WasteFuel to develop bio-methanol plants, starting with its first in the UAE. This bio-methanol helps decarbonize shipping, which drives 90% of trade.
- Report ID: 683
- Published Date: Apr 17, 2026
- Report Format: PDF, PPT
- Explore a preview of key market trends and insights
- Review sample data tables and segment breakdowns
- Experience the quality of our visual data representations
- Evaluate our report structure and research methodology
- Get a glimpse of competitive landscape analysis
- Understand how regional forecasts are presented
- Assess the depth of company profiling and benchmarking
- Preview how actionable insights can support your strategy
Explore real data and analysis
Frequently Asked Questions (FAQ)
Methanol Market Report Scope
Free Sample includes current and historical market size, growth trends, regional charts & tables, company profiles, segment-wise forecasts, and more.
Connect with our Expert


Copyright @ 2026 Research Nester. All Rights Reserved.
