Metallurgical Coke Market Outlook:
Metallurgical Coke Market size was valued at USD 265.31 billion in 2025 and is likely to cross USD 392.72 billion by 2035, registering more than 4% CAGR during the forecast period i.e., between 2026-2035. In the year 2026, the industry size of metallurgical coke is assessed at USD 274.86 billion.
World crude steel production for the 69 countries reporting to the World Steel Association was 151.4 million tons in January 2025. The mounting demand for steel production from coal and fossil-based electricity generation drives the metallurgical coke market. Coal still supplies just over a third of global electricity despite being a carbon-intensive fossil fuel. With energy demand continuing to grow, many countries feel they have little choice but to continue generating power with coal. Global coal adoption rebounded after plummeting at the height of the COVID-19 pandemic. In 2024, it increased to 8.77 billion tons and is estimated to swell through 2027. The top five countries were China, India, the U.S., Indonesia, and Australia, representing 81% of the global coal capacity.
World Metallurgical Coal Production, by Country, 2022
|
Country |
Volume (Million tons)
|
Share (%) |
|
China |
555 |
49.2 |
|
Australia |
169 |
15.0 |
|
Russia |
134 |
11.9 |
|
India |
57 |
5.1 |
|
The U.S. |
57 |
5.1 |
|
Vietnam |
47 |
4.2 |
|
Canada |
27 |
2.4 |
|
Others |
80 |
7.1 |
|
Total |
1,126 |
100.0 |
Source: Government of Canada
The pandemic-associated drop in coal demand resulted in prices plunging in 2020, but eventually rebounded to record highs in October 2021. Prices have stabilized since then but remained 50% higher than the 2017-2019 period. In November 2024, the imported thermal coal costs in Europe were roughly USD 120 per ton, compared to USD 80 per ton during 2017-2019. The Australia thermal coal cost is about USD 140 per ton, versus USD 90 at the end of the last decade. Over 2 billion tons of iron ore, 1 billion tons of metallurgical coal, and 650 million tons of recycled steel were utilized in 2021 by the global steel industry to manufacture more than 1 billion tons of crude steel.
2024 U.S. Coal Overview (in thousand Short Tons)
|
Month |
Production |
Waste Coal Supply |
Trade |
Stock Change |
Consumption |
||
|
Imports |
Exports |
Net Imports |
|||||
|
Jan. |
44,052 |
830 |
94 |
8,411 |
-8,318 |
-8, 523 |
45,652 |
|
Feb. |
44,011 |
721 |
151 |
9,119 |
-8,969 |
6,082 |
29,116 |
|
Mar. |
41,808 |
768 |
85 |
9,275 |
-9.191 |
6,226 |
25,530 |
|
Apr. |
35,709 |
746 |
254 |
6,843 |
-6,589 |
3,373 |
24,253 |
|
May |
39,370 |
599 |
80 |
8,938 |
-8,858 |
1.025 |
29,281 |
|
Jun. |
43,004 |
777 |
203 |
10,011 |
-9,8.09 |
-4,576 |
37,459 |
|
Jul. |
43, 343 |
871 |
185 |
8,760 |
-8,575 |
-8,826 |
43,441 |
|
Aug. |
47,110 |
653 |
288 |
9,094 |
-8,806 |
-7,066 |
42,420 |
|
Sep. |
45,724 |
557 |
248 |
9,453 |
-9,205 |
-53 |
34,448 |
|
Oct. |
43,649 |
399 |
118 |
8,968 |
-8,849 |
4,803 |
30,636 |
|
Nov. |
40,770 |
399 |
167 |
9,421 |
-9,254 |
3,172 |
29,595 |
|
Dec. |
43, 183 |
NA |
127 |
9,295 |
-9,168 |
NA |
NA |
|
Total |
511,733 |
NA |
1,998 |
107,588 |
-105,591 |
NA |
NA |
Source: EIA
In January 2025, China is estimated to have produced 81.9 million tons, a decrease of 5.6% compared to January 2024. India's production increased to 13.6 million tons, an increase of 6.8%. Japan's output was 6.8 million tons, down 6.6%. The United States produced 6.6 million tons, showing a modest increase of 1.2%. Russia is estimated to have produced 6.0 million tons, down by 0.6%. South Korea's production fell to 5.2 million tons, a decrease of 8.8%. Türkiye reported a production of 3.2 million tons, down 1.4%. Germany's estimated output was 2.8 million tons, down 8.8%, while Brazil produced approximately 2.6 million tons, a decline of 4.5%. Lastly, Iran's production significantly dropped to 2.2 million tons, reflecting a decrease of 24.1%.
Key Metallurgical Coke Market Insights Summary:
Regional Highlights:
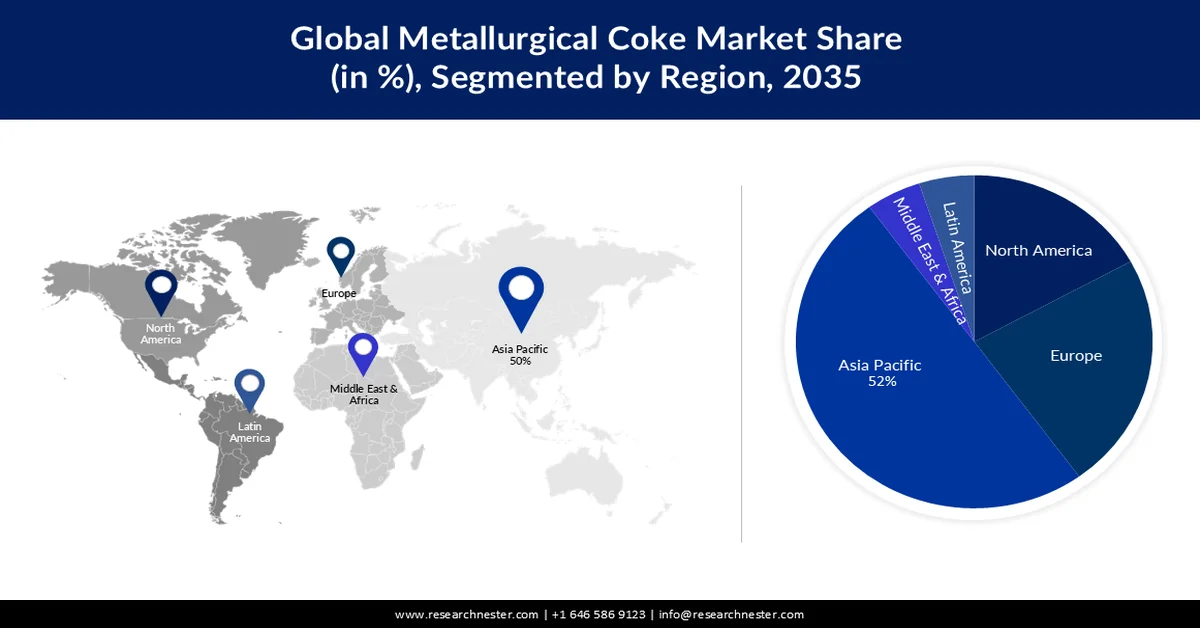
- The Asia Pacific metallurgical coke market is predicted to hold the largest share of 52% by 2035, impelled by the enormous production of metallurgical coke.
- North America is anticipated to secure a notable revenue share by 2035, owing to the robust metallurgical coal mining and usage in the steel sector.
Segment Insights:
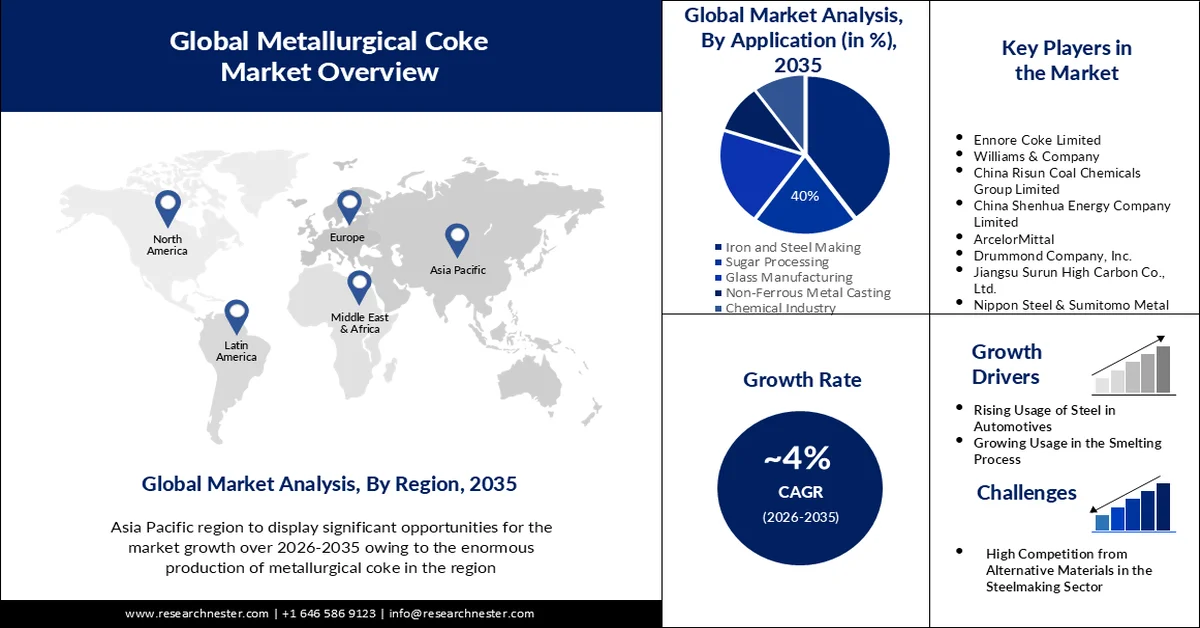
- The iron and steel-making segment is projected to account for a 40% share by 2035, impelled by growing production of steel.
- The blast furnace coke segment is anticipated to secure a significant share by 2035, driven by its essential role as a reducing agent in iron production.
Key Growth Trends:
- Rising usage of steel in the automotive sector
- Massive boom in worldwide coke trade
Major Challenges:
- High competition from alternative materials in the steelmaking sector
Key Players: Swedish Orphan Biovitrum AB, AB2 Bio Ltd., Alpine Immune Sciences., Bellicum Phamaceuticals, Inc..
Global Metallurgical Coke Market Forecast and Regional Outlook:
Market Size & Growth Projections:
- 2025 Market Size: USD 265.31 billion
- 2026 Market Size: USD 274.86 billion
- Projected Market Size: USD 392.72 billion by 2035
- Growth Forecasts: 4% CAGR (2026-2035)
Key Regional Dynamics:
- Largest Region: Asia Pacific (52% Share by 2035)
- Fastest Growing Region: Asia Pacific
- Dominating Countries: China, United States, Japan, India, Germany
- Emerging Countries: China, India, Japan, South Korea, Germany
Last updated on : 25 February, 2026
Metallurgical Coke Market - Growth Drivers and Challenges
Growth Drivers
-
Rising usage of steel in the automotive sector: The automobile industry poses a high demand for light-duty body-in-white (BiW) steel. For instance, the steel typically sourced from U.S. mills is used for automotive manufacturing. Across the 15 local automakers, approximately 3.9 million tons were used to build the BiWs of all LDVs developed in the country in 2023. This value represents the steel that contributes to the final assembly of BiWs.
U.S. Light-Duty Body-in-White Steel Demand by Automakers, in 2024
Automakers
Demand for BiW steel (Million Kg)
Market Share (%)
General Motors
796
20.3
Stellantis
463
11.8
Ford
441
11.2
Toyota
438
11.2
Honda
424
10.8
Hyundai
344
8.8
Nissan
267
6.8
Subaru
173
4.4
Mercedes-Benz
172
4.4
Others
410
10.4
Source: The International Council on Clean Transportation (ICCT)
The production of green steel with green hydrogen is presently limited in the U.S., as per the ICCT report. If U.S. automobile manufacturers switch to green steel, the 3.9 million tons (Mt) LDV BiWs capacity plants can be retrofitted to produce green steel. Moreover, there is a massive potential to decarbonize the current steel industry. In 2023, U.S. LDV, heavy-duty vehicles, medium-duty vehicles, and two-wheelers developers collectively used about 14% or 11 Mt of domestically sourced steel, implying that at least another 7 Mt of automotive steel can be decarbonized beyond what is used for LDV BiWs.
As vehicle sizes increase, total vehicle costs typically rise at a faster rate than the cost of green steel. This means that the premium for using green steel in the BiW does not necessarily represent a larger percentage of the manufacturer's suggested retail price (MSRP) for larger vehicle classes. January 2024 MSRP comparison based on vehicle class BiW green steel cost premium, denotes an average car MSRP of USD 35,724 and a cost premium of USD 167 (0.47%), trucks have a USD 50,016 average MSRP and a cost premium of USD 124 (0.25%), and SUVs have USD 43,616 average MSRP and a cost premium of USD 206 (0.47%).
The Inflation Reduction Act (IRA) of 2022 renders tax credits to incentivize green hydrogen adoption. The H2-DRI-EAF green steel generation, in its most carbon-efficient mode, utilizes renewable electricity to supply green hydrogen via electrolysis. This green hydrogen is then used to reduce iron ore, which is further processed into steel. As a result, this pathway qualifies for both the Clean Hydrogen Production Tax Credit and the Renewable Electricity Production Tax Credit. Furthermore, the European Union (EU) produces an average of USD 200.6 billion worth of finished steel each year, amounting to around 140 million tons. The steel industry in the EU is comprised of 500 production sites across 22 EU Member States. This sector directly employs 303,000 people and is responsible for up to 2.27 million indirect jobs.
- Massive boom in worldwide coke trade: In 2023, coke was the 332nd most traded item, accounting for USD 11.3 billion in value and representing 0.05% in share among all other products. The key exporters included China (USD 2.48 billion), Poland (USD 2.37 billion), Colombia (USD 1.3 billion), The U.S. (USD 642 million), and Australia (USD 584 million). Whereas, India (USD 1.68 billion), Brazil (USD 1.54 billion), Germany (USD 1.06 billion), UK (USD 650 million), and Indonesia (USD 623 million) emerged as the top five importers in 2023, as per OEC.
Challenge
-
High competition from alternative materials in the steelmaking sector: Agricultural waste is a valuable resource since it can be turned into carbon material that can be used as a substitute for coke in steelmaking applications owing to its environmental friendliness and low greenhouse gas (GHG) emissions. This may impact the demand for metallurgical coke a substance that comes from fossil fuels as numerous studies have looked into finding a possible substitute-reducing agent to replace the supply of coke, given the environmental concerns since it is the primary cause of CO2 emissions in steel mills.
Metallurgical Coke Market Size and Forecast:
| Report Attribute | Details |
|---|---|
|
Base Year |
2025 |
|
Forecast Year |
2026-2035 |
|
CAGR |
4% |
|
Base Year Market Size (2025) |
USD 265.31 billion |
|
Forecast Year Market Size (2035) |
USD 392.72 billion |
|
Regional Scope |
|
Metallurgical Coke Market Segmentation:
Application Segment Analysis
The iron and steel-making segment is estimated to account for a 40% share of the global metallurgical coke market by 2035 impelled by growing production of steel. For instance, steel consumption is expected to rise by over 15% by 2050 compared to current levels as it is widely used in the manufacturing of industrial equipment, electrical appliances, furniture, ships, trains, automobiles, bicycles, structures, infrastructure, tools, and military weapons. This has significantly driven the demand for metallurgical coke as over 65% of the steel produced worldwide comes from the burning of coal. Moreover, metallurgical coal is a porous, carbon-rich substance that is used to manufacture coke, which is a necessary reactant and fuel in the blast furnace process for basic steelmaking. According to estimates, the global production of steel has increased from around 185 million metric tons to an astounding 1,880 million metric tons in 2022.
Product Type Segment Analysis
Metallurgical coke market from the blast furnace coke segment is set to garner a notable share. The majority of pig iron made today comes from blast furnaces, which use a cold blast that requires coke, limestone, and carbon that is reduced at a high temperature then they are charged into the furnace from the top and moved downward. Metallurgical coke is utilized in the blast furnace method of producing iron as a reducing agent made from coke that combines with oxygen at the bottom of the blast furnace.
Our in-depth analysis of the global metallurgical coke market includes the following segments:
|
Ash Content |
|
|
Application |
|
|
Product Type |
|

Vishnu Nair
Head - Global Business DevelopmentCustomize this report to your requirements — connect with our consultant for personalized insights and options.
Metallurgical Coke Market - Regional Analysis
APAC Market Insights
Metallurgical coke market in Asia Pacific is predicted to account for the largest share of 52% by 2035, impelled by the enormous production of metallurgical coke. China is a global leader in the production of metallurgical coke as over 60% of the world's metallurgical coke was produced in the country. Besides this, more than 8 million tons of cargo were registered in 2022, and around 5 million metric tons of metallurgical coke were exported from China in 2023 making it the leading seaborne exporter of the product. For instance, China's metallurgical coke production increased by over 3% annually to more than 477 million tons in 2021. India has observed a prominent spike in imports, ascribed to rising inbound shipments of flat products from Japan and ASEAN economies. However, the country’s export rate remains considerably low owing to export duties on steel enacted in 2022. This setback is triggered by export contraction to the EU and Vietnam.
In 2020, China was the leading coal supplier of coal and the government has crafted strategic mining rights for minerals, comprising coal, aluminum, chrome, antimony, cobalt, copper, gold, fluorspar, graphite, lithium, iron, molybdenum, nickel, natural gas, petroleum, potash, phosphorous, tungsten, tin, uranium, and zirconium. The Ministry of Natural Resources (MNR) assigned these as primary minerals eligible for mining rights registered with provincial governments or other lower levels of government. The coal generation was 3.89 Gt in 2020, a 1.0% rise from the earlier year, whereas the consumption surged by 4.1 Gt, a 0.6% spike. Of the total coal produced, 680 Mt was used for steel, 2.39 Gt was for electricity generation, 380 Mt was for construction material, 300 Mt was for the production of chemicals, and 320 Mt was for other purposes. Of the overall energy consumption in 2020, coal accounted for 56.8% and the leading import trade partners or suppliers were Indonesia (35%), Russia (15%), Australia (32%), Mongolia (12%), and Canada (2%). The revenue of the coal industry in China totaled $290 billion in 2020. According to the 2021 USGS Minerals Yearbook, metallurgical coke production was 471,160 metric tons in 2020 and in 2021, it was 464,458 metric tons.
Coke, metallurgical production capacity (Metric tons, gross weight), 2021
|
Facilities, major operating companies, Annual and major North America equity owners |
Location of main facilities |
Annual capacity |
|
China Risun Coal Chemicals Group Ltd. |
Beijing |
5,680 |
|
Hebei Kailuan Energy Chemical Co. Ltd. |
Hebei, Tangshan |
4,270 |
|
Heilongjiang Baotailong New Material Co. Ltd. |
Heilongjiang, Qitaihe |
1,580 |
|
Shaanxi Heimao Coking Co. Ltd. |
Shaanxi, Hancheng |
3,240 |
|
Shandong Jinneng Technology Co. Ltd. |
Shandong, Qihe |
2,300 |
|
Shanxi Antai Group Co. Ltd. |
Shanxi, Jinzhong |
1,800 |
|
Shanxi Coking Co. Ltd. |
Shanxi, Taiyuan |
3,600 |
|
Shanxi Meijin Energy Co. Ltd. |
Taiyuan, Shanxi |
5,040 |
|
Yunnan Coal Energy Co. Ltd. |
Yunnan, Kunming |
1,980 |
Source: USGS
North America Market Insights
The North America metallurgical coke market is projected to garner a prominent revenue share by the end of 2035. The Canada steel sector uses 3.7 megatons (Mt) of metallurgical coke annually in its blast furnaces, according to the Government of Canada. The country’s mines yielded 47 million tons of coal in 2022, of which about 59% was metallurgical coal and 41% was thermal coal, playing a pivotal role in shaping the region’s market. The mined produce mainly came from British Columbia (59%), Alberta (28%), Saskatchewan (13%), and Nova Scotia (0.1%) in 2021.
In six of the past seven years, the price of U.S. coal used for the steelmaking process has more than doubled compared to the price of U.S. coal used as a fuel for electricity generation, highlighting a historical pattern. In the past, U.S. metallurgical coal-which is mostly utilized as a raw material in the steelmaking process—has sold into export markets for more money than U.S. thermal coal, which is a significant fuel for the production of power. U.S. metallurgical coal sold for an average of 90% more than thermal coal between 2001 and 2023.
U.S. metallurgical coal export price rose sharply in 2022 after trade restrictions from Russia. This sustained cost divergence underscores differences in the two major markets catered to by the U.S. coal sector, comprising metallurgy and electricity. Metallurgical coal amounts to 10% of overall coal output, which primarily contributes to global outbound trade. On the contrary, thermal coal produced is consumed predominantly domestically. According to the EIA Annual Coal Report and Quarterly Coal Report, of the 67 million short tons of metallurgical coal generated in 2023, 51 million short tons or 76% was supplied to coke manufacturers and steelmakers worldwide, whereas the thermal coal was roughly 8% in exports of its annual U.S. production.
Average weekly coal commodity spot prices, in USD per mmbtu
|
|
01/31/25 |
02/07/25 |
02/14/25 |
02/21/25 |
02/28/25 |
|
Central Appalachia 12,500 Btu, 1.2 SO2 |
USD 3.06 |
USD 3.06 |
USD 3.06 |
USD 3.04 |
USD 3.04 |
|
Northern Appalachia |
USD 1.96 |
USD 1.92 |
USD 1.92 |
USD 1.92 |
USD 1.92 |
|
Illinois Basin |
USD 1.89 |
USD 1.89 |
USD 1.89 |
USD 1.86 |
USD 1.86 |
|
Powder River Basin |
USD 0.81 |
USD 0.81 |
USD 0.81 |
USD 0.81 |
USD 0.81 |
Source: EIA
Between January and March 2024, production of U.S. coke was 2,730 thousand short tons, which increased to 2,781 thousand short tons during July-September the same year. 577,954 thousand short tons of coal was generated in 2023. Of this, 271,074 thousand short tons (46.9%) were sub-bituminous, 263,087 thousand short tons (45.5%) were bituminous, 40,876 thousand short tons (7.1%) were lignite, and 2,917 thousand short tons (0.5%) were anthracite. The country’s coal stocks were 163.2 MMst in 2023, 42.7% higher than in 2022. Furthermore, electric power coalstocks surged by 44.5 MMst in 2022 to 133.7 MMst in 2023.
Metallurgical Coke Market Players:
- SunCoke Energy Inc.
- Company Overview
- Business Strategy
- Key Product Offerings
- Financial Performance
- Key Performance Indicators
- Risk Analysis
- Recent Development
- Regional Presence
- SWOT Analysis
- Ennore Coke Limited
- Williams & Company
- China Risun Coal Chemicals Group Limited
- China Shenhua Energy Company Limited
- ArcelorMittal
- Drummond Company, Inc.
- Jiangsu Surun High Carbon Co., Ltd.
- Tata Steel Ltd
- Nippon Steel & Sumitomo Metal
- Shanxi Lubao Coking Group Co. Ltd.
- Musashi Seimitsu Industries
The growing advancements in more eco-friendly coke production methods are believed to fuel the metallurgical coke market growth. Businesses are investing in environmentally friendly coke production techniques, to provide effective use of coal as a domestic fuel, and partially replace imported coking coal with less expensive domestic alternative materials. Some of the key companies operating in the metallurgical coke market include:
Recent Developments
- In February 2025, India extended met coke import restrictions to boost domestic production. In early 2025, India introduced country-specific quotas, curbing cumulative imports to 1.4 million metric tons between Q1 and Q2, thereby, fostering India’s self-sufficiency in steelmaking.
-
In November 2023, Glencore plc announced the acquisition of 77% interest in Teck Resources Limited steelmaking coal business for USD 6.93 billion. At closing, Glencore also disclosed the acquisition of Teck, POSCO, and NSC’s attributable share from Teck to EVR, which is repayable out of EVR’s cash flows and is amount is estimated to be between USD 250 million and USD 300 million.
- Report ID: 5422
- Published Date: Feb 25, 2026
- Report Format: PDF, PPT
- Explore a preview of key market trends and insights
- Review sample data tables and segment breakdowns
- Experience the quality of our visual data representations
- Evaluate our report structure and research methodology
- Get a glimpse of competitive landscape analysis
- Understand how regional forecasts are presented
- Assess the depth of company profiling and benchmarking
- Preview how actionable insights can support your strategy
Explore real data and analysis
Frequently Asked Questions (FAQ)
About this Report
Connect with our Expert

Report, 2026-2035


Copyright @ 2026 Research Nester. All Rights Reserved.
