Liquid Pediatric Market Outlook:
Liquid Pediatric Market size was over USD 11.49 billion in 2025 and is projected to reach USD 24.35 billion by 2035, growing at around 7.8% CAGR during the forecast period i.e., between 2026-2035. In the year 2026, the industry size of liquid pediatric is evaluated at USD 12.3 billion.
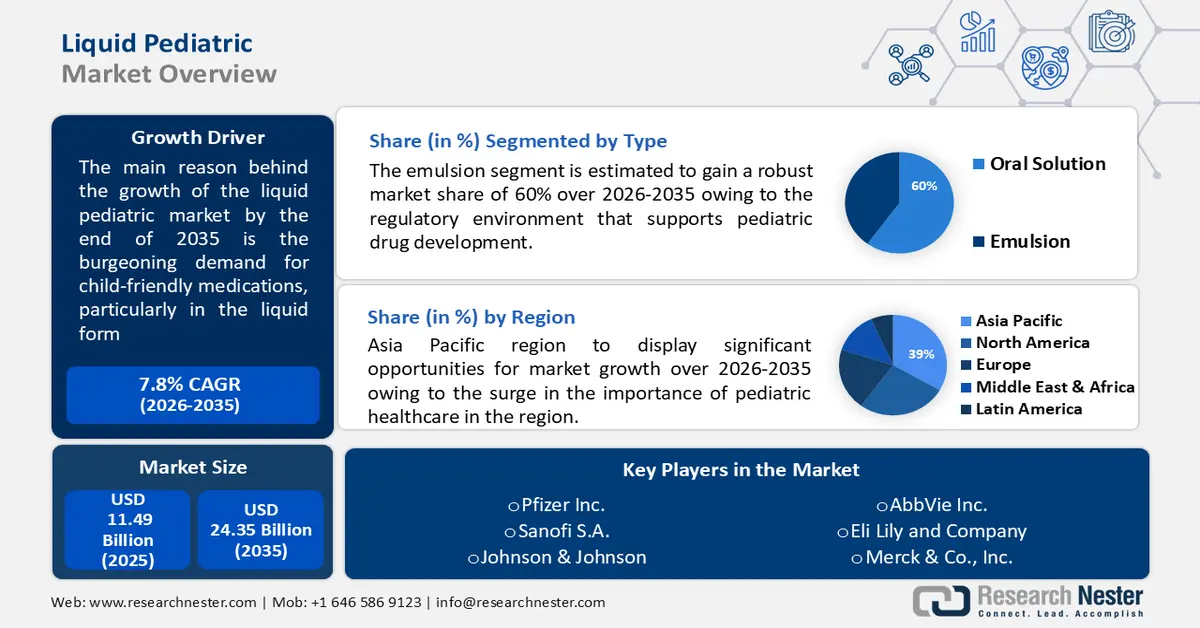
The burgeoning demand for child-friendly medications, particularly in liquid form, stands as a pivotal growth driver for the market. This surge is propelled by a fundamental need to enhance medication adherence and ease administration for children who may struggle with swallowing conventional pills or tablets.
Pharmaceutical companies are increasingly recognizing the significance of developing formulations that are not only efficacious but also palatable and easily consumable for the pediatric demographic.
According to a survey, 78% of parents reported that their children refuse to take medication. Liquid medications offer a practical solution to the challenges associated with administering drugs to children. The palatable nature of liquid formulations makes them more appealing to children, significantly improving medication adherence.
Liquid pediatric refers to medications or medical products specifically formulated for pediatric use and administered in liquid form. This is often done to make it easier for children to take the medication, as they may have difficulty swallowing pills or tablets. Liquid formulations are also advantageous for accurate dosing in children, as doses can be adjusted more precisely based on the child's weight.
Key Liquid Pediatric Market Insights Summary:
Regional Highlights:
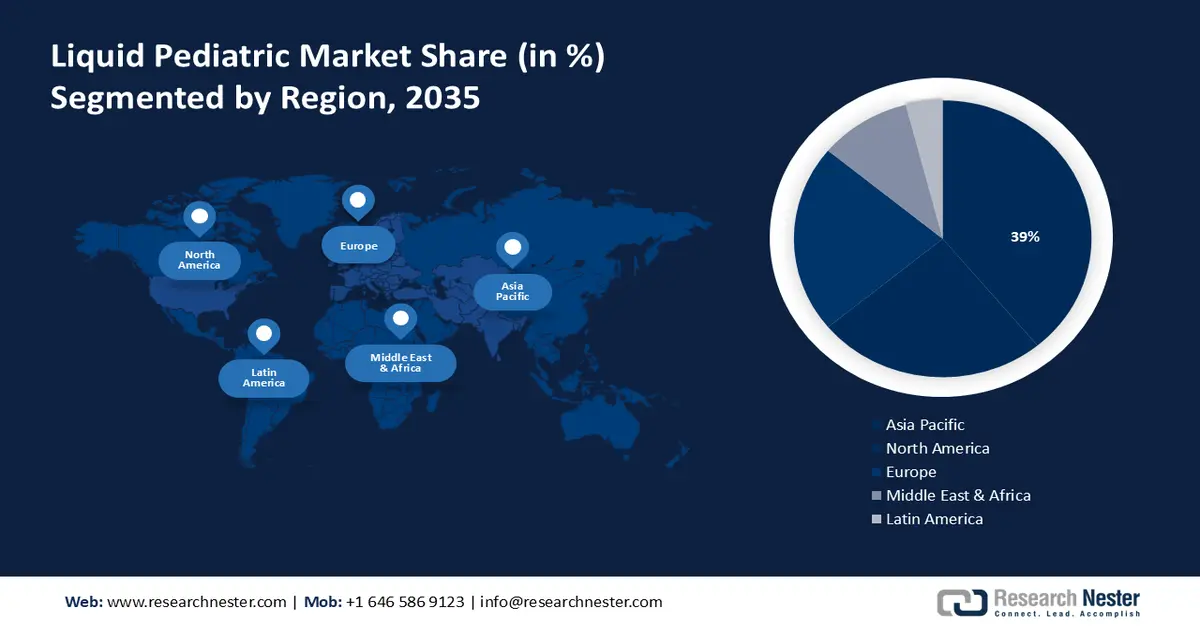
- Asia Pacific liquid pediatric market is expected to hold the largest share of 39%, impelled by the growing importance of pediatric healthcare and rising parental awareness of medication adherence.
- By 2035, North America is projected to secure a significant share, driven by the increasing prevalence of pediatric chronic conditions and demand for child-friendly formulations.
Segment Insights:
- By 2035, the emulsion segment is projected to capture around 60% share, propelled by regulatory support for pediatric drug development.
- The hospital segment is anticipated to hold a significant share by 2035, driven by hospital formulary preferences emphasizing ease of administration, patient compliance, and customizable pediatric dosing.
Key Growth Trends:
- Increasing prevalence of pediatric chronic conditions
- Rising awareness of pediatric health and medication adherence
Major Challenges:
- Stability and shelf life concerns
- Standardization of Dosing Instruments
Key Players: Johnson & Johnson, Pfizer Inc., GlaxoSmithKline plc, Novartis International AG, Sanofi S.A., Merck & Co., Inc.
Global Liquid Pediatric Market Forecast and Regional Outlook:
Market Size & Growth Projections:
- 2025 Market Size: USD 11.49 billion
- 2026 Market Size: USD 12.3 billion
- Projected Market Size: USD 24.35 billion by 2035
- Growth Forecasts: 7.8%
Key Regional Dynamics:
- Largest Region: Asia Pacific (39% Share by 2035)
- Fastest Growing Region: North America
- Dominating Countries: United States, China, Japan, Germany, South Korea
- Emerging Countries: India, Brazil, Australia, Singapore, Malaysia
Last updated on : 26 November, 2025
Liquid Pediatric Market - Growth Drivers and Challenges
Growth Drivers
-
Increasing prevalence of pediatric chronic conditions - The escalating prevalence of chronic conditions in the pediatric population is a significant growth driver for the liquid pediatric market. Chronic diseases such as asthma, diabetes, and various neurological disorders are on the rise among children.
Liquid medications offer a practical and efficient means of delivering consistent treatment to manage these conditions. The need for sustained therapies in chronic pediatric illnesses propels the demand for liquid formulations, fostering market growth. According to a report, o.o129 million children died in 2019 due to asthma.
This surge in chronic conditions emphasizes the demand for effective and child-friendly medication formulations, driving growth in the liquid pediatric market. - Rising awareness of pediatric health and medication adherence - Increasing awareness among healthcare professionals and parents regarding the importance of pediatric health and medication adherence acts as a catalyst for the market.
Healthcare providers are actively promoting the use of liquid formulations to improve adherence rates in children, resulting in better therapeutic outcomes. The growing awareness of the impact of medication adherence on pediatric health fuels the demand for liquid medications.
Pediatrics reported that medication adherence rates in pediatric patients significantly improved when liquid formulations were used, leading to better disease management. - Expansion of pediatric clinical research and trials - The expansion of clinical research and trials focused on pediatric populations is a crucial growth driver for the liquid pediatric market.
Pharmaceutical companies are increasingly investing in pediatric-centric research to develop and validate the safety and efficacy of liquid formulations. The expansion of clinical trials research contributes to a robust pipeline of pediatric medications, propelling the growth of the market.
The liquid pediatric market is poised for substantial growth driven by a confluence of factors, including the increasing prevalence of pediatric chronic conditions, regulatory encouragement for pediatric formulations, parental preferences for liquid medications, technological advancements in drug delivery, rising awareness of pediatric health, and the expansion of pediatric clinical research.
Challenges
-
Stability and shelf life concerns - Liquid formulations are often more susceptible to degradation and have shorter shelf lives compared to their solid counterparts. This poses a challenge for manufacturers to ensure the stability of active ingredients over time, especially considering the potential storage conditions in various settings. This underscores the importance of robust formulation strategies and packaging to mitigate stability concerns. These stability and shelf-life concerns hinder the liquid pediatric market growth.
-
Standardization of Dosing Instruments
- Limited Palatability Options
Liquid Pediatric Market Size and Forecast:
| Report Attribute | Details |
|---|---|
|
Base Year |
2025 |
|
Forecast Year |
2026-2035 |
|
CAGR |
7.8% |
|
Base Year Market Size (2025) |
USD 11.49 billion |
|
Forecast Year Market Size (2035) |
USD 24.35 billion |
|
Regional Scope |
|
Liquid Pediatric Market Segmentation:
Type Segment Analysis
In liquid pediatric market, emulsion segment is poised to capture around 60% share by the end of 2035. regulatory environment, with an emphasis on supporting pediatric drug development, acts as a growth driver for the emulsions segment.
Regulatory bodies recognize the unique challenges in pediatric formulations and encourage innovation to meet the specific needs of children. Emulsions, with their formulation flexibility, align with regulatory goals for enhancing pediatric medication options.
Regulatory agencies, such as the U.S. Food and Drug Administration (FDA) and the European Medicines Agency (EMA), have implemented measures to incentivize pediatric drug development. These initiatives acknowledge the importance of diverse formulations, such as emulsions, in providing safe and effective treatment options for pediatric patients.
Increased preference for palatable formulations, enhanced bioavailability, and regulatory support for pediatric drug development are the growth driving factors for the emulsion segment of the liquid pediatric market.
End User Segment Analysis
The hospital segment in liquid pediatric market is expected to garner a significant share in the year 2035. Hospital formulary decisions play a pivotal role in shaping the medication landscape within healthcare institutions. The preferences of hospital formularies for liquid pediatric medications are driven by considerations such as ease of administration, patient compliance, and the ability to customize dosages for individual pediatric patients.
Many hospital pharmacies prefer liquid formulations for pediatric patients. This preference reflects the emphasis on formulations that align with pediatric dosing requirements and contribute to effective and safe medication administration in a hospital setting. The growth of the hospital segment in the liquid pediatric market is further propelled by factors such as the rising rate of pediatric admissions, the establishment of specialized pediatric units, the prevalence of respiratory conditions, enhanced medication adherence in inpatient settings, and hospital formulary preferences for liquid pediatric medications.
Our in-depth analysis of the global market includes the following segments:
|
Type |
|
|
End User |
|

Vishnu Nair
Head - Global Business DevelopmentCustomize this report to your requirements — connect with our consultant for personalized insights and options.
Liquid Pediatric Market - Regional Analysis
Asia Pacific Market Insights
Asia Pacific industry is set to account for largest revenue share of 39% by 2035, impelled by surge in the importance of pediatric healthcare in the region.. The growing awareness among parents regarding the importance of pediatric healthcare and medication adherence is a significant driver for the market. Parents actively seek child-friendly formulations, such as liquid medications, for their ease of administration and improved palatability, contributing to better medication adherence in children.
According to a survey by the National Center for Biotechnology Information, 88.9% of liquid medications were used by caregivers who were young and educated women. The survey emphasized the impact of parental awareness on medication choices, highlighting the importance of catering to parental preferences in the market.
North American Market Insights
The liquid pediatric market in the North American region is projected to hold a remarkable share over the forecast period. The market in the region is growing due to the increasing prevalence of pediatric chronic conditions.
Chronic diseases, such as asthma and diabetes, are rising among children, which require sustained and precise medications. According to the Asthma and Allergy Foundation of America, 4.5 million children in the United States have asthma. This underscores the substantial burden of chronic conditions among the pediatric population in North America, driving the demand for liquid pediatric medications.
Advancements in drug delivery systems specific to pediatric patients contribute significantly to the growth of the liquid pediatric market. Innovations in taste-masking technologies, improved stability of liquid formulations, and user-friendly packaging enhance the overall patient experience. These technological enhancements address the challenges associated with pediatric medication administration, fostering market expansion.
Liquid Pediatric Market Players:
- Johnson & Johnson
- Company Overview
- Business Strategy
- Key Product Offerings
- Financial Performance
- Key Performance Indicators
- Risk Analysis
- Recent Development
- Regional Presence
- SWOT Analysis
- Pfizer Inc.
- GlaxoSmithKline plc
- Novartis International AG
- Sanofi S.A.
- Merck & Co., Inc.
- AstraZeneca plc
- Boehringer Ingelheim International GmbH
- Eli Lilly and Company
- AbbVie Inc.
Recent Developments
- Pfizer made a major move by acquiring Seagen, a global leader in antibody-drug conjugates (ADCs), for USD 43 billion. This acquisition strengthens Pfizer's oncology portfolio and positions them as a leading force in cancer treatment.
- Pfizer acquired ResApp Health, a company developing AI-powered tools for diagnosing respiratory diseases like pneumonia and tuberculosis using smartphone recordings. This strategic acquisition aims to improve access to accurate and affordable diagnosis in low- and middle-income countries where these diseases are prevalent.
- Report ID: 5504
- Published Date: Nov 26, 2025
- Report Format: PDF, PPT
- Explore a preview of key market trends and insights
- Review sample data tables and segment breakdowns
- Experience the quality of our visual data representations
- Evaluate our report structure and research methodology
- Get a glimpse of competitive landscape analysis
- Understand how regional forecasts are presented
- Assess the depth of company profiling and benchmarking
- Preview how actionable insights can support your strategy
Explore real data and analysis
Frequently Asked Questions (FAQ)
Liquid Pediatric Market Report Scope
Free Sample includes current and historical market size, growth trends, regional charts & tables, company profiles, segment-wise forecasts, and more.
Connect with our Expert


Copyright @ 2026 Research Nester. All Rights Reserved.
