Leucine Market Outlook:
Leucine Market size was estimated at USD 2 billion in 2025 and is expected to reach USD 3.6 billion by the end of 2035, rising at a CAGR of 6.9% during the forecast period, i.e., 2026-2035. In 2026, the industry size of leucine is assessed at USD 2.1 billion.
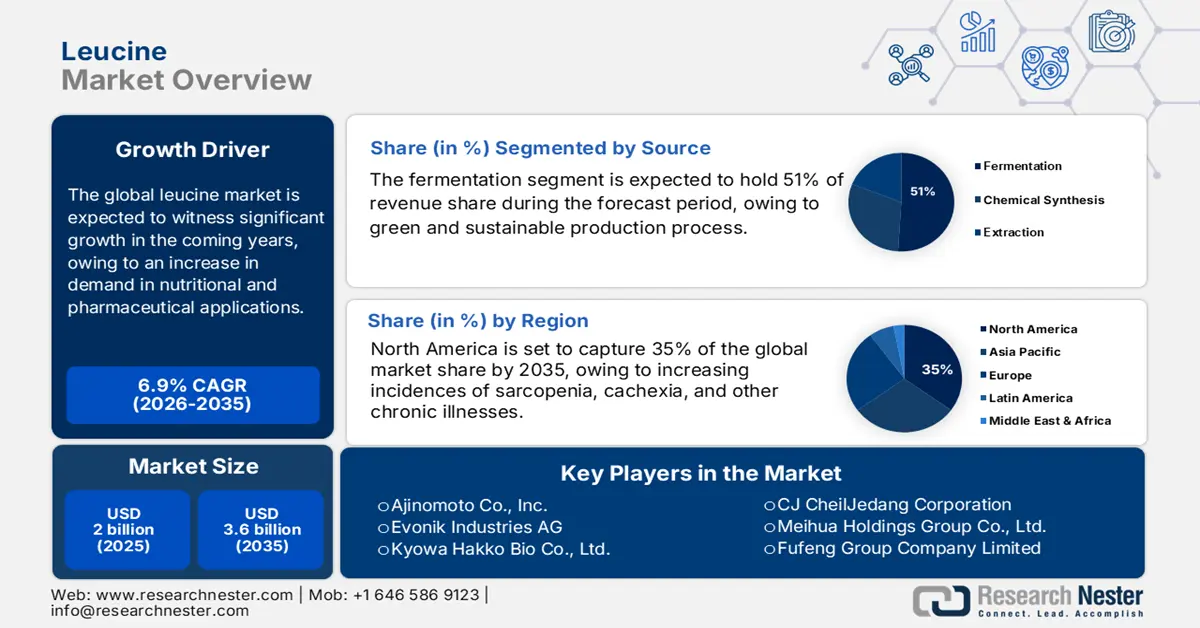
The global leucine market is experiencing sustained growth driven by an increase in demand in nutritional and pharmaceutical applications. Leucine is vital to protein synthesis and metabolic function, making this an important ingredient in dietary supplements and medical nutrition. As per a report by the BLS in September 2025, the producer price index for vitamin, nutrient, and hematinic preparations, for human use, was 157.9 in April 2025, indicating increased producer costs and increased demand. A growth in health and wellness would lead to rising consumption. There is a prevailing upward trend characterized by ever-increasing investments in functional foods and personalized nutrition, especially among aging populations and fitness-conscious consumers.
Leucine is considered the cornerstone in skeletal muscle protein synthesis and metabolic health; hence, it forms and is a prime thrust of nutrition and clinical research. A study by NLM in October 2024 in Santiago, Chile, found that 78.4% of adults aged between 60 and 80 are not able to consume the recommended 3 g of leucine per day, and 17.1% of them were found to have sarcopenia, further strengthening the idea of depleted leucine consumption among aged populations. This calls for a sudden rise in the market of supplementation. Moreover, increasing incidences of sarcopenia due to the aging global populace are fostering a greater need for efficacious nutritional interventions.
Key Leucine Market Insights Summary:
Regional Highlights:
- The North America leucine market is projected to hold a 35% share by 2035, attributed to the rising prevalence of sarcopenia, cachexia, and chronic illnesses that amplify demand for leucine-enriched nutritional solutions.
- The Europe region is expected to emerge as the fastest-growing market through 2035, owing to regulatory support for amino acid supplements and heightened focus on mitigating muscle wasting among the aging population.
Segment Insights:
- The fermentation subsegment in the source category of the leucine market is projected to dominate with a 51% share by 2035, driven by its environmentally sustainable production process and the global shift toward greener manufacturing practices.
- The L-Leucine subsegment within the type segment is expected to hold the highest revenue share by 2035, fueled by its pivotal role in muscle protein synthesis and increasing application in clinical nutrition for aging populations.
Key Growth Trends:
- Rising prevalence of sarcopenia among older adults
- Advancements in clinical nutrition and therapeutic applications
Major Challenges:
- Regulatory and safety concerns
- Market fragmentation and competition
Key Players: Ajinomoto Co., Inc., Evonik Industries AG, Kyowa Hakko Bio Co., Ltd., CJ CheilJedang Corporation, Meihua Holdings Group Co., Ltd., Fufeng Group Company Limited, Amino GmbH, Luzhou Group, Shine Star (Hubei) Biological Engineering Co., Ltd., Jinghai Amino Acid Co., Ltd., Biocon Limited, Lupin Limited, Prinova Group LLC, Tokyo Chemical Industry Co., Ltd., Yoneyama Yakuhin Kogyo Co., Ltd.
Global Leucine Market Forecast and Regional Outlook:
Market Size & Growth Projections:
- 2025 Market Size: USD 2 billion
- 2026 Market Size: USD 2.1 billion
- Projected Market Size: USD 3.6 billion by 2035
- Growth Forecasts: 6.9% CAGR (2026-2035)
Key Regional Dynamics:
- Largest Region: North America (35% Share by 2035)
- Fastest Growing Region: Europe
- Dominating Countries: United States, Germany, China, Japan, France
- Emerging Countries: India, South Korea, Canada, Australia, Italy
Last updated on : 3 October, 2025
Leucine Market - Growth Drivers and Challenges
Growth Drivers
- Rising prevalence of sarcopenia among older adults: With increasing age, there is a natural loss of muscle mass and strength called sarcopenia. According to the report by NLM in June 2025, the prevalence of sarcopenia is seen in almost 10% to 16% of the elderly population around the world, thus demanding an urgent requirement for the development of prevention strategies and effective treatments that add to increasing costs for healthcare and nutrition intervention needs. Leucine appears to stimulate muscle protein synthesis, and thus its supplementation might combat the situation of sarcopenia. An increasing patient population warrants leucine-based therapies and nutritional supplements, such as the leucine market.
- Advancements in clinical nutrition and therapeutic applications: Frequent research has potentized the leucine market for clinical nutrition, especially in patients suffering from cachexia and metabolic disorders. A study published by NLM in June 2025 proved that leucine supplementation can significantly increase lean body mass, with a mean difference (MD) of 0.99 kg, body weight of 1.02 kg, and body mass index (BMI) of 0.33 kg/m2. These findings regarding the therapeutic potential of leucine have consequently prompted a significant increase in research and development investments aimed at expanding its applications across various medical conditions.
- Growing demand for functional foods and dietary supplements: With mounting awareness among consumers regarding health and wellness, the market for functional foods and dietary supplements is pushing for health and wellness claims, such as the market. According to the NIH in July 2024, sales of all kinds of dietary supplements across the U.S. were estimated at USD 55.7 billion in the last 5 years. Among the best-selling categories are also amino acids such as leucine. This trend is likely to change in the coming days, as consumers are searching for products that can enhance muscle health and weight management, together with general well-being. The spurt in personalized nutrition and preventive health care is functioning as a catalyst for innovations such as market.
Leucine-Enriched BCAA Interventions for Hepatic and Metabolic Disorders
Clinical Trials and Ongoing Studies Using Branched-Chain Amino Acids (BCAAs) in the Treatment of Liver Disease (2022)
|
Type of Study |
Intervention(s) |
Patient Population |
Sample Size |
Duration |
Primary Outcomes / Measures |
|
Multicenter RCT |
VAL, LEU, ILE |
Advanced liver cirrhosis |
232 |
6 months |
MELD, Child–Pugh (CP) score, cirrhosis-related event-free survival |
|
Double-blinded RCT |
VAL, LEU, ILE |
Advanced cirrhosis |
174 |
12 months |
CP score, total bilirubin, death or symptom deterioration |
|
Non-specified |
VAL, LEU, ILE / AAA |
Cirrhosis |
104 |
>6 months |
Cumulative survival, delayed complications (hepatic failure, GI bleeding) |
|
Non-specified |
VAL, LEU, ILE |
Cirrhosis |
211 |
≥6 months |
Hepatocellular carcinoma (HCC) occurrence, event-free survival rate |
|
Single-blinded RCT |
AXA1665 (Leu: Ile: Val) |
Child–Pugh A & B cirrhosis |
16 |
15 days |
Liver Frailty Index, lean body mass |
|
Single-blinded, Multicenter RCT |
AXA1125 (VAL, LEU, ILE, ARG, GLN) |
NAFLD ± Type 2 Diabetes |
102 |
16 weeks |
ALT, cytokeratin-18 (K18), fibro-inflammation markers (cT1, Pro-C3) |
|
RCT |
VAL, LEU, ILE |
Hepatocellular carcinoma (HCC) |
51 |
12 months |
Intrahepatic recurrence rate, event-free survival |
|
Ongoing – Triple-blinded RCT (Phase II) |
AXA1125 (VAL, LEU, ILE, ARG, GLN) |
NASH with fibrosis |
273 |
48 weeks |
Improvement in steatohepatitis, resolution of NASH/fibrosis |
|
Ongoing – RCT |
VAL, LEU, ILE |
Cirrhosis |
60 |
3 months |
Muscle mass, insulin resistance |
Source: NLM
Challenges
- Regulatory and safety concerns: While regulatory bodies view leucine as a food supplement and therapeutic agent, this consequently implies that the leucine market undergoes enforceable regulatory supervision. Varying restrictions across countries impede product approval in those territories and extensive entry in the markets, along with extended timelines and higher costs of compliance. Another issue is safety and efficacy, where high-dose leucine supplementation still presents concerns, especially when looking at long-term repercussions on kidney and liver functions.
- Market fragmentation and competition: The market is highly fragmented, with countless providers from dietary supplements to clinical nutrition formulas. Due to heavy competition, prices drop and score little loyalty-from either the final consumers or healthcare providers. Also, alternate amino acids and protein supplements claiming almost similar benefits fill up an overcrowded marketplace, where individual leucine products somehow find it difficult to differentiate themselves and take a major share of the market.
Leucine Market Size and Forecast:
| Report Attribute | Details |
|---|---|
|
Base Year |
2025 |
|
Forecast Year |
2026-2035 |
|
CAGR |
6.9% |
|
Base Year Market Size (2025) |
USD 2 billion |
|
Forecast Year Market Size (2035) |
USD 3.6 billion |
|
Regional Scope |
|
Leucine Market Segmentation:
Source Segment Analysis
The fermentation subsegment in the source segment of the leucine market is projected to dominate with a 51% share by 2035. The green and sustainable production process made it an attraction for the method, especially with global regulatory trends toward greener manufacturing. According to the U.S. Environmental Protection Agency (EPA) in March 2025, industrial emissions from biotechnological fermentation may be 30% less than emissions from traditional chemical synthesis methods. The demand for highly purified leucine and the selectivity of manufacturers on fermentation come from this advantage of being environmentally safe. And then, further improving yields and reducing costs through new strains of microorganisms and fermenting technology makes this subsegment even more prevailing.
Type Segment Analysis
The L-Leucine subsegment within the type segment is expected to hold the highest revenue share by 2035. L-Leucine’s critical role in muscle protein synthesis and metabolic regulation makes it a preferred choice for nutritional and therapeutic applications. As per a report by NLM in February 2022, the current Recommended Dietary Allowance guideline on the recommended dietary allowance for protein in older adults remains at 0.8 g/kg per day, which may be insufficient in vulnerable pre-frail older adults. Its demand is fueled by its application in clinical nutrition concerning sarcopenia and cachexia, while its demand is anticipated to rise with aging populations worldwide. Relying on increased R&D on L-Leucine formulations might further expand the breadth of its application into maintaining dominance over the market.
End user Segment Analysis
The healthcare and clinical nutrition subsegment is forecasted to dominate the leucine market in the end user segment by 2035. The chronic incidence of diseases, growing elderly populations, and awareness about nutritional intervention for muscle wasting and metabolic disorders are driving the growth of this segment. As per a report by the Centers for Medicare & Medicaid Services (CMS), June 2025, Medicare spending rose to USD 1,029.8 billion, an increase of 8.1%. The increasing number of patients needing specialized nutritional support and personalized therapies will ensure good demand for leucine-based products and hence give this subsegment a firm place at the top in terms of revenues earned in the market.
Our in-depth analysis of the global market includes the following segments:
|
Segment |
Sub-segments |
|
Type |
|
|
Form |
|
|
Application |
|
|
End user |
|
|
Source |
|

Vishnu Nair
Head - Global Business DevelopmentCustomize this report to your requirements — connect with our consultant for personalized insights and options.
Leucine Market - Regional Analysis
North America Market Insight
North America is expected to hold the highest market share of 35% within the forecast period due to increasing incidences of sarcopenia, cachexia, and other chronic illnesses. Protein intake declines with age in adults, largely due to energy intake decreases, leading to a higher risk of muscle loss and related conditions. As per a report by NLM in January 2024, every 3%-energy increase in animal protein corresponds to a 6% reduction in the odds of healthy aging in the U.S. This difference in effect sizes is bringing amino acids such as leucine, that optimally trigger muscle protein synthesis into greater demand. Additionally, there is growing research support for leucine in the fight against muscle loss.
U.S. is expected to grow within the forecast period due to rising incidences of sarcopenia, cachexia, and related chronic illnesses, combined with growing awareness among clinicians of the benefits of higher protein intake and essential amino acids. According to the study by the American Journal of Clinical Nutrition in February 2024, consumption of animal protein was associated with lower odds of healthy aging. The ORs per 3%-energy increment with healthy aging were 1.05 for total protein, 1.0 for animal protein, 1.1 for dairy protein, and 1.3 for plant protein. This gap is spurring demand for amino acids such as leucine that can better stimulate muscle protein synthesis. Further, there is increasing clinical research backing leucine’s role in mitigating muscle loss.
Canada market is expected to grow within the forecast period due to growing policy and governance support for elder care and nutritional health, which has led to growing concern in preventing frailty, coupled with consumers' rising interest in amino acid-enriched products. As per a report by Government of Canada in May 2023, muscle or bone-strengthening recommendation adherence was substantially higher in youths aged 12 to 17 years (56.6%, 95% CI: 52.4 to 60.8) and adults aged 18 to 64 years (54.9%, 95% CI: 53.1 to 56.8) than in adults aged 65 years and above (41.7%, 95% CI: 38.9 to 44.5). This difference indicates the necessity for targeted nutrition interventions, such as leucine supplementation for muscle maintenance and functional health in the aging population in Canada.
Europe Market Insight
Europe is expected to hold the fastest-growing market within the forecast period due to increasing emphasis on safeguarding the elder population's health, along with a rising matrix of muscle wasting, and regulatory support for nutritional and amino acid supplements, which has driven the industry. Growing concerns about an inactive lifestyle among the aging population in Europe are slowly getting into the public health domain, which will cause a decline in muscle mass and strength through aging. As per a report by Diabetes UK in 2024, an estimated 6.3 million people are at an increased risk of type 2 diabetes. Henceforth, the demand for leucine and leucine-rich preparations is on the rise, more so in the healthcare and clinical nutrition sectors.
The leucine market in the UK is expected to grow within the forecast period due to government schemes and public health policies on musculoskeletal health for the elderly, coupled with nutritional guidelines that recommend higher protein intake and strength support exercises. As per a report by Diabetes UK in 2024, the country is projecting a significant increase in its elderly population, and 4.6 million people live with diabetes. This growing patient population stimulates the demand for amino acid supplements such as leucine to maintain muscle and metabolic health. Furthermore, awareness about sarcopenia and its impact on age-related muscle loss is driving research into and acceptance of leucine-enriched nutrition products.
Germany market is expected to grow within the forecast period due to increasing protein intake recommendations for the elderly and increased interest in plant-based and alternative supplementary proteins, as well as government grants in support of protein and nutrition science. The increasing elderly population in the country is a driver for leucine to assist muscles. Moreover, public health recommendations advocate for sufficient protein to guard against frailty and sarcopenia. German research institutions are also supporting the advancement of amino acid preparations via public programs in nutrition science.
Countries with Whey Exports and Imports in 2023
|
Top Exporters of Whey (2023) |
Export Value (USD million) |
Top Importers of Whey (2023) |
Import Value (USD million) |
|
Germany |
554 |
Netherlands |
423 |
|
France |
381 |
Germany |
179 |
|
Netherlands |
350 |
France |
136 |
|
Poland |
182 |
Denmark |
110 |
|
Ireland |
172 |
UK |
88.4 |
|
Italy |
162 |
Ireland |
74.2 |
Source: OEC
Asia Pacific Market Insight
The market in the Asia Pacific region is expected to grow steadily, with the factors being increasing awareness regarding muscle health, increasing incidences of age-related disorders such as sarcopenia, and increasing investments in clinical nutrition and dietary supplements. According to a UNESCAP report from December 2022, there are around 670 million people aged 60 years or above in Asia and the Pacific, that is roughly one person out of every seven. In the coming decades, this demographic trend is expected to cast its influence further, thus creating demand for leucine-enriched products that aid in healthy aging and alleviate muscle-wasting conditions.
The leucine market in China is growing as consumers nurture health-and-wellness consciousness with age, while age-related muscular disorders come with increasing prevalence, and the government taxes on nutritional supplementation with its empowering policies. According to a report by NLM, in August 2025, about 15 years ago, China had an institutionalization rate of 1.0% reflecting an increasing but still nascent demand for elder care compared to other developed economies of Asia. This trend signals an increasing patient pool requiring nutritional supplementation for the treatment of age-related muscle decline and frailty.
India is growing due to increasing awareness regarding nutrition and health, an increase in incidences of aging muscle disorders such as sarcopenia, and the expansion of healthcare infrastructure. According to an NLM report in December 2022, India has the highest amount of underweight adults all over the world, which is 19.6% in men and 22.4% in women, highlighting an urgent need for nutrition that supports muscle. Giving further enhancement to the Government's thrust on maternal and child health and fighting malnutrition, amino acid supplements will find their demand growing. With a swiftly growing middle class, burgeoning disposable incomes are being put forth in purchasing dietary supplements and functional foods.

Key Leucine Market Players
- Ajinomoto Co., Inc.
- Company Overview
- Business Strategy
- Key Product Offerings
- Financial Performance
- Key Performance Indicators
- Risk Analysis
- Recent Development
- Regional Presence
- SWOT Analysis
- Evonik Industries AG
- Kyowa Hakko Bio Co., Ltd.
- CJ CheilJedang Corporation
- Meihua Holdings Group Co., Ltd.
- Fufeng Group Company Limited
- Amino GmbH
- Luzhou Group
- Shine Star (Hubei) Biological Engineering Co., Ltd.
- Jinghai Amino Acid Co., Ltd.
- Biocon Limited
- Lupin Limited
- Prinova Group LLC
- Tokyo Chemical Industry Co., Ltd.
- Yoneyama Yakuhin Kogyo Co., Ltd.
The global leucine market is highly competitive and has a significant presence, driven by advanced fermentation technology and extensive research and development. As a result of the increased demand in the pharmaceutical, nutraceutical, and animal nutrition sectors, companies are adopting sustainable production practices to produce new products. It is also noted that merger and acquisition activities, as well as strategic partnerships, are being explored to leverage technological capacity and global distribution. Local producers are increasing production capacities to meet demands for emerging markets, especially in Asia, both domestically and internationally.
Some of the key players operating in the market are listed below:
Recent Developments
- In July 2025, Epirium Bio announced that they have finished the first stage of testing its new drug MF-300 in humans, which is an oral drug designed to treat sarcopenia. The study included healthy adults and aimed to check if the drug is safe and well-tolerated.
- In December 2024, Lipocine Inc. announced that the FDA had Fast Track Designation for its experimental drug LPCN 1148, which is an oral drug that delivers bioidentical testosterone to improve muscle strength and health.
- Report ID: 2847
- Published Date: Oct 03, 2025
- Report Format: PDF, PPT
- Explore a preview of key market trends and insights
- Review sample data tables and segment breakdowns
- Experience the quality of our visual data representations
- Evaluate our report structure and research methodology
- Get a glimpse of competitive landscape analysis
- Understand how regional forecasts are presented
- Assess the depth of company profiling and benchmarking
- Preview how actionable insights can support your strategy
Explore real data and analysis
Frequently Asked Questions (FAQ)
Leucine Market Report Scope
Free Sample includes current and historical market size, growth trends, regional charts & tables, company profiles, segment-wise forecasts, and more.
Connect with our Expert


Copyright @ 2026 Research Nester. All Rights Reserved.
