Industrial Gas Market Outlook:
Industrial Gas Market size was valued at USD 120 billion in 2025 and is projected to reach USD 226.7 billion by the end of 2035, rising at a CAGR of 6.5% during the forecast period, i.e., 2026-2035. In 2026, the industry size of industrial gas is assessed at USD 128.6 billion.
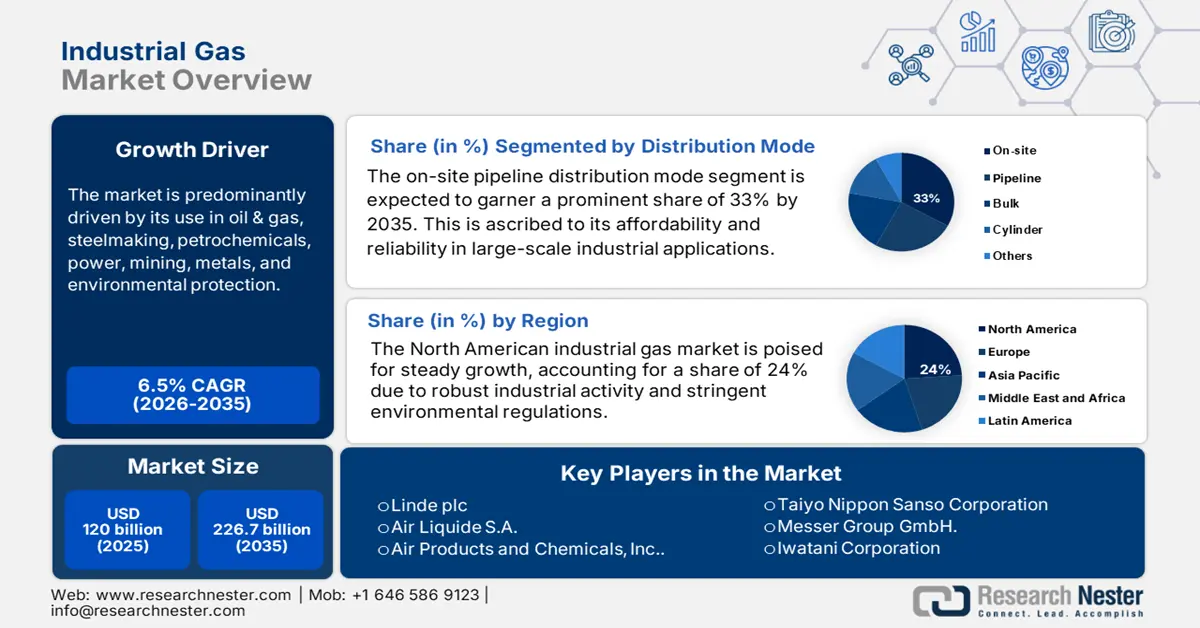
The industrial gas market is predominantly driven by its use in oil & gas, steelmaking, petrochemicals, power, mining, metals, and environmental protection. The world steel manufacturing is estimated to expand at a rate of 1.7% by the end of the current year and by 1.5%, reaching 2 billion tons in 2026. The overall steel consumption is set to grow annually at a rate of 1.1% during the outlook period to 2026. South and South-East Asia, particularly India, North America, and the Middle East. Gradual expansion in ex-China production, whether under construction or planned, is estimated to provide further impetus to steel demand in the assessment period. According to the Australia Resource and Energy report from September 2024, the blast furnace-basic oxygen furnace steelmaking process is likely to garner approximately 50% of the new global supply, accounting for 75% of capacity in the Asia Pacific.
The adverse circumstances faced by China’s steel mills deteriorated in H2 2024 as steel prices slumped to five-year lows in August. China’s monthly steel output during this period dropped 10.3% and recorded a 3.3% decline in the same period in 2023. Partly offsetting the property sector is the shift in funding to advanced manufacturing, comprising novel new energy components, electric vehicles, and infrastructure for solar and wind. These measures are likely to alleviate the setbacks in the domestic property sector and boost construction activity, thereby stabilizing steel and iron ore prices in the forthcoming years. Additionally, exports are pivotal in supporting the steel sector in China during the protracted property downturn. Robust boom steel capacity across several countries, along with sluggish demand, depicts that surplus capacity is an emerging problem. An OECD study suggests that the worldwide crude steelmaking capacity surpassed steel production in 2023 by 543 million tons.
Source: FRED
Global construction, which accounts for a whopping 50% of the global steel demand and is catered to by notable infrastructure investment pledged by some large economies. A few examples include the Bipartisan Infrastructure Framework’s USD 1.2 trillion in the US and the National Infrastructure Pipeline’s USD 1.4 trillion in India. In the wake of tighter credit conditions, the private sector commercial and residential activities remained dampened. However, forward indicators have emerged in the construction sector, thus denoting a modest growth in steel trade.
Key Industrial Gas Market Insights Summary:
Regional Insights:
- Oxygen Segment is projected to account for a leading share in the Industrial Gas Market by 2035, impelled by rising demand in healthcare and manufacturing sectors.
- On-site Pipeline Distribution Mode is expected to hold a 33% share by 2035,. fueled by its cost-effectiveness and reliability in large-scale industrial operations
Segment Insights:
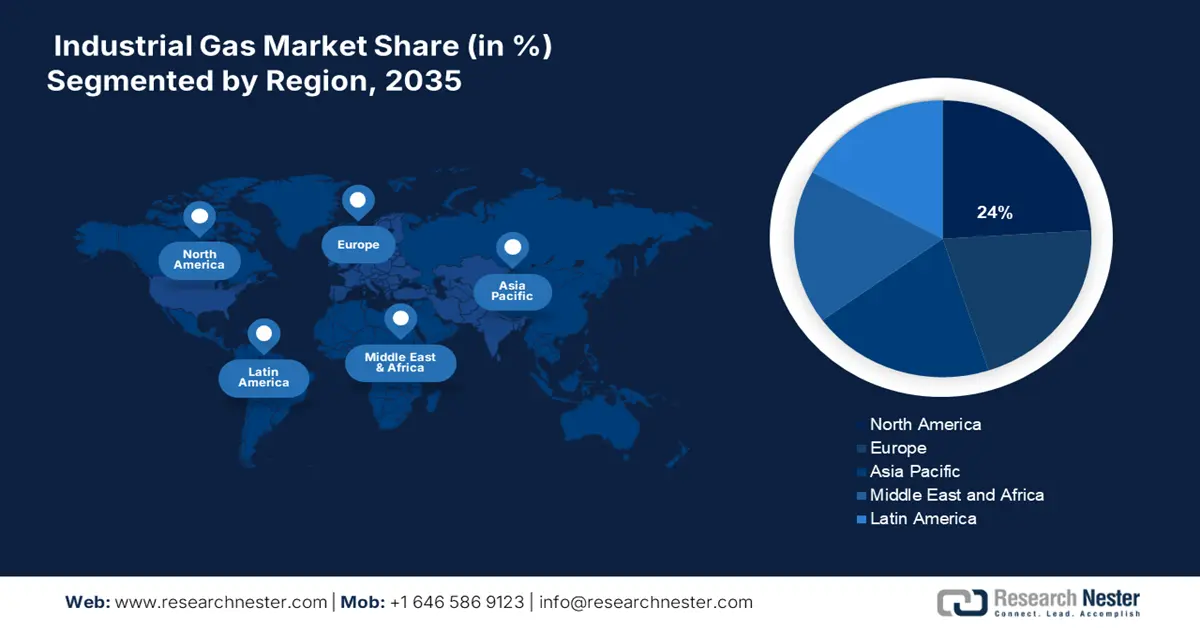
- North America is projected to hold a 24% share of the Industrial Gas Market by 2035, driven by robust industrial activity and stringent environmental regulations.
- Europe is estimated to capture a 21% share by 2035, supported by the adoption of decarbonization fuels and regulatory frameworks promoting clean energy.
Key Growth Trends:
- Cost Efficiency of Oxygen Furnaces
- Emerging Use of Hydrogen as an Energy Source and Supportive Tax Rebates
Major Challenges:
- High Environmental Safety and Compliance Costs
Key Players: Linde plc,Air Liquide S.A.,Air Products and Chemicals, Inc.,Taiyo Nippon Sanso Corporation,Messer Group GmbH,Iwatani Corporation,SOL Group,Yingde Gases Group Company Ltd,Gulf Cryo,SIG Gases Berhad,Coregas Pty Ltd (part of Wesfarmers),INOX Air Products Ltd,TNSC Korea Co., Ltd (Subsidiary of TNSC Japan),Air Water Inc.,Gazprom Gases
Global Industrial Gas Market Forecast and Regional Outlook:
Market Size & Growth Projections:
- 2025 Market Size: USD 120 billion
- 2026 Market Size:USD 128.6 billion
- Projected Market Size: USD 226.7 billion by 2035
- Growth Forecasts: 6.5% CAGR (2026-2035)
Key Regional Dynamics:
- Largest Region: APAC (USD 43 billion by 2035)
- Fastest Growing Region: APAC
- Dominating Countries: United States, China, Germany, Japan, Canada
- Emerging Countries: India, South Korea, Brazil, UAE, Mexico
Last updated on : 16 September, 2025
Industrial Gas Market - Growth Drivers and Challenges
Growth Drivers
- Cost Efficiency of Oxygen Furnaces: Steel and iron are obtained from basic oxygen furnace (BOF), blast furnace (BF), and electric arc furnace (EAF). The BF-BOF method plays a critical role, accounting for approximately 70% of the steel produced. According to an EPA 2023 report, steel mills have been the largest single end user of purified oxygen, and contribute to 65% of U.S. consumption. Chemical manufacturing and other industrial combustion use cases, including glassmaking and ceramics, welding, and pulp and paper, are well-known industrial oxygen applications.
WITS Worldwide Export and Import of Oxygen in 2021
|
2021 Worldwide Trade Oxygen (HS Code 2804.40) |
|||
|
Top 5 Worldwide Exporters Top 5 Worldwide Importers |
|||
|
The U.S. |
1,252 M kg |
Netherlands |
206 M kg |
|
Belgium |
536 M kg |
Luxembourg |
133 M kg |
|
Poland |
74 M kg |
Jordan |
95 M kg |
|
Germany |
73 M kg |
Greece |
85 M kg |
|
Guatemala |
54 M kg |
Slovak Republic |
80 M kg |
Source: EPA
In 2023, the NCBI examined the process-emission intensities and economic burden of basic oxygen furnaces. The data is derived from several sources and stakeholder discussions, from a European viewpoint, in terms of energy cost and resources. The most important aspect is the operational expenditures or OPEX for electric arc furnace steel/direct reduction iron, which is 50% more expensive than its basic oxygen counterparts. Consequently, electricity cost comprises the electricity consumed for steel production and hydrogen generation. Moreover, direct reduction iron/electric arc furnace requires iron ore as a raw material, unlike basic oxygen furnaces. This further adds up to the operational expenses of the former.
Cost analysis of different iron and steel production routes (net of taxes)
|
Technology (EUR/t Steel) |
Blast Furnace/Basic Oxygen Furnace |
Direct Reduction Iron/Electric Arc Furnace |
|
Electricity |
0 |
219 |
|
Iron pellets |
0 |
84 |
|
Coke |
84 |
0 |
|
Iron ore |
189 |
189 |
|
Services |
45 |
40 |
|
Skilled labour |
44 |
40 |
|
Unskilled labour |
5 |
4 |
|
OPEX (EUR/t steel) |
415 |
624 |
|
Process emission (t CO2/t steel) |
1.5 |
- |
|
Investment cost (EUR/t steel) |
- |
1113 |
Source: PMC
- Emerging Use of Hydrogen as an Energy Source and Supportive Tax Rebates: Hydrogen is a widely used industrial gas by refineries to decrease the sulfur content in diesel fuel. The Inflation Reduction Act of 2022 includes two major tax credit programs. The base tax credit amount is roughly $0.60/kg (typically adjusted for inflation), as mentioned in the 2023 National Governors Association publication, and the applicable percentage can range from 20-100% considering lifecycle GHG emissions. It is also extended to the Credit for Carbon Oxide Sequestration, whereas a surplus bonus credit of 5x the base amount is likely to be available in the future. The novel credit program called the U.S. Clean Hydrogen Production Tax Credit is open to all hydrogen manufacturers in the country. This is projected to positively influence the blue hydrogen production.
Hydrogen Tax Credit Programs in the Inflation Reduction Act
|
Program Name |
Period of Availability |
New or Existing |
Eligible Recipients |
|
Clean Hydrogen Production Tax Credit |
Credit is for hydrogen produced after 12/31/22. Credit is available for facilities placed in service before 1/1/33 for their first 10 years. |
New Tax Credit |
Producers of hydrogen in the United States |
|
Credit for Carbon Oxide Sequestration |
Credit can be claimed for 12 years after a facility is placed in service. Facilities must be placed in service before 1/1/33. |
Extended and modified |
U.S. facilities within minimum volumes: 18,750 metric tons for electricity-generating facilities (with carbon capture capacity of 75% of baseline CO2 production); 1,000 metric tons of CO2 per year for DAC facilities; 12,500 metric tons for other facilities |
Source: NGA
In terms of federal financial aid, the Infrastructure Investment and Jobs Act of 2021 allocated USD 9.5 billion to foster the development of hydrogen infrastructure for numerous industrial applications. The Regional Clean Hydrogen Hubs is the largest program that aims to boost new producer networks to promote hydrogen as a clean carrier.
Hydrogen Funding Programs in the Infrastructure Investment and Jobs Act
|
Program Name |
Program Funds |
Program Type |
Program Status |
|
Regional Clean Hydrogen Hubs |
$8 billion |
Competitive |
Applications due 4/7/2023 |
|
Recycling Clean Hydrogen Manufacturing Recycling, Research, Development, and Demonstration Program |
$500 million |
Competitive |
· Concept Papers due 4/19/2023 · Applications due 7/19/2023 |
|
Clean Hydrogen Electrolysis Manufacturing and Recycling Program |
$1 billion |
Competitive |
§ Concept Papers due 4/19/2023 Applications due 7/19/2023 |
Source: NGA
Clean Hydrogen Strategy Roadmap
The clean hydrogen strategy goals are achieving net-zero GHG emissions by 2050 and 100% carbon-free electricity by 2035. It creates pathways for the country to fulfill its 2030 Nationally Determined Contribution. This ambition is attainable through aggressive action, a robust technology portfolio, and adoption in industrial use cases.
U.S. National Clean Hydrogen Strategy and Roadmap, through 2050
Source: U.S. DOE
In transportation, the cost of hydrogen for biofuels varies depending on the variability in demand and availability of feedstock, assuming approximately 6 MMT H2 annually. For industrial use cases, high-end applications are methanol production and steelmaking, while the low end of the range is used to generate ammonia- another popular industrial gas. Clean hydrogen is also used for petroleum refining at the same rate (~6 MMT/year) as that of steam methane reforming (SMR). The anticipatory demand in 2050 in industrial end users, blending, power-to-liquid fuels, grid balancing, and energy storage is depicted below.
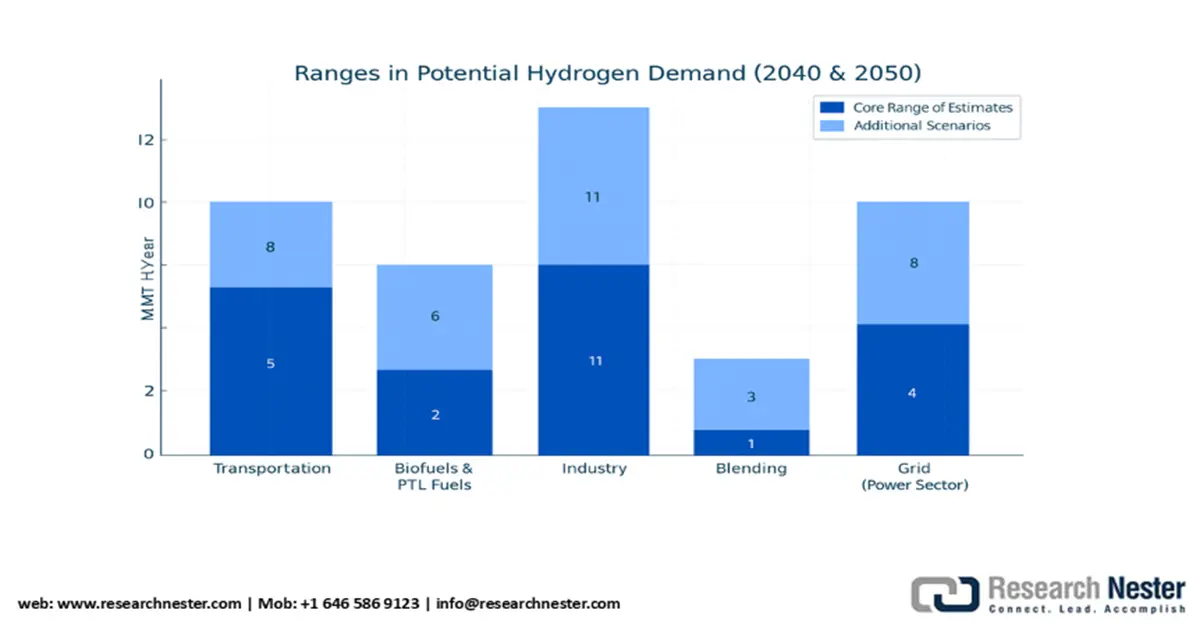
Source: U.S. DOE
The following graph shows the expected industrial hydrogen demand (produced, dispensed, and delivered) as identified by the U.S. DOE. Roughly USD 5/kg for hydrogen is likely to pave the way for early adopters in the market for fuel cells. At about USD4/kg, scenario analyses, 10-14% of all heavy and medium-duty fuel cell trucks are projected at 5-8 MMT annually. The research is yet to be refined owing to the uncertainties in fuel cell price, durability, efficiency, on-board storage, and incumbent fuel costs. However, these statistics are based on high demand for clean hydrogen and are derived based on the assumption that the DOE targets will be met in the future. IRA tax credits are set to support FCEV deployment in the forthcoming years, and the EPA will continue administering IRA programs.
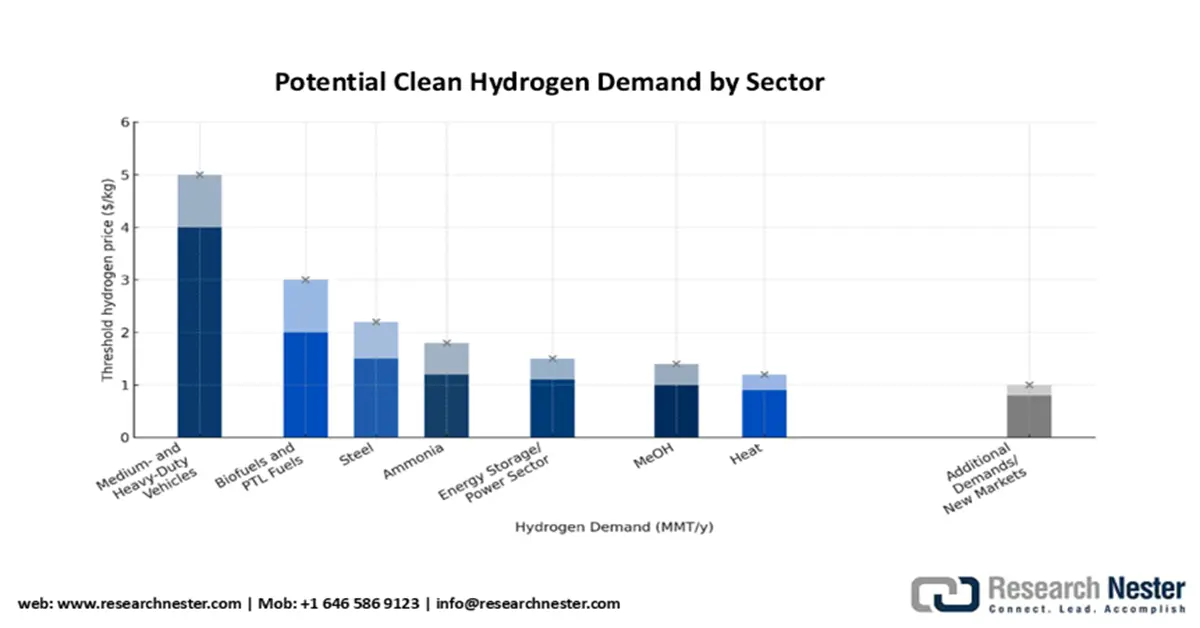
Source: U.S. DOE
Challenges
- High Environmental Safety and Compliance Costs: Industrial gas manufacturers face entry barriers as a result of strict environmental regulations by the EPA and ECHA. The EPA’s 2023 Toxic Substances Control Act led to a spike in compliance for U.S. manufacturers. Cost volatility in raw materials is straining the key players. Trade restrictions and tariffs have further restrained market entry, and suppliers like BASF encountered a two-quarter delay in entering the Indian market. Exorbitant safety compliance prices in the U.S. have stifled smaller companies and prevented unable from competing with giants such as Dow and others.
Industrial Gas Market Size and Forecast:
| Report Attribute | Details |
|---|---|
|
Base Year |
2025 |
|
Forecast Year |
2026-2035 |
|
CAGR |
6.5% |
|
Base Year Market Size (2025) |
USD 120 billion |
|
Forecast Year Market Size (2035) |
USD 226.7 billion |
|
Regional Scope |
|
Industrial Gas Market Segmentation:
Type Segment Analysis
The oxygen segment is projected to dominate the industrial gas market during the forecast period. It has a major demand in the healthcare and manufacturing sectors. The World Health Organization highlights an anticipatory surge in 11% global oxygen demand by the end of 2030 in the healthcare field. Moreover, the U.S. EIA predicts a 3.5% yearly growth in electricity sales to industrial consumers through 2026, necessitating oxygen for steel production, welding, and chemical processes. Technological advancements, such as portable oxygen concentrators, enhance accessibility, further boosting demand.
Distribution Mode Segment Analysis
The on-site pipeline distribution mode segment is expected to garner a prominent share of 33% by 2035. This is ascribed to its affordability and reliability in large-scale industrial applications. According to the IEA, pipeline systems significantly reduce distribution expenditure, making it ideal for continuous gas supply in manufacturing hubs. This supports chemicals and semiconductor manufacturing plants, where uninterrupted gas flow is mandatory. In addition, the U.S. EPA notes a significant decrease in on-site emissions, particularly in the EU and the U.S. The rapid industrialization in APAC is set to propel expansion and accelerate adoption, cementing on-site pipelines as the preferred distribution method.
Our in-depth analysis of the industrial gas market includes the following segments:
|
Segment |
Subsegments |
|
Type |
|
|
Application |
|
|
Distribution Mode |
|

Vishnu Nair
Head - Global Business DevelopmentCustomize this report to your requirements — connect with our consultant for personalized insights and options.
Industrial Gas Market - Regional Analysis
North America Market Insights
The North American industrial gas market is poised for steady growth, accounting for a share of 24% due to robust industrial activity and stringent environmental regulations. Trends on X suggest that there is a rising inclination toward sustainable gas applications. The U.S. is estimated to account for the majority due to its large chemical industry base. The United States leads with significant investments in hydrogen generation, and Canada is keen on boosting nitrogen and oxygen clean energies, specifically in Alberta’s oil sands, and the rising adoption of industrial gases in emerging applications like semiconductors and packaged food production.
The U.S. industrial gas market is predominantly driven by the flourishing steel-making industry. The American Iron and Steel Institute data shows that during the week ending on August 16, 2025, the in-house raw steel generated was 1,774,000 net tons, at a capacity utilization of 78.3%. The total volume in the week ending on 16th August 2024 was 1,726,000 net tons, at a capability utilization of 77.7%. This underscores a 2.8% hike from the same period the year before. The country’s iron and steel sector contributes over USD 520 billion in economic value and generates about USD 56 billion in federal, local, and state taxes.
Europe Market Insights
The European industrial gas market is estimated to hold a share of 21% during the forecast period, reflecting high demand in manufacturing, healthcare, and clean energy sectors. There is a growing discussion on environmentally friendly applications using policy reforms. The European Green Deal’s drive to push the adoption of decarbonization fuels is aiding supply efficiency. Roadblocks in the process include significantly high energy costs and supply chain disruptions, yet the region benefits from robust industry support from the European Chemical Industry Council (CEFIC) and a strong regulatory framework led by the European Chemicals Agency (ECHA).
Germany's industrial gas market is projected to capture 30% of the regional share in the forthcoming years. The automotive segment is a key user of industrial gases such as oxygen and nitrogen in the country. According to the German Chemical Industry Association (VCI), green hydrogen adoption has surged by roughly 14% since 2022, owing to supportive investment of €10.2 billion by the EU Green Deal investments. The Fraunhofer Institute for Chemical Technology (ICT) highlights innovations in sustainable production, reducing costs by 12%. There is optimism about Germany’s leadership in green tech in the future, which will help achieve net-zero targets by 2045.
APAC Market Insights
The APAC industrial gas market is estimated to be valued at USD 43 billion by 2035 and register a CAGR of 6% in the forthcoming years. According to a 2021 International Trade Administration (IEA) report, the Government of India has disclosed plans to increase its natural gas share in the country's energy mix from 15 % by 2030. Half of India’s natural gas supply is procured locally, and the rest is imported in the form of LNG. However, ITA estimates a 70% is currently imported and 30% mix. India accounts for the fourth most LNG import volumes globally (5% in 2023), behind South Korea (11%), China (18%), and Japan (16%). In 2023, India imported 1.1 Tcf of LNG, showcasing a 9.2% surge from 2020. The Middle East accounted for 66.3% of India’s LNG trade (0.7 Tcf in 2023). LNG imports from Qatar grew by 3.8% in 2023, and the U.S. increased by over 42 billion cubic feet (Bcf) in 2023 as compared to 23.9 million tons in 2019.
India industrial gas market is predicted to hold a noteworthy share in the analysis timeline. Government-owned Oil and Natural Gas Corporation (ONGC) accounts for the highest share in the upstream segment, or 70% of India's total oil & gas output. Oil India Limited (OIL)- a government-owned business, and private entities such as Reliance Industries Limited and Cairn India are also key manufacturers. Keeping up with the steep rise in consumption has emerged as a roadblock for domestic players. Other companies are GAIL Limited, Hindustan Oil Exploration Company Ltd., Gujarat State Petroleum Corporation Ltd., Joshi Oil and Gas, Essar Oil and Gas Exploration and Production Ltd., and Adani Welspun Exploration Ltd. There is a sprawling crude pipeline network of 10,419 km, with a capacity of 147.9 million metric tons/annum (mmtpa). Indian Oil Corporation (IOCL) accounts for 5,301 km (50.88%) of the overall crude pipeline network. ONGC leads the country's capacity and has captured a 40.97% share, followed by 32.86% by IOCL.
Key Industrial Gas Market Players:
- Linde plc
- Company Overview
- Business Strategy
- Key Product Offerings
- Financial Performance
- Key Performance Indicators
- Risk Analysis
- Recent Development
- Regional Presence
- SWOT Analysis
- Air Liquide S.A.
- Air Products and Chemicals, Inc.
- Taiyo Nippon Sanso Corporation
- Messer Group GmbH
- Iwatani Corporation
- SOL Group
- Yingde Gases Group Company Ltd
- Gulf Cryo
- SIG Gases Berhad
- Coregas Pty Ltd (part of Wesfarmers)
- INOX Air Products Ltd
- TNSC Korea Co., Ltd (Subsidiary of TNSC Japan)
- Air Water Inc.
- Gazprom Gases
The industrial gas market has a presence of companies such as Linde plc, Air Liquide, and Air Products, among several others. These leaders are leveraging decarbonization technologies, green hydrogen, and strategic mergers & acquisitions to expand their footprints. Innovation in cryogenics, carbon capture, and digital gas monitoring has led to the emergence of a competitive landscape. Some of the key companies operating in the market and their respective shares are mentioned below:
Recent Developments
- In January 2025, GE Vernova Inc. completed a test campaign of Dry Low NOx (DLN) in South Carolina and plans to roll out its new product B- and E-gas turbines in the initial phase of 2026. It uses hydrogen and keeps dry emissions under 25ppm Nox.
- In August 2024, Luxfer Gas Cylinders launched the 70 bar calibration gas cylinder that caters to manufacturing, fire departments, oil & gas, chemical processing, and environmental monitoring. This is a critical component in industrial safety applications.
- In August 2023, Air Water Inc. announced Air Water America- its U.S. subsidiary. This is aimed at boosting industry gas procurement, distribution, and sales in the Northeastern U.S.
- Report ID: 1384
- Published Date: Sep 16, 2025
- Report Format: PDF, PPT
- Explore a preview of key market trends and insights
- Review sample data tables and segment breakdowns
- Experience the quality of our visual data representations
- Evaluate our report structure and research methodology
- Get a glimpse of competitive landscape analysis
- Understand how regional forecasts are presented
- Assess the depth of company profiling and benchmarking
- Preview how actionable insights can support your strategy
Explore real data and analysis
Frequently Asked Questions (FAQ)
Industrial Gas Market Report Scope
Free Sample includes current and historical market size, growth trends, regional charts & tables, company profiles, segment-wise forecasts, and more.
Connect with our Expert


Copyright @ 2026 Research Nester. All Rights Reserved.
