Industrial Air Compressor Market Outlook:
Industrial Air Compressor Market size was estimated at USD 30.39 billion in 2025 and is expected to surpass USD 51.45 billion by the end of 2035, rising at a CAGR of 5.5% during the forecast period, i.e., 2026-2035. In 2026, the industry size of industrial air compressor is estimated at USD 32.03 billion.
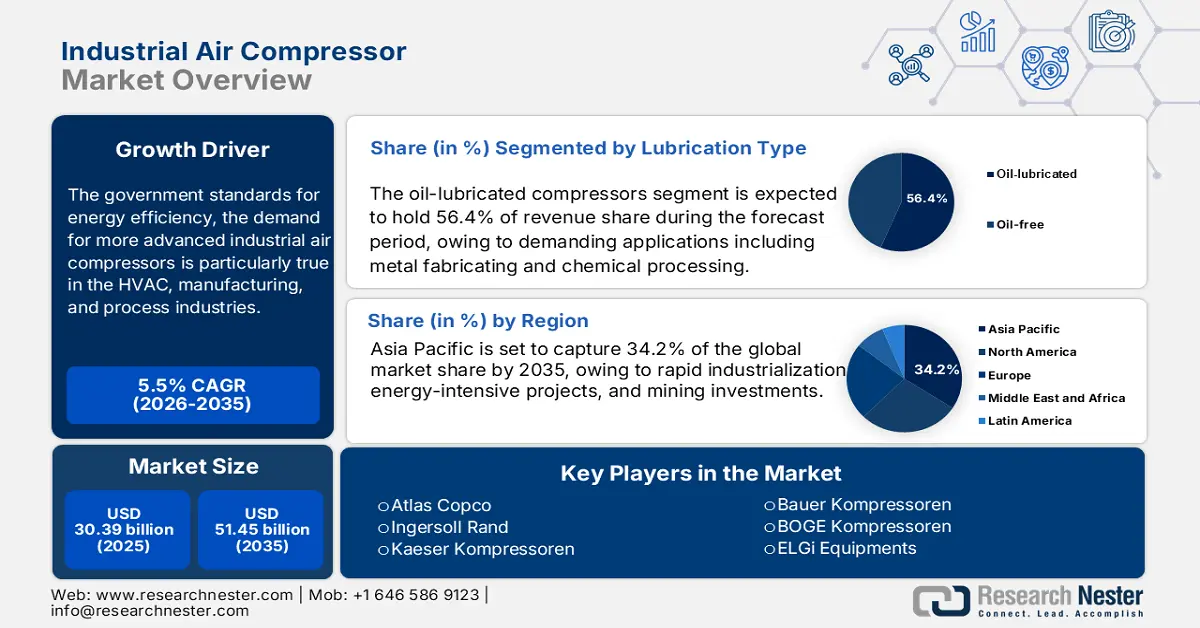
Driven by government standards for energy efficiency, the demand for more advanced industrial air compressors is particularly true in the HVAC, manufacturing, and process industries. The U.S. Department of Energy estimates compressed air systems account for 10% of all electricity and roughly 16% of all motor system energy use in U.S. manufacturing industries. The DOE supports variable-speed rotary compressors and offers incentives to buyers that may include tax rebates. On the supply side, there has continued to be stability in the raw materials used to manufacture compressors, particularly steel and nonferrous metals, although prices were up a year ago.
Alliance Compressors just invested $45 million into a new facility in Louisiana to add 30% more assembly capacity, along with financing from the state government. Through the expansion, Alliance, a joint venture between Emerson, Trane Technologies, and Lennox Industries, will be able to expand its Natchitoches facility, which is 400,000 square feet in size, to include a third assembly line. Some key component facts include imports of control electronics remain high, but R&D activities continue to grow, particularly with inverter controls and lubricants, and the Producer Price Index for air and gas compressor manufacturing increases from 371.919 in June 2024 to 401.340 in August 2025. The regulatory and supply environments support manufacturing growth and global trade of compressors and compressor-related systems.
Key Industrial Air Compressor Market Insights Summary:
Regional Insights:
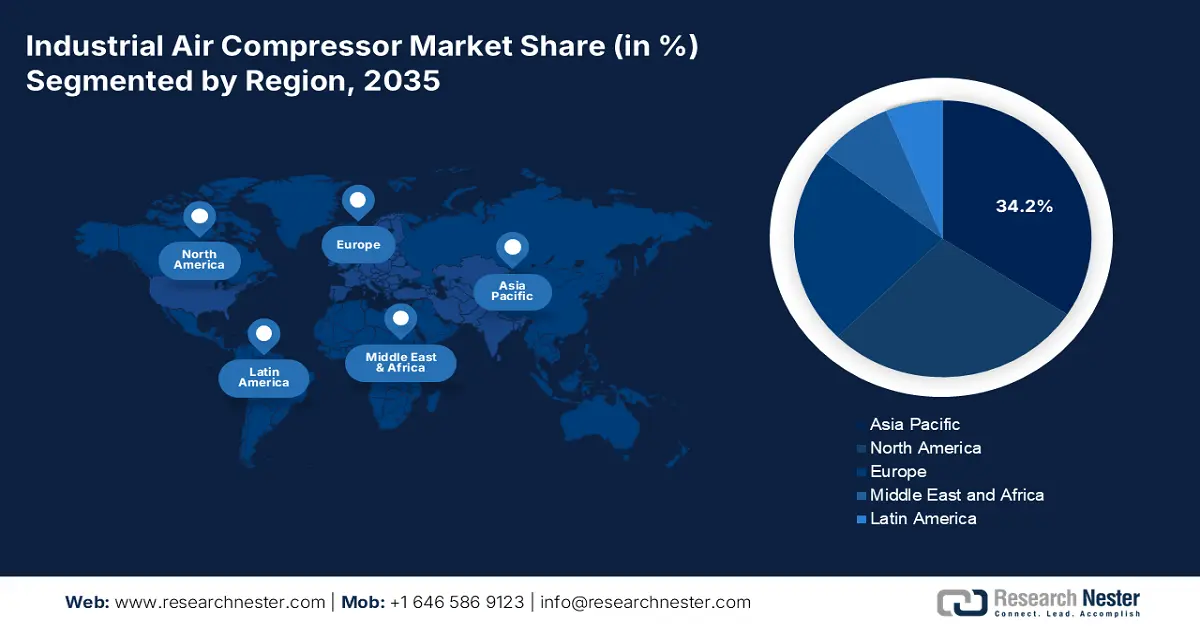
- The Asia Pacific Industrial Air Compressor Market is predicted to command a 34.2% share by 2035, impelled by rapid industrialization, energy-intensive infrastructure projects, and expanding mining investments.
- North America is projected to secure a 28.3% share of the market by 2035, attributed to stringent EPA, DOE, and OSHA regulations alongside rising chemical automation initiatives.
Segment Insights:
- The oil-lubricated compressors segment is projected to account for a 56.4% share of the Industrial Air Compressor Market by 2035, propelled by cost-effectiveness and endurance in demanding applications such as metal fabrication and chemical processing.
- The rotary screw compressors segment is expected to capture 41.6% of the market share by 2035, owing to its high efficiency, low maintenance, and continuous operation suitable for automated industrial processes.
Key Growth Trends:
- Energy efficiency mandates and carbon footprint reduction
- Growth in oil & gas exploration and processing
Major Challenges:
- Infrastructure limitations & power grid barriers
- Maintenance and downtime risks
Key Players: Atlas Copco,Ingersoll Rand,Gardner Denver (part of Ingersoll Rand),Kaeser Kompressoren,Sullair (Hitachi Group),Bauer Kompressoren,BOGE Kompressoren,ELGi Equipment,Chicago Pneumatic (Atlas Copco),FS-Curtis,Hanwha Power Systems,Aerzener Maschinenfabrik,Boge Kompressoren (Australia),Mitsubishi Heavy Industries,Hitachi Industrial Equipment.
Global Industrial Air Compressor Market Forecast and Regional Outlook:
Market Size & Growth Projections:
- 2025 Market Size: USD 30.39 billion
- 2026 Market Size: USD 32.03 billion
- Projected Market Size: USD 51.45 billion by 2035
- Growth Forecasts: 5.5% CAGR (2026-2035)
Key Regional Dynamics:
- Largest Region: Asia Pacific (34.2% Share by 2035)
- Fastest Growing Region: North America
- Dominating Countries: China, United States, Germany, Japan, India
- Emerging Countries: Indonesia, Vietnam, Mexico, Brazil, South Korea
Last updated on : 25 September, 2025
Industrial Air Compressor Market - Growth Drivers and Challenges
Growth Drivers
- Energy efficiency mandates and carbon footprint reduction: By 2050, the European Climate Law and the European Green Deal aim to achieve climate neutrality. Lowering net greenhouse gas emissions by at least 55% by 2030 is an intermediate goal. Energy-efficiency regulations and carbon-reduction goals are driving demand for industrial air compressors. Manufacturers adopt variable-speed and oil-free technologies to meet stricter energy-use standards, lower operating costs, and reduce emissions. Government incentives and corporate sustainability targets further accelerate the replacement of conventional compressors with advanced, eco-friendly systems across diverse industrial sectors worldwide.
- Growth in oil & gas exploration and processing: The oil and gas sector uses compressors for exploration, gas transportation, and refining. The rising exploration of offshore and unconventional reserves and the maintenance of the legacy system add to the demand for compressors. India's oil and gas industry has historically been controlled by public sector enterprises, commonly referred to as government-owned businesses. Nearly 70% of the country's refining capacity and 80% of its oil and gas production come from them. Although there is a shift toward renewable energy, the reliance on fossil fuels and the ongoing investments toward liquefied natural gas terminals and petrochemical plants will maintain the sales momentum in this segment.
- Expansion of food & beverage processing: The market for compressed air remains strong in the food packaging, bottling, refrigeration, and pneumatic conveying applications. With a growing global population and disposable incomes come consumption of processed food, which is the primary driver for larger, cleaner food processing facilities. The demand for oil-free compressor models is particularly high to prevent possible contamination and adhere to strict sanitation standards enforced by the FDA and the equivalent in the European Food Safety Authority.
Emerging Trade Dynamics in the Industrial Air Compressor Market
Top Exporting Countries of Air Compressors Mounted on a Wheeled Chassis
|
Country |
Export Value (USD ‘000) |
Export Quantity (Items) |
|
European Union |
345,662.33 |
166,468 |
|
Belgium |
239,704.54 |
30,302 |
|
China |
166,132.08 |
276,882 |
|
Germany |
118,954.53 |
13,119 |
|
United States |
111,480.82 |
7,314 |
|
Italy |
72,872.14 |
200,543 |
|
India |
52,922.87 |
754,447 |
|
Czech Republic |
45,168.67 |
3,469 |
|
Japan |
34,500.71 |
4,404 |
|
Saudi Arabia |
34,293.05 |
3,028 |
Source: WITS
Challenges
- Infrastructure limitations & power grid barriers: In Europe, they are mounting rapid advances in electrification policy that favour electric compressors over diesel options. In many developing market regions, however, the lack of reliable three-phase power renders those electric compressor alternatives and solutions impractical, either due to performance or reliability issues. For example, India’s 2021 Bureau of Energy Efficiency (BEE) energy-efficiency mandates required shoppers to buy smarter, smart-ready, and smart-modular models. However, rural factories with weak grids are stuck on the last generation of diesel compressors with little attitude and opportunity to troubleshoot their decision to stick with their less compliant technology.
- Maintenance and downtime risks: Industrial air compressors work continuously in harsh conditions and are prone to wear and tear. Unplanned breakdowns can lead to downtime on production, costly repairs, and safety hazards. Regular preventive maintenance helps reduce these concerns but includes ongoing operational costs. When working in food processing or pharmaceuticals, interruptions for service can compromise product quality or compliance, even when only for a short time. The availability of skilled technicians and parts can complicate that maintenance strategy even more while increasing the total cost of ownership.
Industrial Air Compressor Market Size and Forecast:
| Report Attribute | Details |
|---|---|
|
Base Year |
2025 |
|
Forecast Year |
2026-2035 |
|
CAGR |
5.5% |
|
Base Year Market Size (2025) |
USD 30.39 billion |
|
Forecast Year Market Size (2035) |
USD 51.45 billion |
|
Regional Scope |
|
Industrial Air Compressor Market Segmentation:
Lubrication Type Segment Analysis
The oil-lubricated compressors segment is predicted to gain the largest industrial air compressor market share of 56.4% during the projected period by 2035, due to cost-effectiveness and endurance in demanding applications, including metal fabricating and chemical processing. Even if there are environmental problems, the development of effective lubrication systems and oil separation technologies has helped to minimize their detrimental impact. EERE claims that higher pressure uses benefit most from oil-lubricated systems, which also provide the best operating life.
Technology Type Segment Analysis
The rotary screw compressors segment is anticipated to constitute the most significant growth by 2035, with 41.6% industrial air compressor market share, mainly due to the more efficient, requiring less maintenance, and operating continuously, found in automated industrial applications. The need for a steady, energy-efficient air supply is driving their expanding use in the chemical, automotive, and food and beverage sectors. The power range of dry-type oil-free rotary screw compressors is 20-1,000 horsepower, or 80-5,000 acfm. While two-stage devices can typically reach 150 psig, single-stage units can only function up to 50 psig. With their varied speed ability and excellent duty cycles, rotary compressors are crucial for industrial decarbonization, thereby reducing energy waste, according to the U. S. Department of Energy (DOE).
End use Segment Analysis
The chemical & petrochemical segment is anticipated to constitute the most significant growth by 2035, with 31.6% industrial air compressor market share, mainly due to the requirement of continuous and large-scale compressed air, significant to processes such as pneumatic conveying, gas compression, and chemical reactions. It is the increased rate of industrialization, increased petrochemical demand, and growing compliance with efficiency standards that account for the wide use of compressors. By 2025, the Indian chemical industry is predicted to have grown by 9.3% to reach USD 304 billion. In 2023, the Indian chemicals and petrochemicals market was valued at approximately USD 220 billion. By 2040, India's chemical and petrochemical demand is predicted to almost triple, reaching USD 1 trillion.
Our in-depth analysis of the industrial air compressor market includes the following segments:
|
Segments |
Subsegments |
|
Lubrication Type |
|
|
Technology Type |
|
|
Power |
|
|
End use |
|

Vishnu Nair
Head - Global Business DevelopmentCustomize this report to your requirements — connect with our consultant for personalized insights and options.
Industrial Air Compressor Market - Regional Analysis
Asia Pacific Market Insights
By 2035, the Asia Pacific industrial air compressor market is expected to hold 34.2% of the market share, driven by rapid industrialization, energy-intensive projects, and mining investments. Demand emanates from oil, chemical, construction, and manufacturing domains, while also moving toward automation and green solutions. IoT-enabled compressors for predictive maintenance have come into the limelight. However, sustainability directives emphasizing energy-efficient and oil-free technologies bolster the region's market leadership.
China, driven by automation, refinery expansion, and green regulations, will lead the APAC industrial air compressor industry by revenue in 2035. By 2030, the market share of green and efficient cooling products should rise by 40%, the energy efficiency of major cooling products should increase by more than 25%, and the energy efficiency of large public buildings should increase by 30% over 2022 levels, resulting in a combined 400 billion kWh of electricity savings annually. Needs are further generated via policies of Coal-to-Gas and smart-factory transitions. Improving energy-efficiency investments and standing as a steadily growing manufacturing concern, China cements instant dominance under corroborated backing by global research.
Driven by Make in India, SME automation, and environmental demands, India is predicted to have the highest industrial air compressor CAGR (2026-2035). India is poised to surpass China and Japan due to its young workforce, tech-driven manufacturing growth, robust environmental regulations, and growing industrial GDP. Government funding reached the value of automobiles, and auto components increased significantly from ₹346.87 crore to ₹2,818.85 crore, while electronics and IT hardware increased from ₹5,777 crore (the updated projection for 2024-25) to ₹9,000 crore. Additionally, the textile industry has benefited greatly, as its allocation has increased from ₹45 crore to ₹1,148 crore, and PLI projects have increased domestic output. IoT compressor adoption increased between 2021 and 2024, driven by the chemical, automotive, and pharmaceutical sectors.
India Semiconductor Devices Trade by Country in 2023
|
Export Destinations |
Value (USD) |
Import Destinations |
Value (USD) |
|
United States |
1.96 B |
China |
3.83 B |
|
Somalia |
9.82 M |
Vietnam |
965 M |
|
Thailand |
8.90 M |
Malaysia |
726 M |
|
Germany |
8.83 M |
Thailand |
288 M |
|
Hong Kong |
7.42 M |
Japan |
252 M |
Source: OEC
North America Market Insights
The North American market is expected to hold 28.3% of the market share by 2035, due to stricter EPA, DOE, and OSHA rules, as well as rising chemical automation. Compressor adoption is further accelerated by cross-border funding, such as the U.S.-Canada Clean Energy Dialogue. Government-led decarbonization roadmaps and net-zero industrial policies in both countries place a strong emphasis on compressors. NIST and cross-border projects—including the U.S.-Canada Clean Energy Dialogue—foster compressor innovation and sustainability.
The U.S. is driven by strong industrialization, automation, and federal programs designed to improve energy efficiency and low-carbon manufacturing. The main industries generating demand are chemicals, food & beverage, and automotive. Programs designed by the government, such as the Department of Energy's Better Plants and various incentives in the Inflation Reduction Act, will stimulate the market by increasing the adoption of high-efficiency compressors. Packages of oil-injected rotary screw compressors with 3-700 horsepower, 8-4,000 cfm of flow, and discharge pressures ranging from 50-250 psig are offered. There are two-stage and single-stage versions available, with the two-stage designs starting at 125 horsepower. Up to 15% more specific power can be achieved with two-stage variants, and some can reach higher discharge pressures. There are 80 to 3,000 cfm rotary screw vacuum pumps that can reach 29.7 in Hg of vacuum.
Canada is driven by strong mining, oil & gas, and manufacturing activity. Both federal and provincial policies designed to foster clean technology adoption and to reduce emissions will drive the oil-free / energy-efficient technology market. Additionally, growing infrastructure investments, especially to upgrade transportation and renewable energy, will increase demand for energy-efficient compressors. Recently, initiatives like the Canadian Net-Zero Accelerator, industrial efficiency programs, and numerous other incentives will contribute to the broader adoption of advanced compressor technologies and energy-efficient industrial air compression systems, boosting the market growth and ensuring improved energy performance across Canada.
Europe Market Insights
The European market is expected to hold 23.1% of the market share by 2035, due to growing automation, environmental rules, and growing demand in the chemical, marine, and manufacturing industries. Key trends include the adoption of oil-free compressors, IoT integration for predictive maintenance, and growing interest in compact, portable systems. EU projects like Horizon Europe and the Green Deal are increasing, and the adoption of sustainability-oriented compressors is leading to an increase in regional demand for energy-efficient compressor technologies.
Germany is expected to dominate the European industrial air compressor market by 2035. This rise can be attributed to heavy manufacturing across prominent areas like Baden-Württemberg and Bavaria. In June 2021, Germany’s revised Climate Change Act set a 2045 net-zero goal. The government plans EUR 500 billion in special debt-financed infrastructure and climate funds over 12 years, including EUR 100 billion dedicated specifically to cutting greenhouse gas emissions. Strong export manufacturing and continuous investments in hydrogen, renewable energy, and high-tech production facilities further strengthen market growth, while strict DIN and EU efficiency standards push industries toward innovative, low-emission compressor solutions.
The UK’s industrial air compressor market is driven by food and beverage processing, pharmaceuticals, and a growing renewable-energy supply chain. As per a report by Cordis, it is expected that Lontra can emerge as a new player in the compressor market, which is valued at over EUR 10 billion in Europe and over EUR 53 billion worldwide. The product's current production projections could result in an annual worldwide energy savings of 0.5 TWh. Post-Brexit industrial modernization, combined with strong chemical and automotive service sectors, fosters investments in compressed-air systems with smart monitoring, ensuring compliance with the UK Energy Savings Opportunity Scheme (ESOS) and other stringent efficiency regulations.
Key Industrial Air Compressor Market Players:
- Atlas Copco
- Company Overview
- Business Strategy
- Key Product Offerings
- Financial Performance
- Key Performance Indicators
- Risk Analysis
- Recent Development
- Regional Presence
- SWOT Analysis
- Ingersoll Rand
- Gardner Denver (part of Ingersoll Rand)
- Kaeser Kompressoren
- Sullair (Hitachi Group)
- Bauer Kompressoren
- BOGE Kompressoren
- ELGi Equipment
- Chicago Pneumatic (Atlas Copco)
- FS-Curtis
- Hanwha Power Systems
- Aerzener Maschinenfabrik
- Boge Kompressoren (Australia)
- Mitsubishi Heavy Industries
- Hitachi Industrial Equipment
The global air-compressor is growing, with European and U.S. giants like Atlas Copco and Ingersoll Rand at the front, pushing new ideas and snapping up rivals. Japanese companies center their work on oil-free machines that save power. Meanwhile, challengers like India's ELGi and South Korea's Hanwha win customers by keeping prices lean. Rising orders in Asia-Pacific and Africa digital tools (IoT-linked gear), greener models, and wider regional footprints; on top of that, mergers and steady R&D spending are driving the market.
Some of the key players operating in the market are listed below:
Recent Developments
- In March 2025, AERZEN introduced an advanced and oil-free DS and partially load optimized SI compressor series. These products are designed purposely for applications that do not tolerate energy consumption or contamination. AERZEN expects demand for advanced compressors with VSD (Variable Speed Drive) to grow 11-16% within the next 2 years as the chemical industry continues to increase compressor consumption with precision and sustainable outcomes. Systems can now achieve an emerging set of environmental standards and variable demand in chemical processes.
- In March 2024, Hitachi Global Air Power launched the Sullair TS 190-260 two-stage rotary-screw compressors, which have exceptional efficiencies and compactness due to patented inter-stage cooling. In chemical facilities, these compressors reduce total emissions and operating costs 16-21%. The adoption of the system is beginning to accelerate in the chemical market as the urgency to employ energy-savvy high-purity compressed air continues to grow.
- Report ID: 5149
- Published Date: Sep 25, 2025
- Report Format: PDF, PPT
- Explore a preview of key market trends and insights
- Review sample data tables and segment breakdowns
- Experience the quality of our visual data representations
- Evaluate our report structure and research methodology
- Get a glimpse of competitive landscape analysis
- Understand how regional forecasts are presented
- Assess the depth of company profiling and benchmarking
- Preview how actionable insights can support your strategy
Explore real data and analysis
Frequently Asked Questions (FAQ)
Industrial Air Compressor Market Report Scope
Free Sample includes current and historical market size, growth trends, regional charts & tables, company profiles, segment-wise forecasts, and more.
Connect with our Expert


Copyright @ 2026 Research Nester. All Rights Reserved.
