Hardware Asset Management (HAM) Market Outlook:
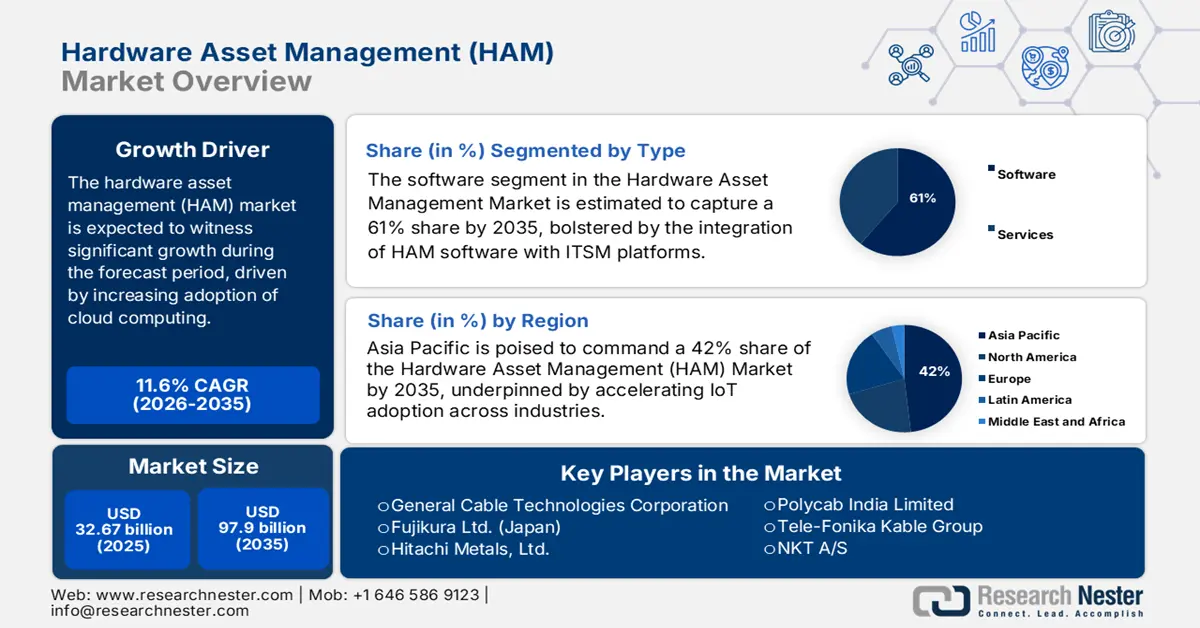
Hardware Asset Management (HAM) Market size was valued at USD 32.67 billion in 2025 and is likely to cross USD 97.9 billion by 2035, registering more than 11.6% CAGR during the forecast period i.e., between 2026-2035. In the year 2026, the industry size of hardware asset management is assessed at USD 36.08 billion.
The ever-evolving landscape of data protection and privacy regulations, coupled with industry-specific compliance mandates, has propelled businesses to adopt robust HAM solutions. These tools play a crucial role in ensuring that organizations maintain a meticulous record of their hardware assets, fostering transparency and adherence to regulatory requirements. As regulatory frameworks governing data security and privacy become more intricate and stringent, organizations face the daunting challenge of aligning their IT practices with these evolving standards. Compliance with regulations such as GDPR (General Data Protection Regulation), HIPAA (Health Insurance Portability and Accountability Act), and other regional data protection laws necessitates a comprehensive approach to managing hardware assets. According to a study in 2020, approximately 75% of organizations anticipated an increase in their spending on IT compliance and risk management.
The escalating frequency and sophistication of cyber threats, including data breaches and ransomware attacks, underscore the critical importance of securing hardware assets. Failure to comply with regulatory standards not only exposes organizations to legal consequences but also increases the risk of data breaches. A robust HAM system serves as a proactive measure, enabling organizations to fortify their defenses by maintaining an accurate inventory of hardware assets, tracking their status, and ensuring that security protocols are in place.
Key Hardware Asset Management (HAM) Market Insights Summary:
Regional Highlights:
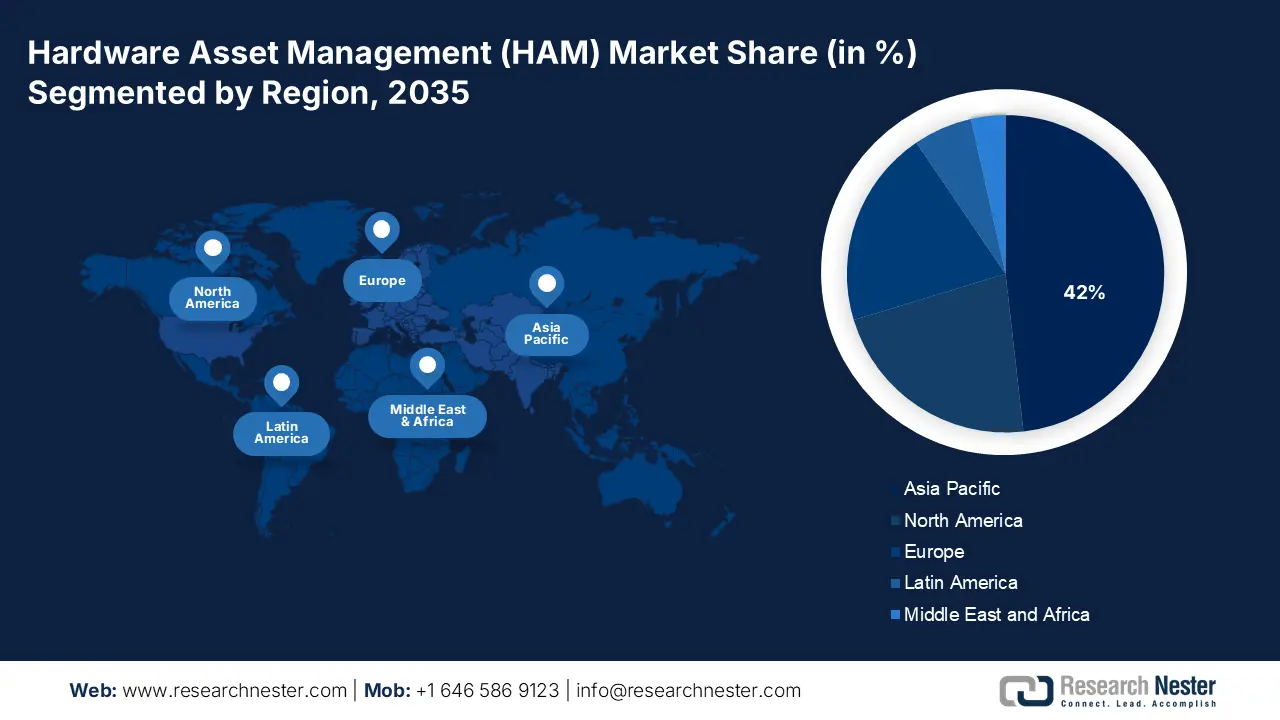
- By 2035, the Asia Pacific region is projected to command a 42% share of the hardware asset management (HAM) market, attributed to the rapid adoption of IoT technologies.
- By 2035, North America is anticipated to secure the second-largest share, supported by the region’s emphasis on stringent regulatory compliance.
Segment Insights:
- By 2035, the software segment in the hardware asset management (HAM) market is expected to account for 61% of the share, fueled by its growing integration with ITSM platforms.
- By 2035, the BFSI segment is set to capture a significant share, strengthened by the need to adhere to strict regulatory compliance standards.
Key Growth Trends:
- Increasing Adoption of Cloud Computing
- Surge in Remote Work and Endpoint Devices
Major Challenges:
- Dynamic IT Environments
- Software Hardware Dependencies
Key Players: HP Inc. (Hewlett-Packard Company), Microsoft Corporation, Dell Technologies Inc., ServiceNow, Inc., Symantec Corporation, SolarWinds Worldwide, LLC.
Global Hardware Asset Management (HAM) Market Forecast and Regional Outlook:
Market Size & Growth Projections:
- 2025 Market Size: USD 32.67 billion
- 2026 Market Size: USD 36.08 billion
- Projected Market Size: USD 97.9 billion by 2035
- Growth Forecasts: 11.6%
Key Regional Dynamics:
- Largest Region: Asia Pacific (42% Share by 2035)
- Fastest Growing Region: Asia Pacific
- Dominating Countries: United States, China, Japan, Germany, United Kingdom
- Emerging Countries: India, Brazil, South Korea, United Arab Emirates, Indonesia
Last updated on : 27 November, 2025
Hardware Asset Management (HAM) Market - Growth Drivers and Challenges
Growth Drivers
- Increasing Adoption of Cloud Computing: The proliferation of cloud computing has revolutionized how organizations manage their IT infrastructure. As businesses migrate to cloud-based services, the demand for Hardware Asset Management (HAM) solutions has surged. Cloud environments require meticulous monitoring and management of hardware assets to ensure optimal performance, resource utilization, and cost efficiency. HAM solutions play a crucial role in providing visibility into cloud-based hardware assets, facilitating organizations in maintaining control and optimizing their cloud infrastructure. A study revealed that 93% of enterprises have a multi-cloud strategy, indicating the pervasive adoption of cloud computing in the business landscape.
- Surge in Remote Work and Endpoint Devices: The global shift toward remote work has accelerated the deployment of endpoint devices, including laptops, tablets, and mobile devices. Managing these distributed hardware assets becomes a complex challenge for organizations. Hardware Asset Management solutions are instrumental in tracking and securing endpoint devices, ensuring compliance, and optimizing asset usage. The surge in remote work has underscored the critical need for robust HAM solutions to maintain visibility and control over dispersed hardware assets.
- Integration with IT Service Management (ITSM) Platforms: The integration of Hardware Asset Management with IT Service Management platforms has become imperative for organizations seeking a holistic approach to IT management. This integration streamlines processes, enhances efficiency, and provides a unified view of both hardware and service assets. As organizations recognize the value of a seamless ITSM and HAM integration, the demand for solutions offering interoperability and collaboration continues to grow.
Challenges
- Dynamic IT Environments: The rapid pace of technological advancements leads to dynamic IT environments with constant updates, new hardware introductions, and evolving infrastructure. This dynamism makes it challenging for organizations to maintain an accurate and up-to-date inventory of hardware assets. In large and complex IT environments, ensuring comprehensive visibility into all hardware assets is a significant challenge. Devices may be overlooked, leading to incomplete asset inventories, which, in turn, hinders effective management and decision-making. Achieving and maintaining accurate and reliable data about hardware assets can be challenging.
- Software-Hardware Dependencies
- Compliance Complexity
Hardware Asset Management (HAM) Market Size and Forecast:
| Report Attribute | Details |
|---|---|
|
Base Year |
2025 |
|
Forecast Year |
2026-2035 |
|
CAGR |
11.6% |
|
Base Year Market Size (2025) |
USD 32.67 billion |
|
Forecast Year Market Size (2035) |
USD 97.9 billion |
|
Regional Scope |
|
Hardware Asset Management (HAM) Market Segmentation:
Type Segment Analysis
The software segment in the hardware asset management market is estimated to gain the largest revenue share of 61% in the year 2035. The integration of Hardware Asset Management software with IT Service Management (ITSM) platforms is a pivotal growth driver. This integration streamlines processes, enhances efficiency, and provides organizations with a unified view of both hardware and service assets. As businesses prioritize seamless IT operations, the demand for solutions offering interoperability between HAM and ITSM continues to grow. The proliferation of cloud computing has significantly impacted the software segment of Hardware Asset Management. Cloud-based HAM solutions offer scalability, accessibility, and real-time collaboration, aligning with the evolving needs of modern enterprises. As organizations continue to migrate their IT infrastructure to the cloud, the demand for cloud-based HAM software is on the rise. According to a study, 93% of enterprises have a multi-cloud strategy.
End User Segment Analysis
The BFSI segment in the hardware asset management market is expected to garner a significant share in the year 2035. The BFSI sector operates in a highly regulated environment, with stringent data protection and financial compliance standards. The need for compliance with regulations such as GDPR, PCI DSS, and SOX necessitates robust HAM solutions. These solutions provide the capability to track and manage hardware assets securely, ensuring adherence to regulatory requirements. The BFSI sector is a prime target for cyber threats due to the sensitive nature of financial data. As the frequency and sophistication of cyber-attacks increase, the BFSI industry prioritizes robust cybersecurity measures, including effective HAM. HAM solutions contribute to securing hardware assets, minimizing vulnerabilities, and safeguarding critical financial information. The BFSI sector is undergoing significant digital transformation to enhance customer experiences and operational efficiency.
Our in-depth analysis of the global hardware asset management market includes the following segments:
|
Type |
|
|
End User |
|
|
Enterprise Size |
|
|
Deployment Model |
|

Vishnu Nair
Head - Global Business DevelopmentCustomize this report to your requirements — connect with our consultant for personalized insights and options.
Hardware Asset Management (HAM) Market - Regional Analysis
APAC Market Insights
The hardware asset management market in the Asia Pacific industry is poised to dominate majority revenue share of 42% by 2035. The Asia Pacific region is a key player in the adoption of Internet of Things (IoT) technologies across various industries. Managing the diverse array of connected devices requires specialized HAM solutions capable of handling the unique challenges posed by IoT deployments. According to a report, the number of connected IoT devices in the Asia Pacific region is expected to reach 11.3 billion by 2030. Environmental sustainability is gaining prominence in the Asia Pacific region, and organizations are increasingly adopting green IT practices. HAM solutions contribute to sustainability efforts by facilitating responsible disposal, recycling, and reducing electronic waste (e-waste) in hardware asset management. The Asia Pacific region has witnessed an increase in cyber threats, prompting organizations to prioritize cybersecurity measures.
North American Market Insights
The hardware asset management market in the North America region is projected to hold the second largest share during the forecast period. North America operates in a regulatory landscape that emphasizes data protection and cybersecurity. The need to comply with standards such as GDPR, HIPAA, and SOX places a significant burden on organizations to manage and secure their hardware assets. HAM solutions offer a systematic approach to ensure compliance, leading to increased adoption. The prevalence of cybersecurity threats in North America has intensified the focus on securing IT infrastructure, including hardware assets. HAM solutions contribute by providing visibility into the hardware landscape, aiding in vulnerability assessments, and enhancing overall cybersecurity posture. The shift towards remote work, accelerated by global events, has reshaped the way organizations manage their hardware assets. HAM solutions are crucial in tracking and securing dispersed hardware assets, ensuring compliance, and optimizing resource usage in the context of the widespread adoption of remote work. North American organizations are increasingly migrating their IT infrastructure to the cloud, seeking scalability, flexibility, and cost-efficiency.
Hardware Asset Management (HAM) Market Players:
- IBM
- Company Overview
- Business Strategy
- Key Product Offerings
- Financial Performance
- Key Performance Indicators
- Risk Analysis
- Recent Development
- Regional Presence
- SWOT Analysis
- HP Inc. (Hewlett-Packard Company)
- Microsoft Corporation
- Dell Technologies Inc.
- ServiceNow, Inc.
- Symantec Corporation
- SolarWinds Worldwide, LLC
- BMC Software, Inc.
- Flexera
- Ivanti, Inc.
Recent Developments
- This major acquisition, expected to close later in 2024, expands IBM's portfolio in urology and bowel dysfunction treatment with differentiated devices from Axonics.
- This partnership combines IBM's expertise in software and cloud computing with Qualcomm's edge computing technologies to develop and offer comprehensive solutions for various industries.
- Report ID: 5720
- Published Date: Nov 27, 2025
- Report Format: PDF, PPT
- Explore a preview of key market trends and insights
- Review sample data tables and segment breakdowns
- Experience the quality of our visual data representations
- Evaluate our report structure and research methodology
- Get a glimpse of competitive landscape analysis
- Understand how regional forecasts are presented
- Assess the depth of company profiling and benchmarking
- Preview how actionable insights can support your strategy
Explore real data and analysis
Frequently Asked Questions (FAQ)
About this Report
Connect with our Expert

Report, 2026-2035


Copyright @ 2026 Research Nester. All Rights Reserved.
