Global Smart Electric Toothbrush Market
- An Outline of the Global Smart Electric Toothbrush Market
- Market Definition and Segmentation
- Study Assumptions and Abbreviations
- Research Methodology & Approach
- Primary Research
- Secondary Research
- Data Triangulation
- SPSS Methodology
- Executive Summary
- Growth Drivers
- Major Roadblocks
- Opportunities
- Prevalent Trends
- Government Regulation
- Growth Outlook
- Competitive White Space Analysis – Identifying Untapped Market Gaps
- Risk Overview
- SWOT
- Technological Advancement
- Technology Maturity Matrix for Smart Electric Toothbrush Market Recent News
- Regional Demand
- Global Smart Electric Toothbrush by Geography – Strategic Comparative Analysis
- Strategic Segment Analysis: Smart Electric Toothbrush Demand Landscape
- Smart Electric Toothbrush Demand Trends Driven by a combination of health awareness, technology adoption, and evolving consumer lifestyles (2026-2036)
- Root Cause Analysis (RCA) for discovering problems of the Smart Electric Toothbrush Market
- Porter Five Forces
- PESTLE
- Comparative Positioning
- Global Smart Electric Toothbrush – Key Player Analysis (2036)
- Competitive Landscape: Key Suppliers/Players
- Competitive Model: A Detailed Inside View for Investors
- Company Market Share, 2036 (%)
- Procter & Gamble Co. (U.S.)
- Koninklijke Philips N.V. (Netherlands)
- Colgate-Palmolive Company (U.S.)
- Church & Dwight Co., Inc. (U.S.)
- Xiaomi Corporation (China)
- FOREO (Sweden)
- Quip (U.S.)
- Burst Oral Care (U.S.)
- Oclean (China)
- Fairywill (China)
- Global Smart Electric Toothbrush Market Outlook
- Market Overview
- Market Revenue by Value (USD Billion), Volume (Thousand Units), and Compound Annual Growth Rate (CAGR)
- Smart Electric Toothbrush Market Segmentation Analysis (2026-2036)
- By Product Type
- Battery Powered, Market Value (USD Billion), and CAGR, 2026-2036F
- Rechargeable, Market Value (USD Billion), and CAGR, 2026-2036F
- By Price Range
- Premium, Market Value (USD Billion), and CAGR, 2026- 2036F
- Mid-Range, Market Value (USD Billion), and CAGR, 2026- 2036F
- Budget, Market Value (USD Billion), and CAGR, 2026- 2036F
- By Technology
- Vibrational, Market Value (USD Billion), and CAGR, 2026- 2036F
- Rotational, Market Value (USD Billion), and CAGR, 2026- 2036F
- Others, Market Value (USD Billion), and CAGR, 2026- 2036F
- By Distribution Channel
- Online, Market Value (USD Billion), and CAGR, 2026- 2036F
- E-commerce, Market Value (USD Billion), and CAGR, 2026- 2036F
- Company-owned Website, Market Value (USD Billion), and CAGR, 2026- 2036F
- Offline, Market Value (USD Billion), and CAGR, 2026- 2036F
- Supermarkets & Pharmacies, Market Value (USD Billion), and CAGR, 2026- 2036F
- Specialty Stores, Market Value (USD Billion), and CAGR, 2026- 2036F
- Online, Market Value (USD Billion), and CAGR, 2026- 2036F
- By End user
- Adults, Market Value (USD Billion), and CAGR, 2026- 2036F
- Children, Market Value (USD Billion), and CAGR, 2026- 2036F
- Seniors, Market Value (USD Billion), and CAGR, 2026- 2036F
- Regional Synopsis, Value (USD Billion), 2026-2036
- North America Market Value (USD Billion) and CAGR & Y-o-Y Growth Trend, 2026-2036F
- Europe Market Value (USD Billion) and CAGR & Y-o-Y Growth Trend, 2026-2036F
- Asia Pacific Market Value (USD Billion) and CAGR & Y-o-Y Growth Trend, 2026-2036F
- Latin America Market Value (USD Billion) and CAGR & Y-o-Y Growth Trend, 2026-2036F
- Middle East and Africa Market Value (USD Billion) and CAGR & Y-o-Y Growth Trend, 2026-2036F
- By Product Type
- Market Overview
- North America Market
- Overview
- Market Value (USD Billion), Current and Future Projections, 2026-2036
- Increment $ Opportunity Assessment, 2026-2036
- Segmentation (USD Billion), 2026-2036, By
- By Product Type
- Battery Powered, Market Value (USD Billion), and CAGR, 2026-2036F
- Rechargeable, Market Value (USD Billion), and CAGR, 2026-2036F
- By Price Range
- Premium, Market Value (USD Billion), and CAGR, 2026- 2036F
- Mid-Range, Market Value (USD Billion), and CAGR, 2026- 2036F
- Budget, Market Value (USD Billion), and CAGR, 2026- 2036F
- By Technology
- Vibrational, Market Value (USD Billion), and CAGR, 2026- 2036F
- Rotational, Market Value (USD Billion), and CAGR, 2026- 2036F
- Others, Market Value (USD Billion), and CAGR, 2026- 2036F
- By Distribution Channel
- Online, Market Value (USD Billion), and CAGR, 2026- 2036F
- E-commerce, Market Value (USD Billion), and CAGR, 2026- 2036F
- Company-owned Website, Market Value (USD Billion), and CAGR, 2026- 2036F
- Offline, Market Value (USD Billion), and CAGR, 2026- 2036F
- Supermarkets & Pharmacies, Market Value (USD Billion), and CAGR, 2026- 2036F
- Specialty Stores, Market Value (USD Billion), and CAGR, 2026- 2036F
- Online, Market Value (USD Billion), and CAGR, 2026- 2036F
- By End user
- Adults, Market Value (USD Billion), and CAGR, 2026- 2036F
- Children, Market Value (USD Billion), and CAGR, 2026- 2036F
- Seniors, Market Value (USD Billion), and CAGR, 2026- 2036F
- Country Level Analysis, Value (USD Billion)
- U.S. Market Value (USD Billion) and CAGR & Y-o-Y Growth Trend, 2026-2036F
- Canada Market Value (USD Billion) and CAGR & Y-o-Y Growth Trend, 2026-2036F
- By Product Type
- Overview
- Europe Market
- Overview
- Market Value (USD Billion), Current and Future Projections, 2026-2036
- Increment $ Opportunity Assessment, 2026-2036
- Segmentation (USD Billion), 2026-2036, By
- By Product Type
- Battery Powered, Market Value (USD Billion), and CAGR, 2026-2036F
- Rechargeable, Market Value (USD Billion), and CAGR, 2026-2036F
- By Price Range
- Premium, Market Value (USD Billion), and CAGR, 2026- 2036F
- Mid-Range, Market Value (USD Billion), and CAGR, 2026- 2036F
- Budget, Market Value (USD Billion), and CAGR, 2026- 2036F
- By Technology
- Vibrational, Market Value (USD Billion), and CAGR, 2026- 2036F
- Rotational, Market Value (USD Billion), and CAGR, 2026- 2036F
- Others, Market Value (USD Billion), and CAGR, 2026- 2036F
- By Distribution Channel
- Online, Market Value (USD Billion), and CAGR, 2026- 2036F
- E-commerce, Market Value (USD Billion), and CAGR, 2026- 2036F
- Company-owned Website, Market Value (USD Billion), and CAGR, 2026- 2036F
- Offline, Market Value (USD Billion), and CAGR, 2026- 2036F
- Supermarkets & Pharmacies, Market Value (USD Billion), and CAGR, 2026- 2036F
- Specialty Stores, Market Value (USD Billion), and CAGR, 2026- 2036F
- Online, Market Value (USD Billion), and CAGR, 2026- 2036F
- By End user
- Adults, Market Value (USD Billion), and CAGR, 2026- 2036F
- Children, Market Value (USD Billion), and CAGR, 2026- 2036F
- Seniors, Market Value (USD Billion), and CAGR, 2026- 2036F
- Country Level Analysis, Value (USD Billion)
- UK Market Value (USD Billion) and CAGR & Y-o-Y Growth Trend, 2026-2036F
- Germany Market Value (USD Billion) and CAGR & Y-o-Y Growth Trend, 2026-2036F
- France Market Value (USD Billion) and CAGR & Y-o-Y Growth Trend, 2026-2036F
- Italy Market Value (USD Billion) and CAGR & Y-o-Y Growth Trend, 2026-2036F
- Spain Market Value (USD Billion) and CAGR & Y-o-Y Growth Trend, 2026-2036F
- Netherlands Market Value (USD Billion) and CAGR & Y-o-Y Growth Trend, 2026-2036F
- Russia Market Value (USD Billion) and CAGR & Y-o-Y Growth Trend, 2026-2036F
- Switzerland Market Value (USD Billion) and CAGR & Y-o-Y Growth Trend, 2026-2036F
- Poland Market Value (USD Billion) and CAGR & Y-o-Y Growth Trend, 2026-2036F
- Belgium Market Value (USD Billion) and CAGR & Y-o-Y Growth Trend, 2026-2036F
- Rest of Europe Market Value (USD Billion) and CAGR & Y-o-Y Growth Trend, 2026-2036F
- By Product Type
- Overview
- Asia Pacific Market
- Overview
- Market Value (USD Billion), Current and Future Projections, 2026-2036
- Increment $ Opportunity Assessment, 2026-2036
- Segmentation (USD Billion), 2026-2036, By
- By Product Type
- Battery Powered, Market Value (USD Billion), and CAGR, 2026-2036F
- Rechargeable, Market Value (USD Billion), and CAGR, 2026-2036F
- By Price Range
- Premium, Market Value (USD Billion), and CAGR, 2026- 2036F
- Mid-Range, Market Value (USD Billion), and CAGR, 2026- 2036F
- Budget, Market Value (USD Billion), and CAGR, 2026- 2036F
- By Technology
- Vibrational, Market Value (USD Billion), and CAGR, 2026- 2036F
- Rotational, Market Value (USD Billion), and CAGR, 2026- 2036F
- Others, Market Value (USD Billion), and CAGR, 2026- 2036F
- By Distribution Channel
- Online, Market Value (USD Billion), and CAGR, 2026- 2036F
- E-commerce, Market Value (USD Billion), and CAGR, 2026- 2036F
- Company-owned Website, Market Value (USD Billion), and CAGR, 2026- 2036F
- Offline, Market Value (USD Billion), and CAGR, 2026- 2036F
- Supermarkets & Pharmacies, Market Value (USD Billion), and CAGR, 2026- 2036F
- Specialty Stores, Market Value (USD Billion), and CAGR, 2026- 2036F
- Online, Market Value (USD Billion), and CAGR, 2026- 2036F
- By End user
- Adults, Market Value (USD Billion), and CAGR, 2026- 2036F
- Children, Market Value (USD Billion), and CAGR, 2026- 2036F
- Seniors, Market Value (USD Billion), and CAGR, 2026- 2036F
- By Product Type
- Overview
- Latin America Market
- Overview
- Market Value (USD Billion), Current and Future Projections, 2026-2036
- Increment $ Opportunity Assessment, 2026-2036
- Year-on-Year Growth Forecast (%)
- Segmentation (USD Billion), 2026-2036, By
- By Product Type
- Battery Powered, Market Value (USD Billion), and CAGR, 2026-2036F
- Rechargeable, Market Value (USD Billion), and CAGR, 2026-2036F
- By Price Range
- Premium, Market Value (USD Billion), and CAGR, 2026- 2036F
- Mid-Range, Market Value (USD Billion), and CAGR, 2026- 2036F
- Budget, Market Value (USD Billion), and CAGR, 2026- 2036F
- By Technology
- Vibrational, Market Value (USD Billion), and CAGR, 2026- 2036F
- Rotational, Market Value (USD Billion), and CAGR, 2026- 2036F
- Others, Market Value (USD Billion), and CAGR, 2026- 2036F
- By Distribution Channel
- Online, Market Value (USD Billion), and CAGR, 2026- 2036F
- E-commerce, Market Value (USD Billion), and CAGR, 2026- 2036F
- Company-owned Website, Market Value (USD Billion), and CAGR, 2026- 2036F
- Offline, Market Value (USD Billion), and CAGR, 2026- 2036F
- Supermarkets & Pharmacies, Market Value (USD Billion), and CAGR, 2026- 2036F
- Specialty Stores, Market Value (USD Billion), and CAGR, 2026- 2036F
- Online, Market Value (USD Billion), and CAGR, 2026- 2036F
- By End user
- Adults, Market Value (USD Billion), and CAGR, 2026- 2036F
- Children, Market Value (USD Billion), and CAGR, 2026- 2036F
- Seniors, Market Value (USD Billion), and CAGR, 2026- 2036F
- Country Level Analysis, Value (USD Billion)
- Brazil Market Value (USD Billion) and CAGR & Y-o-Y Growth Trend, 2026-2036F
- Argentina Market Value (USD Billion) and CAGR & Y-o-Y Growth Trend, 2026-2036F
- Mexico Market Value (USD Billion) and CAGR & Y-o-Y Growth Trend, 2026-2036F
- Rest of Latin America Market Value (USD Billion) and CAGR & Y-o-Y Growth Trend, 2026-2036F
- By Product Type
- Overview
- Middle East & Africa Market
- Overview
- Market Value (USD Billion), Current and Future Projections, 2026-2036
- Increment $ Opportunity Assessment, 2026-2036
- Year-on-Year Growth Forecast (%)
- Segmentation (USD Billion), 2026-2036, By
- By Product Type
- Battery Powered, Market Value (USD Billion), and CAGR, 2026-2036F
- Rechargeable, Market Value (USD Billion), and CAGR, 2026-2036F
- By Price Range
- Premium, Market Value (USD Billion), and CAGR, 2026- 2036F
- Mid-Range, Market Value (USD Billion), and CAGR, 2026- 2036F
- Budget, Market Value (USD Billion), and CAGR, 2026- 2036F
- By Technology
- Vibrational, Market Value (USD Billion), and CAGR, 2026- 2036F
- Rotational, Market Value (USD Billion), and CAGR, 2026- 2036F
- Others, Market Value (USD Billion), and CAGR, 2026- 2036F
- By Distribution Channel
- Online, Market Value (USD Billion), and CAGR, 2026- 2036F
- E-commerce, Market Value (USD Billion), and CAGR, 2026- 2036F
- Company-owned Website, Market Value (USD Billion), and CAGR, 2026- 2036F
- Offline, Market Value (USD Billion), and CAGR, 2026- 2036F
- Supermarkets & Pharmacies, Market Value (USD Billion), and CAGR, 2026- 2036F
- Specialty Stores, Market Value (USD Billion), and CAGR, 2026- 2036F
- Online, Market Value (USD Billion), and CAGR, 2026- 2036F
- By End user
- Adults, Market Value (USD Billion), and CAGR, 2026- 2036F
- Children, Market Value (USD Billion), and CAGR, 2026- 2036F
- Seniors, Market Value (USD Billion), and CAGR, 2026- 2036F
- Country Level Analysis, Value (USD Billion)
- Saudi Arabia Market Value (USD Billion) and CAGR & Y-o-Y Growth Trend, 2026-2036F
- UAE Market Value (USD Billion) and CAGR & Y-o-Y Growth Trend, 2026-2036F
- Israel Market Value (USD Billion) and CAGR & Y-o-Y Growth Trend, 2026-2036F
- Qatar Market Value (USD Billion) and CAGR & Y-o-Y Growth Trend, 2026-2036F
- Kuwait Market Value (USD Billion) and CAGR & Y-o-Y Growth Trend, 2026-2036F
- Oman Market Value (USD Billion) and CAGR & Y-o-Y Growth Trend, 2026-2036F
- South Africa Market Value (USD Billion) and CAGR & Y-o-Y Growth Trend, 2026-2036F
- Rest of Middle East & Africa Market Value (USD Billion) and CAGR & Y-o-Y Growth Trend, 2026-2036F
- By Product Type
- Overview
- Global Economic Scenario
- World Economic Outlook
- About Research Nester
- Our Global Clientele
- We Serve Clients Across World
Smart Electric Toothbrush Market Outlook:
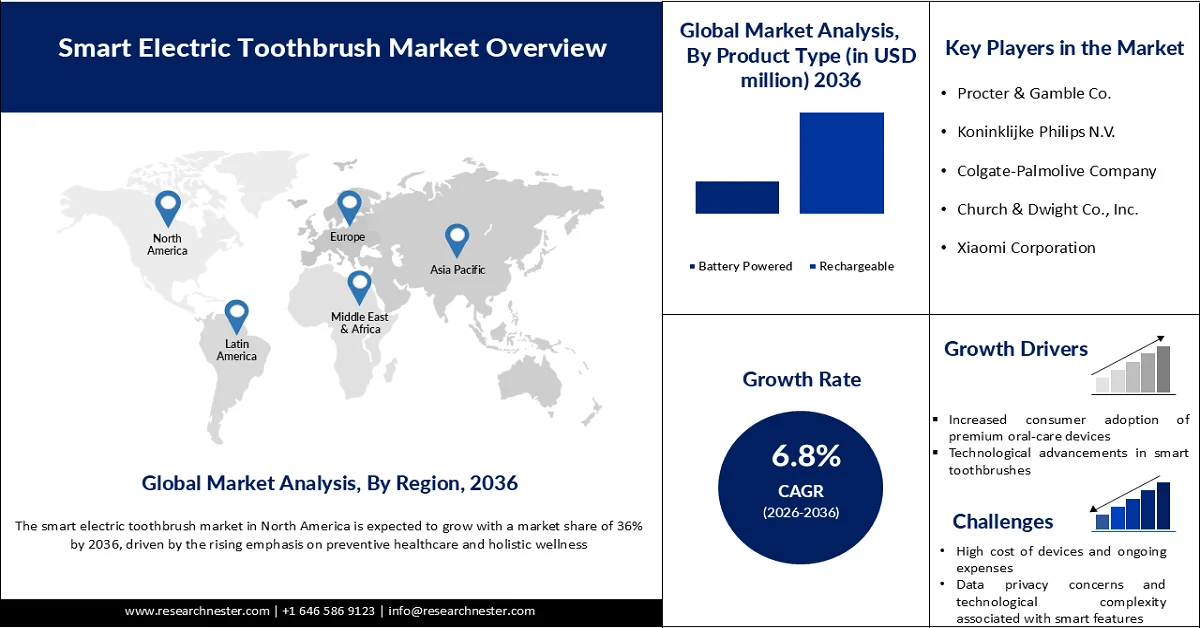
Smart Electric Toothbrush Market is valued at USD 4.01 billion in 2025 and is projected to reach USD 8.27 billion by 2036, growing at a CAGR of 6.8% during the forecast period, i.e., 2026-2036. In 2026, the industry size of smart electric toothbrush is assessed at USD 4.26 billion.
The global smart electric toothbrush market is experiencing consistent growth, driven by rising awareness of oral hygiene and increasing consumer preference for advanced personal care devices. The adoption of smart features such as Bluetooth connectivity, real-time feedback, and mobile app integration is transforming traditional brushing into a more personalized and efficient experience. Growing concerns about dental issues like plaque buildup and gum disease are encouraging a shift from manual to electric toothbrushes. Adults represent the largest user segment, though demand among children is steadily increasing, supported by rising parental awareness and product innovation. Technological advancements, including AI-based tracking and pressure sensors, are further enhancing product appeal and user engagement.
According to the World Health Organization (WHO), oral diseases affect nearly 3.7 billion people worldwide as of 2025, underscoring the widespread need for improved oral care practices and stronger hygiene awareness. Data from the Centers for Disease Control and Prevention indicates that over 90% of adults have experienced cavities, based on estimates published in 2024, highlighting the persistent prevalence of dental issues and the need for more effective oral hygiene solutions. The CDC also reports that 64.8% of adults visit a dentist annually, based on 2020 data and reported in 2024, reflecting a growing level of consumer engagement with preventive oral healthcare. Together, these statistics reinforce a clear shift toward increased awareness, proactive dental care, and the rising adoption of advanced oral hygiene tools.
Key Smart Electric Toothbrush Market Insights Summary:
Regional Highlights:
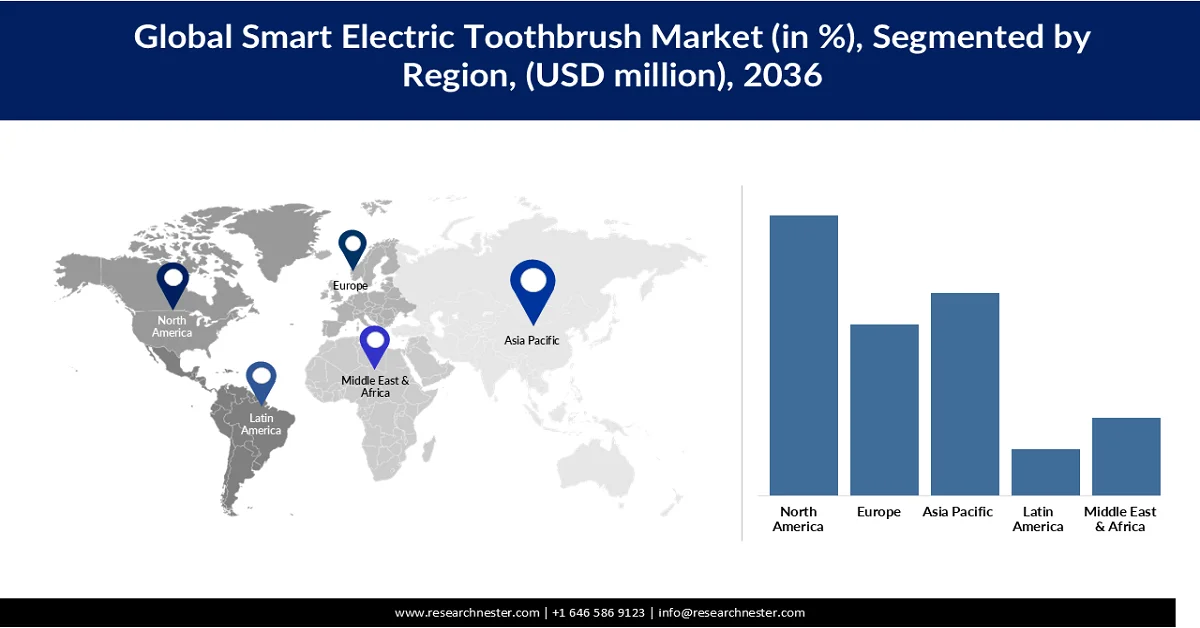
- North America smart electric toothbrush market is projected to capture a 36% share by 2036, supported by strong adoption of preventive oral care practices and high consumer spending on advanced personal care devices
- Asia Pacific is anticipated to emerge as the fastest-growing region over the forecast period to 2036, propelled by rapid urbanization, rising disposable incomes, and expanding access to affordable smart oral care solutions
Segment Insights:
- In the smart electric toothbrush market, the rechargeable segment is expected to account for a 75% share during 2026-2036, fueled by growing demand for technologically advanced, durable, and personalized oral care devices
- The mid-range segment is forecast to hold a 54.3% share by 2036, supported by increasing consumer preference for cost-effective products offering a balance between essential smart features and affordability
Key Growth Trends:
- Increased consumer adoption of premium oral-care devices
- Technological advancements in smart toothbrushes
Major Challenges:
- High cost of devices and ongoing expenses
- Data privacy concerns and technological complexity associated with smart features
Key Players: Procter & Gamble Co. (U.S.), Koninklijke Philips N.V. (Netherlands), Colgate-Palmolive Company (U.S.), Church & Dwight Co., Inc. (U.S.), Xiaomi Corporation (China), FOREO (Sweden), Quip (U.S.), Burst Oral Care (U.S.), Oclean (China), Fairywill (China).
Global Smart Electric Toothbrush Market Forecast and Regional Outlook:
Market Size & Growth Projections:
- 2025 Market Size: USD 4.01 billion
- 2026 Market Size: USD 4.26 billion
- Projected Market Size: USD 8.27 billion by 2036
- Growth Forecasts: 6.8% CAGR (2026-2036)
Key Regional Dynamics:
- Largest Region: North America (36% Share by 2036)
- Fastest Growing Region: Asia Pacific
- Dominating Countries: United States, China, Germany, Japan, United Kingdom
- Emerging Countries: India, Brazil, South Korea, Mexico, Indonesia
Last updated on : 23 April, 2026
Smart Electric Toothbrush Market - Growth Drivers and Challenges
Growth Drivers
- Increased consumer adoption of premium oral-care devices: Rising awareness of preventive dental hygiene and convenience-driven oral-care routines is significantly boosting demand for premium oral-care devices. According to the CDC, about 65.5% of U.S. adults had a dental exam or cleaning in 2023, indicating strong routine engagement with oral health practices. This reflects a growing preference for structured and consistent oral-care habits supported by advanced tools. At the same time, oral disease burden remains widespread, with the CDC noting that nearly all adults experience tooth decay at some point in their lives, underscoring the need for more effective daily care. As a result, consumers are increasingly shifting toward electric and connected toothbrushes that offer superior plaque removal compared to manual brushing. A greater emphasis on oral aesthetics and long-term preventive health benefits is also shaping the demand. In addition, awareness of reducing future dental treatment costs is encouraging the adoption of higher-quality oral-care devices at home.
- Technological advancements in smart toothbrushes: Technological advancements in smart toothbrushes are reshaping oral hygiene through sensors, connectivity, and real-time feedback systems. The National Institute of Dental and Craniofacial Research notes that smart toothbrushes can track brushing frequency and duration using embedded sensors and transmit data to users or providers. Despite their benefits, adoption is still emerging, with a 2023 study showing that over 85% of users are still unaware of smart toothbrush technology. These devices are being integrated with mobile apps that help improve brushing technique and consistency. Innovation is also expanding into AI-based coaching and gamified oral-care experiences to improve user compliance. Such technologies align with preventive oral-health strategies promoted by public health agencies. As digital health integration grows, smart toothbrushes are expected to play a larger role in personalized oral-care management.
- Rising prevalence of dental disorders: The rising prevalence of dental disorders is a major driver of demand for advanced oral-care solutions globally. CDC data shows that about 46% of children aged 2–19 and a large proportion of adults have untreated or restored dental caries. Additionally, around 20% of adults aged 65 and older suffer from untreated dental caries, highlighting a significant burden in older populations. Oral diseases such as cavities and periodontal conditions remain widespread across all age groups. CDC (2017-2020 data) also reports that 13.2% of adults aged 65+ experience complete tooth loss, indicating severe long-term outcomes of poor oral health. These conditions can lead to pain, infection, and reduced quality of life if untreated. The high prevalence of dental disorders is increasing demand for preventive tools, early intervention, and more effective oral-care devices.
Challenges
- High cost of devices and ongoing expenses: One major challenge in the smart electric toothbrush market is the high cost of devices and ongoing expenses, which limits adoption, especially in price-sensitive regions. Premium smart toothbrushes with features like Bluetooth connectivity and AI tracking can be significantly more expensive than manual alternatives, sometimes costing many times more upfront. In addition, recurring costs such as replacement brush heads and maintenance further increase the total cost of ownership. This makes it difficult for manufacturers to penetrate developing markets where affordability is a key factor, slowing overall market growth.
- Data privacy concerns and technological complexity associated with smart features: Smart toothbrushes collect user data such as brushing habits and oral health patterns, raising concerns about how this sensitive information is stored and used. Increasing regulations and fear of data breaches make consumers hesitant to adopt connected devices. At the same time, issues like app compatibility, platform fragmentation, and overly complex features can reduce user satisfaction and long-term engagement, creating barriers to widespread acceptance.
Smart Electric Toothbrush Market Size and Forecast:
| Report Attribute | Details |
|---|---|
|
Base Year |
2025 |
|
Forecast Period |
2026-2036 |
|
CAGR |
6.8% |
|
Base Year Market Size (2025) |
USD 4.01 billion |
|
Forecast Year Market Size (2036) |
USD 8.27 billion |
|
Regional Scope |
|
Smart Electric Toothbrush Market Segmentation:
Product Type Segment Analysis
The rechargeable segment is expected to hold a 75% share between 2026 and 2036, delivering superior performance, durability, and advanced functionality compared to battery-operated alternatives. These models commonly feature technologies such as Bluetooth connectivity, real-time brushing feedback, and app-based guidance, aligning with rising demand for personalized and tech-enabled oral care. Their long-term cost efficiency, despite higher initial prices, supports wider consumer adoption. Increasing awareness of oral hygiene and professional recommendations strengthens preference for rechargeable devices, which are associated with more effective cleaning. Premiumization trends and continuous innovation further accelerate growth, positioning this segment as the most dynamic within the smart electric toothbrush market.
Price Range Segment Analysis
Mid-range smart electric toothbrush market is expected to dominate the price-range segment with a market share of 54.3% by 2036, by value, as consumers increasingly gravitate toward devices that strike a balance between advanced functionality and affordability. These products commonly offer features such as pressure sensors, multiple brushing modes, and rechargeable systems, making them well-suited for mainstream adoption. Typically priced between USD 80 and USD 150, this segment represents a feature-to-price sweet spot, where users gain access to key smart capabilities without entering the premium tier. For instance, models like Philips Sonicare ProtectiveClean 5100 and Oral-B Pro 3000 are often priced around USD 80–USD 110, delivering essential smart features at accessible price points.
Further, premium smart electric toothbrushes are projected to register the fastest CAGR, supported by growing consumer interest in high-end oral care devices equipped with AI-driven brushing guidance, app connectivity, and advanced sensing technologies. Increased spending on preventive dental care and the broader shift toward connected health solutions continue to drive this trend. High-end models such as Oral-B iO Series 9 Electric Toothbrush are typically priced near USD 200, while flagship offerings like Oral-B iO10 Electric Toothbrush can reach approximately USD 320 after discounts, reflecting the segment’s premium positioning and feature-rich design.
Technology Segment Analysis
Vibrational (sonic) technology is expected to register the fastest CAGR by 2036 as consumers increasingly prefer high-frequency brushing systems that deliver deeper plaque removal and gentler gum care. Continuous innovation in smart sonic toothbrushes with app connectivity and advanced sensors further accelerates adoption. In September 2025, Koninklijke Philips N.V. expanded its Philips Sonicare portfolio in the U.S. with new Sonicare 6000 and 6400 series smart toothbrushes featuring pressure sensors, app-based brushing insights, and guided brushing tools.
Our in-depth analysis of smart electric toothbrush market includes the following segments:
|
Segments |
Subsegments |
|
Product Type |
|
|
Price Range |
|
|
Technology |
|
|
Distribution Channel |
|
|
End user |
|

Vishnu Nair
Head - Global Business DevelopmentCustomize this report to your requirements — connect with our consultant for personalized insights and options.
Smart Electric Toothbrush Market - Regional Analysis
North America Market Insights
The smart electric toothbrush market in North America is expected to hold a 36% share by 2036. The market is experiencing steady growth, supported by strong consumer awareness of preventive oral healthcare and high disposable incomes. The region accounts for a significant share of global demand and contributes heavily to incremental smart electric toothbrush market growth, with widespread adoption of premium and smart toothbrush models featuring advanced sensors and connectivity. Increasing influence of dental professionals, insurance-backed preventive care, and subscription-based replacement models further sustain market expansion. Additionally, digital health awareness and a preference for technologically advanced personal care devices continue to reinforce consistent regional growth.
The smart electric toothbrush market in the U.S. leads regional demand for smart electric toothbrushes, supported by high oral-health awareness, strong consumer spending on dental care, and widespread adoption of advanced oral-hygiene devices. Preventive dental practices and dentist recommendations continue to reinforce product uptake, particularly as the aging population expands and drives demand for effective plaque control solutions. According to the U.S. Census Bureau, the population aged 65 and older reached 61.2 million in 2024 and is projected to grow to approximately 82 million by 2050, highlighting a key demographic growth driver.
The expansion of e-commerce and direct-to-consumer (D2C) channels is further accelerating smart electric toothbrush market growth, reflecting a structural shift in consumer purchasing behavior. Online retail accounted for approximately 16.4% of total U.S. retail sales in Q3 2025, underscoring the increasing importance of digital channels. This trend is supported by North America’s mature digital infrastructure, including high internet penetration, widespread smartphone adoption, secure payment systems, and advanced logistics networks. Companies such as Oral-B and Koninklijke Philips N.V. are leveraging these platforms to directly market premium smart toothbrushes and related accessories, while enabling personalized recommendations and subscription-based services that enhance consumer engagement and repeat purchases.
The smart electric toothbrush market in Canada is witnessing the fastest growth within the region, supported by high dental-care utilization, strong public awareness of oral hygiene, and well-established preventive dental programs. Increasing emphasis on oral-health maintenance is encouraging consumers to adopt advanced brushing technologies, including smart electric toothbrushes. According to the Canadian Dental Association, nearly 7 in 10 Canadians experience gum disease at some point in their lives, a condition that often progresses without early symptoms, reinforcing the importance of consistent preventive care and effective daily oral hygiene practices.
Rising consumer focus on preventive healthcare across Canada is further accelerating the adoption of technology-enabled oral-care solutions. Higher healthcare spending of approximately USD 7,301 per capita in Canada, combined with preventive care accounting for around 6.9% of total health expenditure, well above the OECD average, highlights a strong foundation for sustained demand. As consumers increasingly prioritize routine dental hygiene and early disease prevention, the adoption of smart electric toothbrushes is expected to expand, supporting overall smart electric toothbrush market growth across North America.
Asia Pacific Market Insights
The smart electric toothbrush market in the Asia Pacific is the fastest-growing market for smart electric toothbrushes, driven by rapid urbanization, rising middle-class populations, and increasing disposable incomes. Growing awareness of oral hygiene, expanding e-commerce penetration, and the entry of global and local manufacturers offering competitively priced smart devices are accelerating adoption. Countries such as China and India are key growth engines, supported by large populations and improving access to dental care products. As affordability improves and digital adoption rises, APAC is expected to lead global smart electric toothbrush market expansion.
The smart electric toothbrush market in China is expanding steadily, supported by rising oral-health awareness, urbanization, and increasing healthcare spending. Government-backed initiatives and guidance frameworks emphasize preventive care and integration of oral health into broader public health strategies, encouraging adoption of daily hygiene practices. WHO data highlights the need for action, as oral diseases remain widespread and require stronger prevention-focused interventions. Rising income levels and improved insurance coverage are increasing dental visits and spending on oral care, supporting demand for advanced products such as smart electric toothbrushes. As younger consumers become more proactive about oral hygiene, the market continues to shift toward technology-enabled and preventive solutions.
The smart electric toothbrush market in India is expanding rapidly, supported by a substantial and ongoing burden of oral diseases and increasing awareness of preventive care. India accounts for one of the highest absolute burdens of dental caries globally in 2021, particularly in children, reflecting significant unmet oral-care needs. In addition, WHO confirms that India has implemented national oral health strategies and primary care interventions, signalling a shift toward preventive care. This combination of high disease burden and strengthening policy focus is increasing demand for effective daily oral hygiene solutions. As awareness grows and urban consumers prioritize preventive healthcare, adoption of advanced products such as smart electric toothbrushes is expected to rise steadily.
Europe Market Insights
Europe represents a mature yet steadily growing smart electric toothbrush market, driven by strong healthcare infrastructure and high consumer focus on oral hygiene. The region benefits from widespread acceptance of advanced and premium electric toothbrushes, particularly those offering customization, smart features, and eco-friendly designs. Growth is further supported by regulatory emphasis on sustainability and increasing demand for personalized oral care solutions. With a well-established dental care culture and higher disposable incomes in Western Europe, the market continues to expand at a stable pace.
The smart electric toothbrush market in the UK for smart electronic toothbrushes is growing steadily, supported by strong oral hygiene habits highlighted in the Adult Oral Health Survey 2021. Around 77% of adults brush at least twice daily, and 59% already use electric toothbrushes, showing high acceptance of powered devices. This widespread usage creates a clear pathway for consumers to upgrade to smart toothbrushes with advanced features like sensors and app connectivity. Additionally, rising awareness of oral health impacts among adults is encouraging the adoption of more effective and technology-driven cleaning solutions. As preventive dental care gains importance, demand for premium smart oral care products continues to expand across the UK.
The smart electric toothbrush market in Germany for smart electronic toothbrushes is growing steadily, driven by strong awareness of oral hygiene and a well-established dental care culture. Consumers are increasingly shifting toward premium, technology-enabled products that offer better cleaning and personalized feedback. The country’s tech-savvy population and openness to digital health solutions are accelerating the adoption of connected toothbrush devices. Additionally, regular dental visits and a preventive approach to oral care continue to support demand for advanced smart oral care products.
Key Smart Electric Toothbrush Market Players:
- Procter & Gamble Co. (U.S.)
- Koninklijke Philips N.V. (Netherlands)
- Colgate-Palmolive Company (U.S.)
- Church & Dwight Co., Inc. (U.S.)
- Xiaomi Corporation (China)
- FOREO (Sweden)
- Quip (U.S.)
- Burst Oral Care (U.S.)
- Oclean (China)
- Fairywill (China)
- Company Overview
- Business Strategy
- Key Product Offerings
- Financial Performance
- Key Performance Indicators
- Risk Analysis
- Recent Development
- Regional Presence
- SWOT Analysis
- Philips drives the smart electric toothbrush market through continuous innovation in sonic technology, AI-powered personalization, and connected oral-care ecosystems. Its Sonicare range integrates real-time feedback, app connectivity, and adaptive brushing technologies such as SenseIQ, enhancing user experience and clinical outcomes. The company is also expanding accessibility by introducing mid-range products with advanced features while maintaining premium offerings. Strong partnerships with dental professionals and a focus on preventive healthcare position Philips as a technology leader in the segment.
- Through its Oral-B brand, Procter & Gamble emphasizes clinical validation and dentist-backed innovation to strengthen its smart electric toothbrush market position. The company focuses on oscillating-rotating technology combined with AI-driven brushing guidance and smart sensors to deliver superior cleaning performance. Its strong global distribution network and aggressive marketing strategies ensure widespread product availability. Continuous product upgrades and premium positioning help maintain leadership in both developed and emerging markets.
- Colgate-Palmolive leverages its strong brand equity in oral care to expand into the smart toothbrush segment with connected and app-enabled solutions. The company focuses on affordability and accessibility, targeting mid-range consumers while integrating essential smart features. Its extensive retail presence and global reach enable rapid market penetration. Strategic emphasis on preventive care and digital engagement supports long-term growth.
- Xiaomi is driving smart electric toothbrush market expansion by offering feature-rich smart electric toothbrushes at competitive price points, particularly in Asia-Pacific markets. The company integrates app connectivity, smart displays, and long battery life to appeal to tech-savvy consumers. Its direct-to-consumer ecosystem and strong e-commerce presence enhance accessibility and adoption. By combining affordability with innovation, Xiaomi is accelerating penetration in price-sensitive segments.
- FOREO differentiates itself through design-led innovation and the use of silicone-based brush heads, focusing on hygiene and durability. The company targets premium consumers with aesthetically appealing, travel-friendly, and long-lasting devices. Its emphasis on beauty-tech positioning and digital marketing strengthens brand engagement. Continuous product innovation and niche positioning help FOREO capture a distinct share in the premium smart oral-care segment.
Below is the list of the key players operating in the global smart electronic toothbrush market:
Key players such as Procter & Gamble, Koninklijke Philips N.V., and Colgate-Palmolive Company are driving the smart electric toothbrush market through continuous innovation and product differentiation. They are integrating advanced features such as AI-powered brushing guidance, real-time feedback, app connectivity, and personalized oral-care insights to enhance user experience. Strategic investments in digital health ecosystems, along with direct-to-consumer and subscription-based models, are strengthening customer engagement and recurring revenue streams. Additionally, aggressive marketing, partnerships with dental professionals, and expansion into emerging markets are accelerating adoption and overall smart electric toothbrush market growth.
Corporate Landscape of the Global Smart Electric Toothbrush Market:
Recent Developments
- In May 2026, Philips, a global leader in oral healthcare, introduced two new Philips Sonicare electric toothbrush ranges featuring its next-generation Sonicare technology. Alongside the product launch, the company also unveiled updated branding, packaging, and sustainability initiatives aligned with its new brand platform, Feel the Care. The refreshed lineup is designed to encourage consumers to upgrade their daily oral care routines through more advanced and effective brushing technology. Overall, the launch reinforces Philips’ focus on innovation and enhancing everyday oral health experiences.
- Report ID: 2295
- Published Date: Apr 23, 2026
- Report Format: PDF, PPT
- Explore a preview of key market trends and insights
- Review sample data tables and segment breakdowns
- Experience the quality of our visual data representations
- Evaluate our report structure and research methodology
- Get a glimpse of competitive landscape analysis
- Understand how regional forecasts are presented
- Assess the depth of company profiling and benchmarking
- Preview how actionable insights can support your strategy
Explore real data and analysis
Frequently Asked Questions (FAQ)
Smart Electric Toothbrush Market Report Scope
Free Sample includes current and historical market size, growth trends, regional charts & tables, company profiles, segment-wise forecasts, and more.
Connect with our Expert


Copyright @ 2026 Research Nester. All Rights Reserved.
