Global and United States Fuel & Convenience Store POS Market TOC
- Market Definition
- Definition
- Segmentation
- Assumptions and Acronyms
- Research Methodology
- Research Process
- Primary Research
- Secondary Research
- Market Size Estimation
- Executive Summary – Global Fuel and Convenience Store POS Market
- Market Dynamics
- Market Drivers
- Market Trends
- Key Market Opportunities
- Major Roadblocks for the Market Growth
- Regulatory and Standards Landscape
- Industry Risk Analysis
- Industry Growth Outlook
- Feature Analysis
- Competitive Positioning
- Cloud Based (SaaS) vs Traditional (Non-SaaS) Cost Analysis – 2020
- Competitive Landscape
- Market Share Analysis, 2020
- Global Market Share Analysis
- United States Market Share Analysis
- Competitive Benchmarking
- Company Profiles
- Square, Inc.
- Fujitsu Limited
- Bridge SMS Retail Solutions (AM/PM Systems Inc.)
- Clover Network, Inc.
- NCR Corporation
- VeriFone, Inc.
- Gilbarco Inc.
- Oracle (MICROS)
- H&L POS
- Petrosoft LLC
- Shift4 Payments, LLC
- Market Share Analysis, 2020
- Global Fuel and Convenience Store POS Market 2020-2026
- Market Overview
- By Value (USD Million)
- By Volume (Thousand Units)
- Global Fuel and Convenience Store POS Market – Segmentation Analysis 2020-2026
- Product
- Fixed POS, 2020-2026F (USD Million) (Thousand Units)
- Mobile POS, 2020-2026F (USD Million) (Thousand Units)
- Cloud POS, 2020-2026F (USD Million) (Thousand Units)
- Deployment
- Traditional (Non-SaaS), 2020-2026F (USD Million) (Thousand Units)
- Cloud-Based (SaaS), 2020-2026F (USD Million) (Thousand Units)
- Component
- Hardware, 2020-2026F (USD Million) (Thousand Units)
- Software, 2020-2026F (USD Million) (Thousand Units)
- Services, 2020-2026F (USD Million) (Thousand Units)
- Managed Services, 2020-2026F (USD Million) (Thousand Units)
- Professional Services, 2020-2026F (USD Million) (Thousand Units)
- Application
- Inventory Management, 2020-2026F (USD Million) (Thousand Units)
- Cash Management, 2020-2026F (USD Million) (Thousand Units)
- Operations Management, 2020-2026F (USD Million) (Thousand Units)
- Reporting and Analytics, 2020-2026F (USD Million) (Thousand Units)
- Others, 2020-2026F (USD Million) (Thousand Units)
- End-Use
- Fuel Stations, 2020-2026F (USD Million) (Thousand Units)
- Convenience Stores, 2020-2026F (USD Million) (Thousand Units)
- Product
- United States Fuel and Convenience Store POS Market – Segmentation Analysis 2020-2026
- Market Overview
- By Value (USD Million)
- By Volume (Thousand Units)
- Segmentation Analysis By:
- Product
- Fixed POS, 2020-2026F (USD Million) (Thousand Units)
- Mobile POS, 2020-2026F (USD Million) (Thousand Units)
- Cloud POS, 2020-2026F (USD Million) (Thousand Units)
- Deployment
- Traditional (Non-SaaS), 2020-2026F (USD Million) (Thousand Units)
- Cloud-Based (SaaS), 2020-2026F (USD Million) (Thousand Units)
- Component
- Hardware, 2020-2026F (USD Million) (Thousand Units)
- Software, 2020-2026F (USD Million) (Thousand Units)
- Services, 2020-2026F (USD Million) (Thousand Units)
- Managed Services, 2020-2026F (USD Million) (Thousand Units)
- Professional Services, 2020-2026F (USD Million) (Thousand Units)
- Application
- Inventory Management, 2020-2026F (USD Million) (Thousand Units)
- Cash Management, 2020-2026F (USD Million) (Thousand Units)
- Operations Management, 2020-2026F (USD Million) (Thousand Units)
- Reporting and Analytics, 2020-2026F (USD Million) (Thousand Units)
- Others, 2020-2026F (USD Million) (Thousand Units)
- End-Use
- Fuel Stations, 2020-2026F (USD Million) (Thousand Units)
- Convenience Stores, 2020-2026F (USD Million) (Thousand Units)
- Product
Fuel & Convenience Store POS Market Outlook:
Fuel & Convenience Store POS Market size is valued at USD 1.4 billion in 2025 and is projected to reach a valuation of USD 10.2 billion by the end of 2035, rising at a CAGR of 22% during the forecast period, i.e., 2026-2035. In 2026, the industry size of fuel & convenience store POS is estimated at USD 1.7 billion.
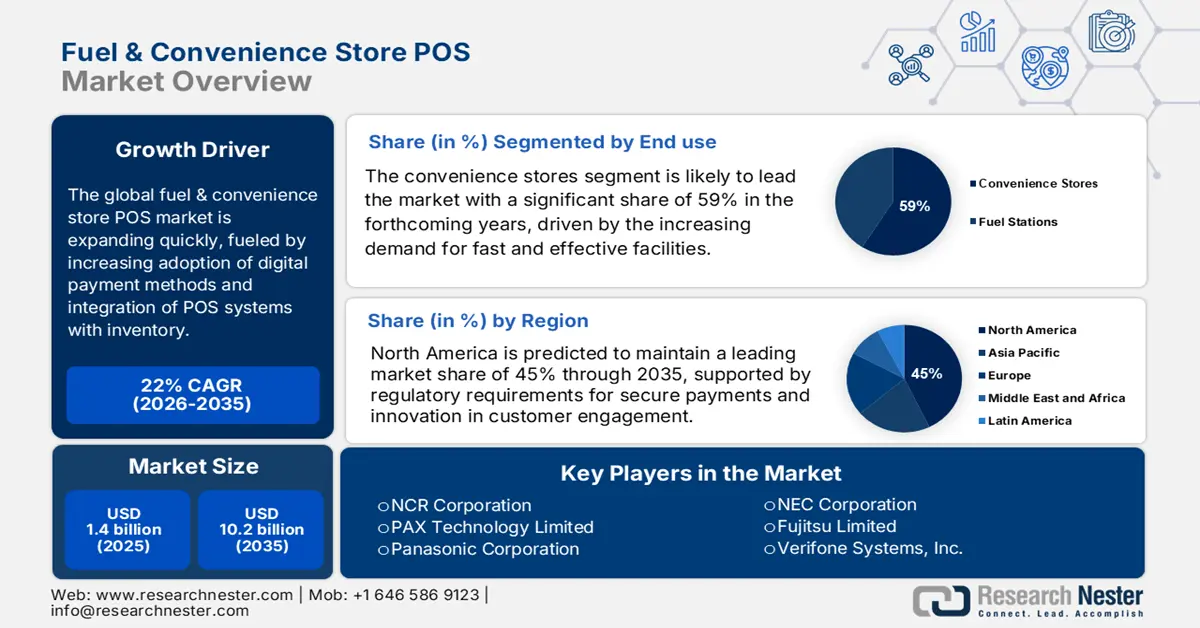
The fuel & convenience store POS market is shifting away from standalone transactional hardware to converged, cloud-based platforms that integrate the entire retail operation. The central market driver is the need for technology that converges fuel dispensing control, in-store retail sales, foodservice ordering, and inventory management into a single, unified interface. Mirroring this trend, in April 2023, Verifone launched a new suite of cloud-based solutions for fuel and convenience stores, which included the new C18 Self-Checkout POS and enhancements to its back-office services. This action demonstrates the movement throughout the industry toward integrated solutions that provide a complete view of the business.
Government regulations and buyer payment behavior also have a strong bearing on this market's direction, forcing retailers to speed up upgrades. For instance, the swift customer movement away from cash payments towards contactless payments, monitored by federal governments, is a compelling force for investment in contemporary POS terminals. In 2024, the U.S. Federal Reserve's Payments Study found that 78% of card-present transactions across the U.S. were contactless. This documented consumer behavior offers an unambiguous business rationale for retailers to implement new fixed POS hardware that supports NFC and mobile wallets, so that they can address contemporary customer demands.
Key Fuel & Convenience Store POS Market Insights Summary:
Regional Highlights:
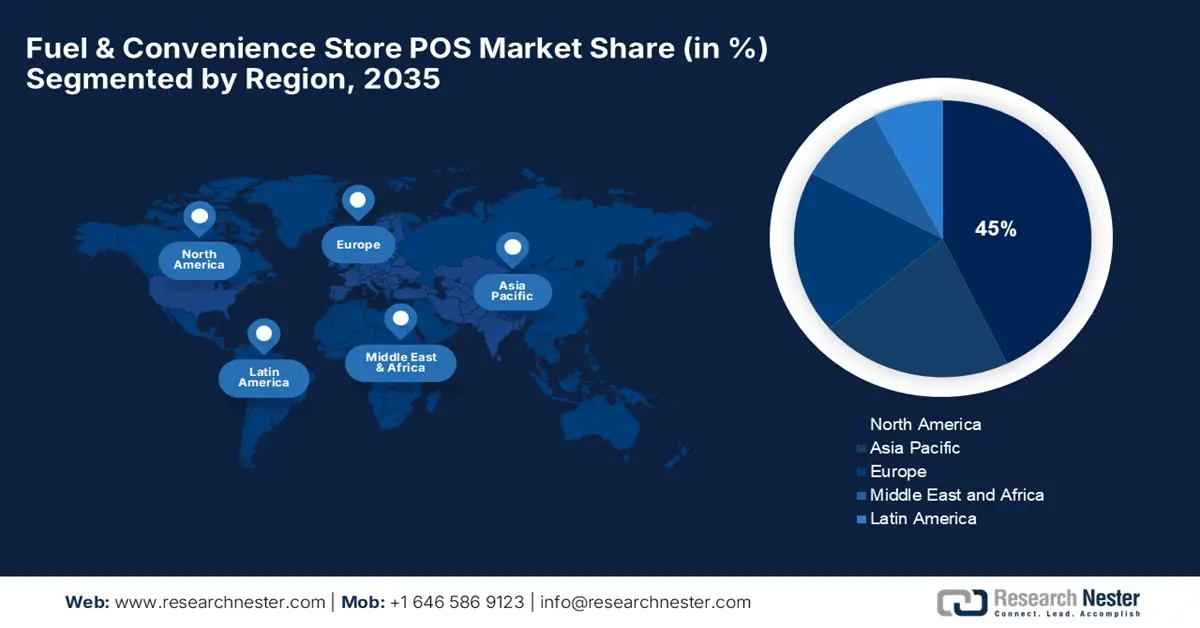
- By 2035, North America is expected to retain a 45% share of the Fuel & Convenience Store POS Market, attributed to its advanced retail infrastructure and widespread digital payment adoption.
- From 2026–2035, the Asia Pacific region is set to expand at an 18% CAGR, supported by rapid urbanization and a strong shift toward digital payments.
Segment Insights:
- By 2035, the services segment of the Fuel & Convenience Store POS Market is anticipated to hold a 60% share, propelled by retailers’ preference for outsourcing POS deployment and compliance complexities to specialized providers.
- By 2035, the inventory control segment is forecast to capture a 38% share, underpinned by the imperative for accurate, automated inventory management.
Key Growth Trends:
- Cloud-based operations management
- POS hardware and software modernization
Major Challenges:
- Data security within an interconnected ecosystem
- Integration with a dispersed technology environment
Key Players: NCR Corporation, Diebold Nixdorf Incorporated, Verifone Systems, Inc., Ingenico Group (Worldline), Oracle Corporation, PDI Technologies, PAX Technology Limited, Posiflex Technology, Inc., EPoS Systems Pty Ltd, Posibolt Solutions Pvt. Ltd., StoreHub Sdn Bhd, Samsung C&T, Toshiba Global Commerce Solutions, Fujitsu Limited, NEC Corporation.
Global Fuel & Convenience Store POS Market Forecast and Regional Outlook:
Market Size & Growth Projections:
- 2025 Market Size: USD 1.4 billion
- 2026 Market Size: USD 1.7 billion
- Projected Market Size: USD 10.2 billion by 2035
- Growth Forecasts: 22% CAGR (2026-2035)
Key Regional Dynamics:
- Largest Region: North America (45% Share by 2035)
- Fastest Growing Region: Asia Pacific
- Dominating Countries: United States, Germany, China, Japan, United Kingdom
- Emerging Countries: India, South Korea, Brazil, Australia, Mexico
Last updated on : 26 September, 2025
Fuel & Convenience Store POS Market - Growth Drivers and Challenges
Growth Drivers
- Cloud-based operations management: Retailers are now increasingly embracing cloud-based platforms instead of on-premise servers to attain remote management, real-time access to data, and easy third-party service integrations. This move is driven by the demand for more operational flexibility and scalability within a changing market. In July 2025, NCR Voyix was named the leading global supplier of self-checkout technology for 2024, reflecting strong demand for autonomous and express checkout options. Cloud migration enables retailers to add new capabilities without costly hardware refreshes, making their operations more nimble and future-ready.
- POS hardware and software modernization: A substantial hardware and software refresh cycle is currently underway, spurred by the necessity to accommodate new payment forms, improve customer experience, and increase operating efficiency. Spending is being driven by demand for faster, more dependable, and secure POS infrastructure that can support an increasing number of digital transactions. For example, Posiflex Technology launched new fixed POS terminals connected to the cloud in May 2024, aimed at strong performance in high-traffic convenience store environments. This latest hardware offers quicker processing and enhanced connectivity, allowing smooth integration with cloud-based management and analytics software.
- Emergence of integrated foodservice and loyalty programs: As convenience stores expand their foodservice businesses, they need POS systems capable of managing sophisticated menus, kitchen operations, and built-in loyalty programs to drive repeat customers. The challenge in this instance is to provide a seamless, restaurant-style experience for customers. Illustrating this movement, bp introduced a new point-of-sale system for its U.S. network in February 2024 as part of a larger technology refresh. This new platform is designed to provide a more unified customer experience by combining loyalty, payments, and operations management onto a single platform.
Payment Instrument Trends for Fuel & Convenience Store POS Market (2020-2024)
The payment data reveals a crucial shift for fuel and convenience store POS systems, with cash transactions declining from 31% to 14% while card and mobile payments dominate. Credit card usage has nearly doubled to 35%, requiring POS systems to optimize for faster card processing and enhanced security features to handle higher transaction volumes. Mobile payment adoption, though currently at 5%, represents a growing segment that demands QR code scanning and contactless payment integration at pump terminals. This evolution necessitates POS upgrades supporting omnichannel payments, loyalty program integration, and real-time inventory management to meet changing consumer preferences at fuel stations and convenience stores.
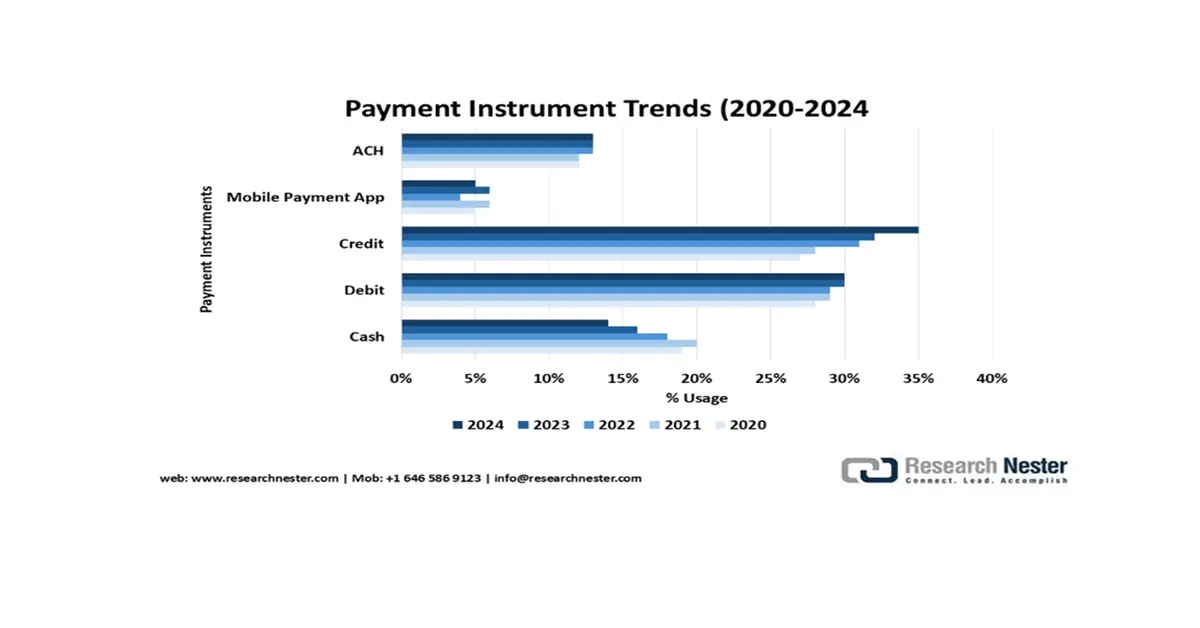
Source: Federal Reserve
Pay-by-Bank Payment Adoption: Merchant Cost Implications for POS Systems
|
Aspect |
Key Points |
Relevance to POS Merchants |
|
Cost Comparison vs. Credit Cards |
Pay-by-Bank can reduce or eliminate fees, with potential savings of 40–85% compared to credit cards. |
Merchants may reduce payment acceptance costs if integrated effectively into POS systems. |
|
Fee Considerations |
Pay-by-Bank still involves setup, integration, transaction, processor, subscription, and bank service fees. |
POS adoption requires accounting for all potential fees to evaluate net cost savings. |
|
Payment Operator Charges |
ACH and instant payment operators charge per transaction; card interchange fees are a percentage of transaction value. |
POS systems must accommodate different fee structures depending on payment type and transaction volume. |
|
Pricing Models |
Providers may offer variable pricing based on merchant usage and selected services. |
Merchants need flexible POS configurations to track and optimize for different Pay-by-Bank pricing models. |
|
Overall Insight |
Blanket claims of cost savings should be treated cautiously; savings vary by transaction type, volume, and provider. |
POS decisions should be informed by detailed analysis to ensure true cost efficiency when adopting Pay-by-Bank. |
Source: FRB
Challenges
- Data security within an interconnected ecosystem: The growing interconnectedness of POS systems, connecting them to loyalty applications, payment gateways, and cloud platforms, increases their susceptibility to cyberattacks, rendering data security an imperative. One of the key challenges is safeguarding sensitive customer and payment data within an extensive network of interconnected systems. This security imperative is fueling collaborations that seek to provide secure payment solutions. For example, Paysafe revealed a new partnership in July 2024 with a top POS software provider to embed its payment gateway directly, forming a more secure and integrated transaction space.
- Integration with a dispersed technology environment: Operators of convenience stores often have to deal with a dispersed environment of legacy hardware and software, making it challenging to adopt new, integrated solutions. A significant hurdle lies in ensuring compatibility between new Point-of-Sale (POS) systems and a wide array of existing equipment, encompassing everything from fuel dispensers to back-office software. That has driven a shift toward hardware-independent, cloud-based designs. PDI Technologies launched its new cloud-based POS system for North America in September 2023, designed to operate on existing hardware and allowing retailers to upgrade without significant capital outlays.
Fuel & Convenience Store POS Market Size and Forecast:
| Report Attribute | Details |
|---|---|
|
Base Year |
2025 |
|
Forecast Year |
2026-2035 |
|
CAGR |
22% |
|
Base Year Market Size (2025) |
USD 1.4 billion |
|
Forecast Year Market Size (2035) |
USD 10.2 billion |
|
Regional Scope |
|
Fuel & Convenience Store POS Market Segmentation:
Component Segment Analysis
The services segment, including managed services, maintenance, and support, is projected to hold 60% of the market share during the forecast period. The dominance is driven by retailers' inclination toward outsourcing the POS deployment, management, and compliance complexities to specialized third parties. Industry consolidation plays out this trend, with big providers buying service-driven businesses to provide end-to-end solutions. In a strategic move, Dover Fueling Solutions (DFS) bought Bulloch Technologies in January 2024, allowing DFS to offer a full, integrated solution consisting of hardware, software, and managed services to its North American customer base.
Application Segment Analysis
The inventory control segment is predicted to garner a 38% fuel & convenience store POS market share by 2035 as retailers increasingly value real-time visibility of stock to eliminate waste, avoid stockouts, and optimize reordering. The imperative for correct, automated control of inventory is a prime driver of spending in advanced POS software. To meet this, vendors are continually refining their platforms with increasingly advanced inventory algorithms and greater ERP integration. For instance, LS Retail released a new version of its LS Central platform in April 2024, adding more advanced features for fuel and convenience retailers, such as better inventory management algorithms and more flexible pricing and promotions functionality for more effective business analytics.
End use Segment Analysis
The convenience stores and fuel stations segment is expected to lead with a 59% fuel & convenience store POS market share through 2035 as these organizations are leading the way with integrated POS technology to drive their sophisticated businesses. The primary driver is the necessity to close the gap between the in-store and the forecourt experience, creating a smooth path for the customer. This is driven further by strategic consolidation in the market. As part of a significant transaction, Maverik's purchase of Kum & Go in August 2023 formed a larger network that requires the unification of POS systems, inventory tracking, and loyalty programs across hundreds of new stores, highlighting the importance of POS technology for large retail operations.
Our in-depth analysis of the fuel & convenience store POS market includes the following segments:
|
Segment |
Subsegments |
|
Component |
|
|
Application |
|
|
End use |
|

Vishnu Nair
Head - Global Business DevelopmentCustomize this report to your requirements — connect with our consultant for personalized insights and options.
Fuel & Convenience Store POS Market - Regional Analysis
North America Market Insights
North America is expected to maintain a 45% fuel & convenience store POS market share during the forecast period, a position underpinned by its well-developed retail infrastructure, consumer use of digital payments on a broad scale, and a competitive environment that fosters innovation. The dominance of the region is further underlined by the presence of established technology providers and innovative retail chains that push the uptake of cutting-edge POS solutions, as well as favorable government infrastructure initiatives.
The U.S. fuel & convenience store POS market is a leader in technology adoption, prioritizing customer experience and operational efficiency. A significant market driver is the government's initiative to modernize the national infrastructure for transportation and connectivity. A key policy development is the National Electric Vehicle Infrastructure (NEVI) program, which, in 2024, started allocating funds for a national EV charging network. The NEVI standards mandate all chargers to be open to accepting multiple forms of payment without membership, forcing fuel retailers to implement new, open-standards-based POS technology and to speed up the POS system modernization nationwide.
Canada market is defined by consistent growth, a clear emphasis on digital adoption, and a favorable government climate for small and medium-sized enterprises. Government funding support for companies investing in new technologies is a key growth driver. One relevant government program is the Canadian Digital Adoption Program, which in 2024 offered microgrants and zero-interest loans to SMEs. The program allows solo convenience store and gas station owners to finance upgrading their operations management software, including new cloud POS and inventory systems.
APAC Market Insights
Asia Pacific fuel and convenience store POS market is poised for significant expansion, with a notable CAGR of 18% projected from 2026 to 2035, due to fast urbanization, an expanding middle class, and an enormous shift towards digital payments. The varied and emerging economies of the region offer a huge opportunity for POS vendors who are able to offer scalable and localized offerings.
China market is determined by its mature mobile payment ecosystem and its distinctive retail environment dominated by domestic technology superpowers. The pervasive adoption of mobile wallets, like Alipay and WeChat Pay, is a primary growth catalyst, compelling retailers to integrate POS systems that offer seamless compatibility. In April 2024, MOFCOM released a three-year action plan (from 2024) to support digital commerce. This involves stimulating merchants to use digital technology and unified barcodes to enhance information systems and link critical processes with upstream and downstream business partners. These state-supported programs have been a major driver of the quick transformation of the nation's retail payments infrastructure.
India's economy is seeing rapid growth, driven by the government's visionary Digital India initiative and the mass uptake of the Unified Payments Interface (UPI). A key driver is the government initiative towards a cashless economy that has triggered widespread adoption of digital payments even among small, independent merchants. In 2023, India Government, through the National Payments Corporation of India (NPCI), remained actively promoting UPI as a national standard for digital payments. This program has forced convenience stores and gas stations in India to update their POS systems to enable payment through QR codes, revolutionizing the retail space in a fundamental way.
Europe Market Insights
Europe is expected to experience continued growth in the fuel and convenience store POS market through 2035, driven by a mature retail market, strict regulatory needs, and a high focus on secure payments. The compliance needs with sophisticated regulations on payments, data protection, and fiscal reporting are a key technology adoption driver in the region. This robust growth trajectory highlights Europe's leading role in POS innovation within the fuel and convenience sector. Businesses operating in this market will need to prioritize adaptable and secure POS solutions to thrive.
Germany is a stable market with an explicit focus on security, compliance, and operational efficiency. Strict legal requirements regarding electronic record-keeping and anti-tampering protection are significant factors driving the increase in POS upgrades across the country. In 2024, the federal government, through its fiscal authorities, continued to enforce the Kassensicherungsverordnung (KassenSichV) regulation. This legislation requires that all electronic POS solutions must be installed with a certified technical security device (TSE) to eliminate tax fraud, thus forcing an obligatory upgrade cycle for legacy fixed POS solutions.
UK market is dynamic and competitive, with a high emphasis on the customer experience and the swift adoption of new payment technologies. A crucial growth driver of the market is the active regulation of the fuel industry by the government in order to provide competitive pricing and maintain fair competition. In November 2024, the UK's Competition and Markets Authority (CMA) followed up on its investigation into the fuel retail market. Such regulatory scrutiny urges fuel retailers to commit more investment in more advanced POS and back-office technology with sophisticated reporting and analytics functionality, enabling them to improve their management of pricing and prove conformity.
Key Fuel & Convenience Store POS Market Players:
- NCR Corporation
- Company Overview
- Business Strategy
- Key Product Offerings
- Financial Performance
- Key Performance Indicators
- Risk Analysis
- Recent Development
- Regional Presence
- SWOT Analysis
- Diebold Nixdorf Incorporated
- Verifone Systems, Inc.
- Ingenico Group (Worldline)
- Oracle Corporation
- PDI Technologies
- PAX Technology Limited
- Posiflex Technology, Inc.
- EPoS Systems Pty Ltd
- Posibolt Solutions Pvt. Ltd.
- StoreHub Sdn Bhd
- Samsung C&T
- Toshiba Global Commerce Solutions
- Fujitsu Limited
- NEC Corporation
The competitive outlook for fuel and convenience store POS systems includes a combination of entrenched, specialized vendors and an increasing number of fintech and cloud software companies. Notable players are Verifone, NCR Voyix Corporation, Gilbarco Veeder-Root, Dover Fueling Solutions, PDI Technologies, LS Retail, GK Software, and Toshiba Global Commerce Solutions. The market is characterized by a competition to deliver an end-to-end, integrated platform across the business from forecourt to back office, with cloud connectivity, open APIs, and data analytics becoming more important. Strategic partnerships and acquisitions are common as players look to extend their capabilities and geographic reach.
A key trend in the competitive landscape is market consolidation in the form of mergers and acquisitions, sparked by retailers' needs for a single, integrated solution to address their complex operations. This is highlighted by the acquisition of niche POS companies by larger technology vendors. In its most significant move, PDI Technologies released its December 2023 acquisition of Comdata's merchant point-of-sale business. With the sale, including hardware, software, and transaction systems used at truck stops and commercial fuel stops, PDI's footprint in the managed services market for fuel retailers grew considerably.
Here are some leading companies in the fuel & convenience store POS market:
Recent Developments
- In June 2025, Modisoft, a provider of POS and back-office solutions, opened a new 40,000-square-foot headquarters to support its expansion. This investment in infrastructure is aimed at enhancing its professional services and development capabilities for its cloud POS, inventory management, and reporting and analytics solutions for the convenience store industry.
- In January 2025, Verifone announced the rollout of its next-generation Victa portfolio, a line of PCI 7-enabled fixed POS devices featuring Qualcomm processors and Android 14 readiness for enhanced performance in fuel and convenience stores. The launch also included Verifone Tap, a SoftPOS solution that enables NFC payments from smart devices, expanding mobile POS capabilities.
- In November 2024, ACI Worldwide's Q3 2024 earnings call revealed significant contract wins and a strong sales pipeline in the merchant segment. ACI specifically noted a significant contract with QuikTrip, a major US convenience store chain, indicating a strengthening position for its payment solutions in the fuel and convenience store market.
- Report ID: 3669
- Published Date: Sep 26, 2025
- Report Format: PDF, PPT
- Explore a preview of key market trends and insights
- Review sample data tables and segment breakdowns
- Experience the quality of our visual data representations
- Evaluate our report structure and research methodology
- Get a glimpse of competitive landscape analysis
- Understand how regional forecasts are presented
- Assess the depth of company profiling and benchmarking
- Preview how actionable insights can support your strategy
Explore real data and analysis
Frequently Asked Questions (FAQ)
Fuel & Convenience Store POS Market Report Scope
Free Sample includes current and historical market size, growth trends, regional charts & tables, company profiles, segment-wise forecasts, and more.
Connect with our Expert


Copyright @ 2026 Research Nester. All Rights Reserved.
