Food and Beverage Chemicals Market Outlook:
Food and Beverage Chemicals Market size is valued at USD 260.3 billion in 2025 and is projected to reach USD 480.8 billion by the end of 2035, rising at a CAGR of 6.7% during the forecast period, i.e., 2026-2035. In 2026, the industry size of food and beverage chemicals is estimated at USD 298.5 billion.
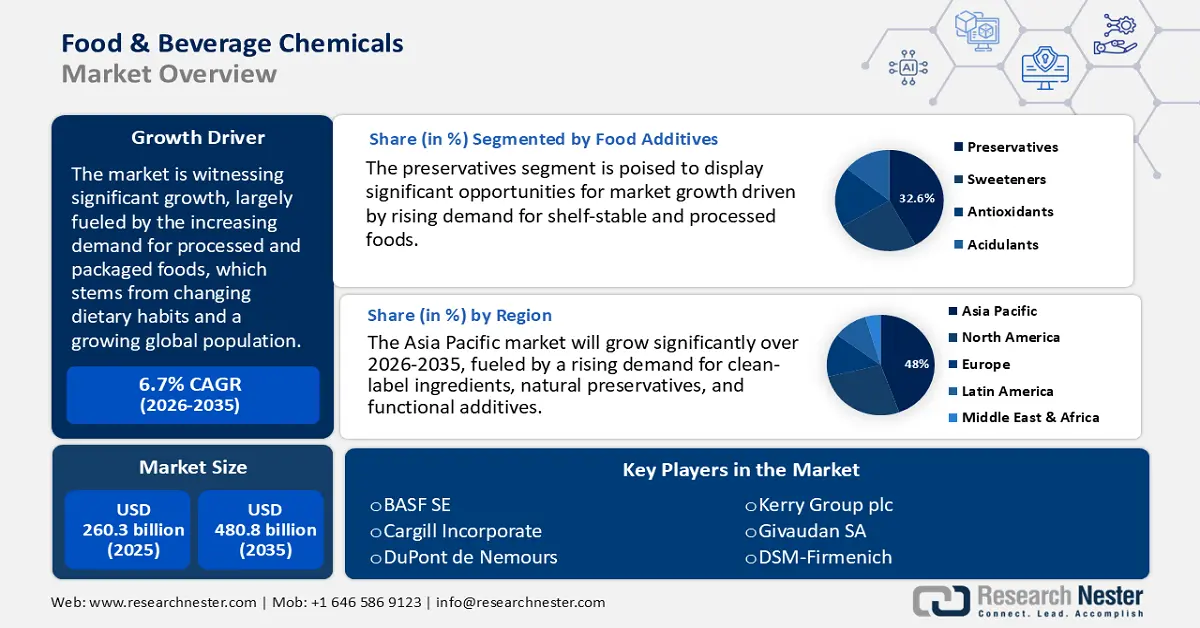
The food and beverage chemicals market is witnessing significant growth, largely fueled by the increasing demand for processed and packaged foods, which stems from changing dietary habits and a growing global population. The USDA reports a consistent rise in per capita food consumption, especially in developing regions of Asia and Africa. The FAO notes a swift increase in global food processing to cater to the needs of more urbanized communities. Government initiatives aimed at enhancing food fortification and extending shelf life, such as the U.S. FDA’s Food Safety Modernization Act (FSMA), have led to a greater reliance on preservatives, stabilizers, and flavoring agents. Additionally, advancements in food-grade chemicals are being supported by favorable fiscal policies. National Patterns projections show that in 2022 40% and 37% of fundamental research is sponsored by the federal government and corporations, respectively, underscoring the critical role of chemical applications in contemporary food production.
The supply chain sector is experiencing a strategic transformation characterized by a rise in international trade and an expansion of domestic capacity. As per the U.S. International Trade Commission, as a result of changing trade dynamics, U.S. chemical exports decreased to $229.2 billion, with domestic exports down 6.4% and re-exports up 4.3%, while imports increased 2.9% to $329 billion. Government-supported clean manufacturing initiatives, including those from the Department of Energy, are promoting automation in the production of additives. The rising exports of U.S. food-grade chemicals and a significant increase in import activities in Southeast Asia highlight the momentum in the global market, which is further strengthened by enhanced research funding for clean-label and biocompatible chemical solutions.
Key Food & Beverage Chemicals Market Insights Summary:
Regional Insights:
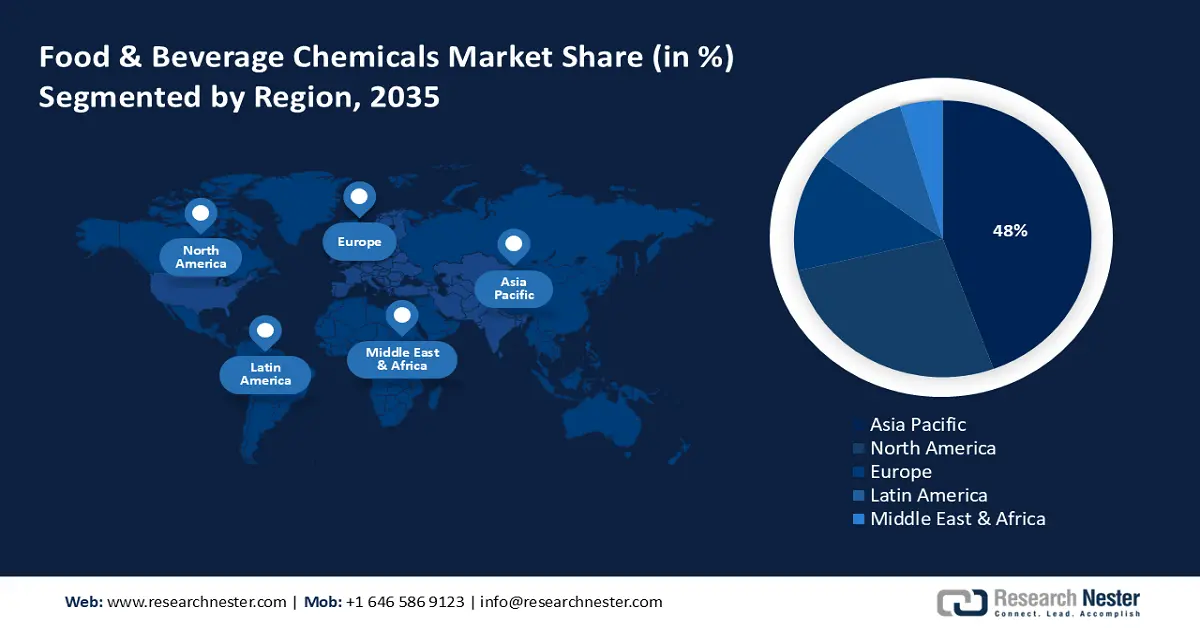
- By 2035, the Asia Pacific is expected to hold 48% share in the global Food and Beverage Chemicals Market, fueled by growing demand for processed foods, beverages, and functional products.
- North America is projected to secure a substantial share by 2035, impelled by rising adoption of clean-label ingredients, natural preservatives, and functional additives.
Segment Insights:
- Preservatives are projected to account for a 32.6% share by 2035, propelled by rising demand for shelf-stable and processed foods in the Food and Beverage Chemicals Market.
- Food enzymes are anticipated to hold a 26.9% share by 2035, owing to increasing adoption in baking, brewing, dairy, and juice applications.
Key Growth Trends:
- Surge in clean-label product demand
- Urbanization and changing lifestyles
Major Challenges:
- Stringent regulatory compliance
- Volatile raw material prices
Key Players: BASF SE,Cargill, Incorporated,DuPont de Nemours, Inc.,Kerry Group plc,Givaudan SA,Archer Daniels Midland Company (ADM),DSM-Firmenich,Tate & Lyle PLC,CJ CheilJedang Corp,Ingredion Incorporated,Danisco (IFF),Wilmar International Limited,Manildra Group,Jubilant Ingrevia Limited,Ajinomoto Co., Inc.
Global Food & Beverage Chemicals Market Forecast and Regional Outlook:
Market Size & Growth Projections:
- 2025 Market Size: USD 260.3 billion
- 2026 Market Size:USD 298.5 billion
- Projected Market Size: USD 480.8 billion
- Growth Forecasts: 6.7% CAGR (2026-2035)
Key Regional Dynamics:
- Largest Region: Asia Pacific (48% Share by 2035)
- Fastest Growing Region: North America
- Dominating Countries: United States, Germany, Japan, China, France
- Emerging Countries: India, Brazil, South Korea, Mexico, Indonesia
Last updated on : 6 October, 2025
Food and Beverage Chemicals Market - Growth Drivers and Challenges
Growth Drivers
- Surge in clean-label product demand: The increasing consumer demand for transparency and health-oriented options has driven a notable rise in the popularity of clean-label food and beverage products. Data from the NIH indicates that 46% of Americans prefer simply stated ingredients, influencing purchases and willingness to pay more for clean-label food products, which has encouraged manufacturers to adopt simpler and more recognizable ingredients. This transition has resulted in a marked increase in the utilization of natural preservatives like rosemary extract and citric acid. Consequently, producers of food chemicals are amplifying their research and development initiatives to create and market natural chemical formulations in response to changing consumer expectations and regulatory demands for cleaner and more sustainable food additive solutions.
- Advances in catalytic and enzymatic technologies: Recent developments in catalytic and enzymatic technologies have greatly enhanced production processes in the food and beverage chemicals industry. These advancements lower energy usage and reduce waste generation, thereby promoting more sustainable manufacturing practices. Their influence is especially significant in the production of flavor enhancers and acidulants, where accuracy and yield are essential. By improving overall plant productivity and decreasing operational expenses, catalytic and enzyme-driven processes are becoming crucial elements of contemporary chemical production strategies.
- Urbanization and changing lifestyles: The growing trend of rapid urbanization, primarily in the emerging markets, has increased the demand for processed, packaged, and convenience foods. Busy lifestyles are driving consumers to more ready-to-eat meals and snacks, and beverages, which is leading to a higher application of preservatives, stabilizers, and flavor enhancers. Chemicals that extend shelf life and/or are added for food safety factors during distribution are even more relevant. As consumers continue to shift their consumption habits, significant growth opportunities will continue to arise for suppliers of food and beverage chemicals that cater to the convenience segment, particularly in the Asia-Pacific and Latin America.
Challenges
- Stringent regulatory compliance: The food and beverage chemicals industry is under constant pressure to comply with ever-strict safety and labelling regulations enforced by the FDA, EFSA, USDA, and other regulatory bodies. Manufacturers' compliance costs rise as limits on additives are frequently revised, and limits on residues and clean-label thresholds are also regularly updated. Variances in regulatory parameters across regions can actively hinder entry into markets, as companies must invest in testing, documentation, and reformulation standards to comply with both domestic safety standards and the specific conditions required by international safety regulations.
- Volatile raw material prices: Food-grade chemicals are produced using basic materials such as starches, sugars, and oils, which are mainly shaped by agricultural production and world trade quality. The costs of these ingredients are very sensitive to the production cost, depending on climate change issues, geopolitical conflict, and export bans. This increased volatility creates cost pressures associated with raw material procurement, which reduces profit margin pressure on food companies that are required to keep input costs down while attempting to minimize inflation in consumer prices, thus resulting in supply chain instability financially.
Food and Beverage Chemicals Market Size and Forecast:
| Report Attribute | Details |
|---|---|
|
Base Year |
2025 |
|
Forecast Year |
2026-2035 |
|
CAGR |
6.7% |
|
Base Year Market Size (2025) |
USD 260.3 billion |
|
Forecast Year Market Size (2035) |
USD 480.8 billion |
|
Regional Scope |
|
Food & Beverage Chemicals Market Segmentation:
Food Additives Segment Analysis
The preservatives segment is projected to dominate the global food and beverage chemicals market with a 32.6% share by 2035, driven by rising demand for shelf-stable and processed foods. Increasing urbanization and fast-paced lifestyles have significantly enhanced the consumption of ready-to-eat and long-life products, as reported by the U.S. Department of Agriculture. In 2022, Japan’s retail food and beverage sales totaled $327 billion, with supermarkets at 74% and convenience stores 15%. In 2023, the food processing industry’s output fell 4.1% to $182 billion from $190 billion in 2022. Furthermore, stringent food safety regulations and the growing preference for clean-label products are accelerating the adoption of GRAS (Generally Recognized as Safe) certified synthetic preservatives. These factors collectively underscore the critical role of preservatives in ensuring food quality, safety, and extended shelf life across global markets.
Processing Aids & Enzymes Segment Analysis
Food enzymes are anticipated to witness substantial growth across the food and beverage chemicals market by holding a 26.9% share by 2035, particularly in baking, brewing, dairy, and juice applications. These enzymes play a crucial role in improving product texture, flavor, and processing efficiency. As highlighted by NIH, advancements in biotechnology have led to highly specific and efficient enzymes tailored for various food processes. Moreover, the rising global demand for gluten-free and lactose-free food products is further propelling enzyme adoption. For instance, in May 2024, Jars by Dani introduced "Bites," a gluten-free dessert sampler with 14 taster-sized portions of their classic jar desserts. The sampler has four varieties, one that says "Chocoholic Gluten Free," which caters to the gluten-free consumer, and it has flavors like salted caramel and rainbow fudge. With increased focus on health-conscious consumption and cleaner production methods, food enzymes are positioned as essential components in modern, high-performance food processing solutions.
Emulsifiers & Stabilizers Segment Analysis
The lecithin segment is projected to dominate the global food and beverage chemicals market with a significant share by 2035, mainly driven by its multifunctional properties as a natural emulsifier, stabilizer, and dispersing agent. Derived primarily from soy or sunflower, lecithin improves food texture, offers enhanced shelf-life stability, and promotes the mixing of immiscible food ingredients. Phosphatidylcholine (PC) is the most prevalent constituent of lecithin, with a value of ~73.0%. The amount of lecithin present in egg yolk is three times greater than that found in soybean lecithin. Research has indicated that the content of lecithin in egg yolk and duck egg yolk is quite high, approximately ~10% of total lecithin content. Lecithin’s clean-label approach, generally recognized as safe (GRAS), and growing demand in the bakery/confectionery, dairy, and beverage segments add to lecithin’s established market leadership.
Our in-depth analysis of the food and beverage chemicals market includes the following segments
|
Segment |
Subsegments |
|
Food Additives |
|
|
Processing Aids & Enzymes |
|
|
Flavouring Agents |
|
|
Color Additives |
|
|
Emulsifiers & Stabilizers |
|

Vishnu Nair
Head - Global Business DevelopmentCustomize this report to your requirements — connect with our consultant for personalized insights and options.
Food and Beverage Chemicals Market - Regional Analysis
Asia Pacific Market Insights
By 2035, the food and beverage chemicals market in the Asia Pacific is expected to hold 48% of the share in the global market, highly driven by growing demand for processed foods, beverages, and functional products. Increasing levels of urbanization, shifts in consumption patterns, and demand for new and innovative ingredients are all contributing to market growth in the region, specifically for preservatives, flavor enhancers, and stabilizers. Both multinational companies and regional manufacturers are focusing their product innovation efforts on sustainability sourcing and offering clean-label products. Additionally, government backing related to safety and modernization of the food and beverage manufacturing process is also leading to market expansion around the region.
Emerging Trade Dynamics of Lecithin and Other Phosphoaminolipids in the Asia Pacific in 2023
|
Country |
Export Value (USD) |
Quantity (Kg) |
|
India |
209,543,510 |
52,465,800 |
|
China |
102,954,500 |
65,191,700 |
|
Japan |
17,085,920 |
228,239 |
|
Korea, Rep. |
12,454,940 |
296,072 |
|
Malaysia |
6,905,780 |
4,253,930 |
|
Singapore |
4,675,310 |
1,280,670 |
|
Other Asia, nes |
7,338,640 |
7,402,110 |
Source: WITS
The market for food and beverage chemicals in China is shaped by rising urbanization, large manufacturing capability, and changing consumer demands. Additives, stabilizers, and emulsifiers are in demand as packaged and functional foods become more popular. Companies are focusing on clean-label, plant-based, and natural formulations to match consumer interest in health. Safety and quality are achieved through regulation, which enables both domestic producers and international companies to increase investments and partnerships in the food processing and beverage sectors in China.
India's food and beverage chemicals market is driven by the growth of the middle-class population, rising disposable income, and the increase in packaged food consumption. There is an increasing demand for flavoring agents, preservatives, and emulsifiers, which leads to enhancements in the market. The World Food India 2025 event concluded with over 95,000 participants, underscoring India's growing prominence in global agri-food value chains. The summit facilitated the signing of Memorandums of Understanding worth more than ₹1,02,000 crore, marking one of the largest-ever investment commitments in India's food processing sector. Additionally, 26,000 beneficiaries received credit-linked subsidies totaling ₹2,518 crore under the PMFME scheme, reflecting the government's commitment to empowering grassroots entrepreneurs. The growing consumer interest in healthier products is leading to healthy, natural, and clean-label food ingredients. Based on government initiatives in food processing, in tandem with private sector investments, there is innovation and modernization that creates an opportunity for both domestic and international firms in India's evolving market.
North America Market Insights
By 2035, the food and beverage chemicals market in North America, predominantly influenced by the rising demand for clean-label ingredients, natural preservatives, and functional additives. The producers in North America are prioritizing clean-label ingredients, natural additives, and sustainable formulations. Strong supply chain structures, along with collaboration between industry participants and research institutes, sustain advancement in the market. The market is characterized by changing dietary preferences, health trends, and advancements towards functional food and beverage applications.
The U.S. additives and ingredient chemicals market for food and beverages benefits from emerging consumer demand for natural preservatives, flavor enhancers, emulsifiers, and functional ingredients that match clean-label demand. There is an emphasis from companies on research and development to meet shifting dietary expectations from consumers while being accountable under strict federal regulations. The FDA identified its maximum use levels for Propylene glycol alginate in jams and jellies as 0.4%, frozen dairy desserts, fruit and water ices, confections, and frostings as 0.5%, baked goods as 0.5%, gravies and sweet sauces as 0.5%, gelatins and puddings as 0.6%, condiments as 0.6%, cheese as 0.9%, fats and oils as 1.1%, and seasonings and flavors as 1.7%. Nearly every food processing industry is diverse, and the sheer number of potential customers in the U.S. market, coupled with the rapid adoption of sustainable solutions, places the U.S. at the forefront of additive chemical innovation in food and beverage markets.
The market for food and beverage chemicals in Canada demonstrates a growing consumer preference for natural ingredients, sustainable additives to foods and beverages, and formulations that maximize safety and shelf life. The EFSA reassessed lecithin as a food additive for use in foods for infants under 16 weeks of age and follow-on and in foods for all population groups. Considering the dietary exposure to the food additive for infants under 16 weeks of age, it established the maximum use levels of lecithins at 260 mg/kg/day. The industry growth is supported by partnerships among government, academia, and private firms leading to advances in specialty chemicals. The demand is further impacted by consumers´ improved lifestyle and health awareness, and the increase in food processing capabilities.
Europe Market Insights
By 2035, the food and beverage chemicals market in the Europe region is expected to hold a significant market share, driven by strict safety regulations, sustainability goals, and continued innovation in clean-label products. The industry's response is heavily driven by increasing demand for natural additives, functional ingredients and preservatives. Regulatory bodies such as EFSA and REACH play an important role in facilitating compliance with these regulatory measures, while industry players are navigating the challenges created by shifting consumer preferences. Drivers of growth include products marketed on health benefits, plant-based products, and sustainability initiatives funded and backed by the government in line with European Green Deal goals.
In Germany, the market for chemicals in food and beverages shows strong demand for natural flavorings, sweeteners and texturizers based on the health-conscious consumer culture of the country. Germany is characterized by a strong safety profile and full compliance with EU legislation, as well as ongoing sustainability and organic development initiatives, responsive sourcing of eco-friendly materials and the development of new products using natural and organic ingredients, including non-GMO source materials. In Germany, sunflower-based lecithin is gaining traction as a natural, allergen-free alternative to soy lecithin, driven by clean-label trends, sustainable sourcing, and rising demand for plant-based food solutions.
Germany Sunflower Seed Production in 2021
|
Region |
Production % |
|
Brandenburg |
54% |
|
Sachsen-Anhalt |
11% |
|
Sachsen |
9% |
|
Bayern |
9% |
|
Baden-Württemberg |
5% |
|
Thüringen |
5% |
Source: USDA
The UK food & beverage chemicals market is influenced by post-Brexit regulatory landscapes, increasing trends towards clean-label products, and heightened consumer desire for ingredient transparency. There tends to be more emphasis on eliminating artificial additives and improving preservatives and functional ingredients of natural origin. Industry participants are investing support in innovations on plant-based and novel low-calorie and alternative sweeteners as consumer interest in dietary changes heightens and opportunities advance to support health initiatives from the government. Domestic companies are increasingly partnering with global suppliers as they evolve to meet changing health and sustainability targets.
Key Food and Beverage Chemicals Market Players:
- BASF SE
- Company Overview
- Business Strategy
- Key Product Offerings
- Financial Performance
- Key Performance Indicators
- Risk Analysis
- Recent Development
- Regional Presence
- SWOT Analysis
- Cargill, Incorporated
- DuPont de Nemours, Inc.
- Kerry Group plc
- Givaudan SA
- Archer Daniels Midland Company (ADM)
- DSM-Firmenich
- Tate & Lyle PLC
- CJ CheilJedang Corp
- Ingredion Incorporated
- Danisco (IFF)
- Wilmar International Limited
- Manildra Group
- Jubilant Ingrevia Limited
- Ajinomoto Co., Inc.
The international market for food and beverage chemicals is intensely competitive, dominated by multinationals that prioritize innovation. Companies in the United States, such as Cargill and ADM, focus on bio-based solutions, while European firms like BASF and Kerry are investing in clean-label technologies. Asian enterprises, including Ajinomoto and Jubilant Ingrevia, are growing through innovations tailored to their regions. Essential strategies encompass sustainability, traceability, and advancements in fermentation. As consumer demand increasingly favors natural and environmentally friendly additives, leading companies are adjusting their product offerings to align with changing consumer preferences and regulatory requirements in global markets.
Some of the key players operating in the market are listed below:
Recent Developments
- In June 2024, BASF SE launched ecoflex F Blend C1200 BMB, a biodegradable plastic made from renewable materials. This product is tailored for sustainable packaging, addressing the increasing demand for compostable materials and enhancing BASF's standing in the biodegradable plastics sector, in line with global sustainability and circular economy objectives.
- In May 2024, Origin Materials launched the inaugural 100% PET cap specifically engineered for carbonated soft drinks, compatible with the PCO 1881 neck finish. This innovation improves recycling efficiency and decreases packaging weight, thereby aiding sustainability objectives within the beverage industry and promoting circular economy efforts in plastic packaging solutions.
- Report ID: 1018
- Published Date: Oct 06, 2025
- Report Format: PDF, PPT
- Explore a preview of key market trends and insights
- Review sample data tables and segment breakdowns
- Experience the quality of our visual data representations
- Evaluate our report structure and research methodology
- Get a glimpse of competitive landscape analysis
- Understand how regional forecasts are presented
- Assess the depth of company profiling and benchmarking
- Preview how actionable insights can support your strategy
Explore real data and analysis
Frequently Asked Questions (FAQ)
About this Report
Connect with our Expert


Copyright @ 2026 Research Nester. All Rights Reserved.
