Ferrochrome Market Outlook:
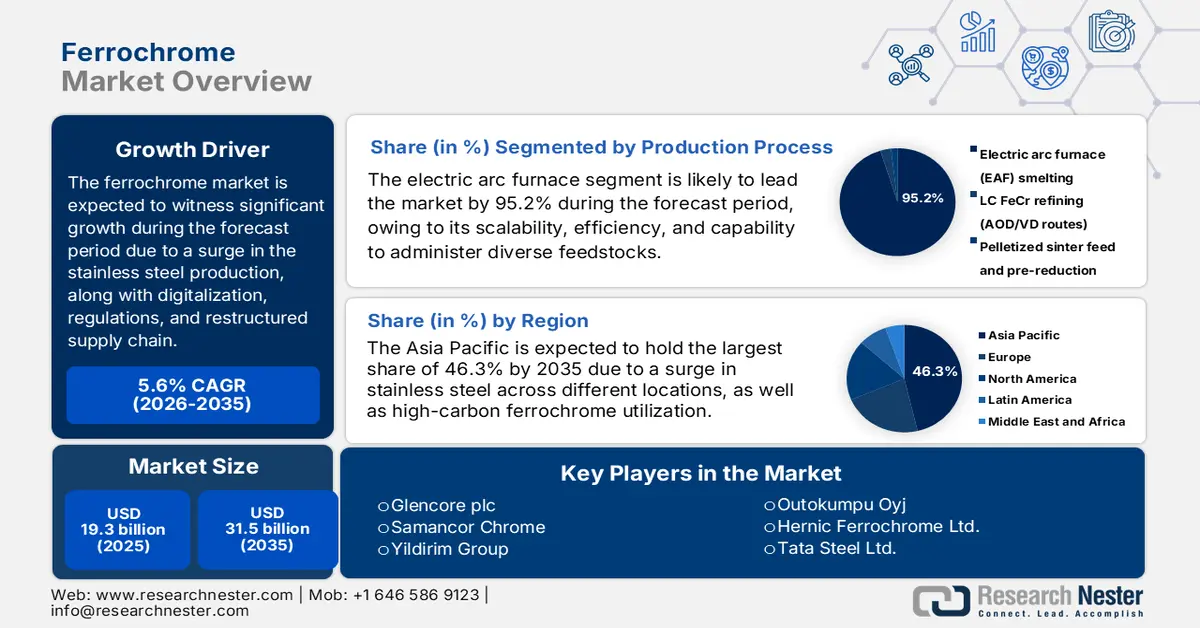
Ferrochrome Market size was over USD 19.3 billion in 2025 and is estimated to reach USD 31.5 billion by the end of 2035, expanding at a CAGR of 5.6% during the forecast timeline, i.e., 2026-2035. In 2026, the industry size of ferrochrome is estimated at USD 20.3 billion.
The international market is significantly entering a transformative phase, with a continuous surge in demand across different nations. Stainless steel is considered the dominant application, but with the emergence of latest forces, including supply chain restructuring, digitalization, and environmental regulations, the market is gradually reshaping. According to a data report published by the OECD Organization in 2025, almost 2 billion tons of steel are produced globally every year, and an estimated 75% of 3,500 steel grades have been developed over the past 20 years. Besides, as stated in an article published by the World Steel Organization in April 2025, there has been an increase in the stainless steel melt shop production by 7% as of 2024, accounting for an overall 62.6 million metric tons, thereby denoting an optimistic outlook for the market.
Regional Stainless Steel Melt Shop Production (2023-2024)
|
Regions |
2023 (metric tons) |
2024 (metric tons) |
% Change |
|
Europe |
5,997 |
6,088 |
1.5 |
|
U.S. |
1,824 |
1,950 |
6.9 |
|
China |
36,676 |
39,441 |
7.5 |
|
Asia, excluding South Korea and China |
6,880 |
7,322 |
6.4 |
|
Others |
7,163 |
7,820 |
9.2% |
|
Total |
58,539 |
62,621 |
7.0% |
Source: World Stainless Steel Organization
Furthermore, the aspects of ESG compliance and sustainability, digital transformation, trade realignment, vertical integration, and product diversification are other factors that are driving the market globally. As stated in a data report published by the OECD in May 2025, there has been a substantial increase in the steelmaking capacity by almost 6.7%, which is 165 million metric tons. In addition, Asia-based economies are projected to cater to 58% of the newest capacity, which is driven by an upsurge in India and China. Besides, the aspect of cross-border investment is readily involved, which is nearly 16% of the overall tonnage. Moreover, by the end of 2030, the international stainless steel demand is expected to grow by 0.7% every year. Besides, in terms of trade facilities, the ongoing wire of stainless steel is also responsible for uplifting the market internationally.
2023 Wires of Stainless Steel Export and Import
|
Countries/Components |
Export (USD) |
Import (USD) |
|
India |
416 million |
- |
|
China |
321 million |
164 million |
|
South Korea |
246 million |
- |
|
Germany |
- |
283 million |
|
U.S. |
- |
244 million |
|
Global Trade Valuation |
2.5 billion |
|
|
Global Trade Share |
0.011% |
|
|
Product Complexity |
1.3 |
|
Source: OEC
Key Ferrochrome Market Insights Summary:
Regional Highlights:
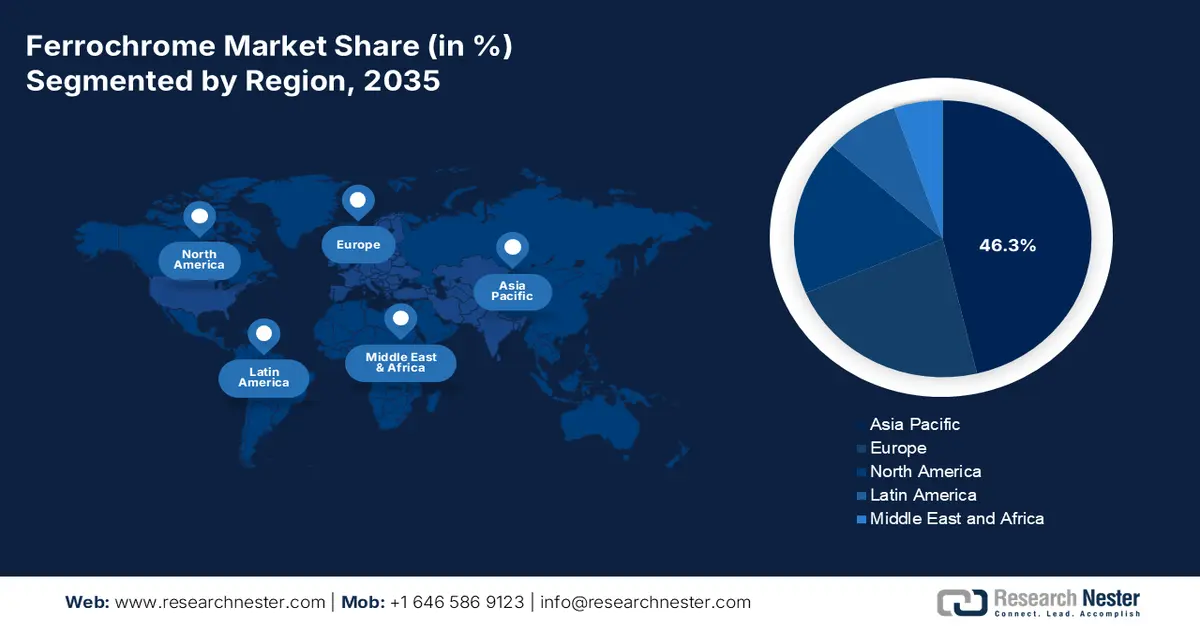
- Asia Pacific in the ferrochrome market is expected to secure the leading position with a 46.3% share by 2035, supported by expanding stainless-steel manufacturing capacities and rising high-carbon ferrochrome consumption across integrated supply chains.
- North America is projected to register the fastest growth over the 2026–2035 period, stimulated by escalating stainless-steel demand from automotive, chemical processing, and industrial machinery sectors.
Segment Insights:
- The electric arc furnace segment in the ferrochrome market is forecast to dominate with a substantial 95.2% share by 2035, strengthened by its operational efficiency, scalability, and flexibility in processing diverse feedstocks.
- The high-carbon ferrochrome segment is anticipated to hold the second-highest share during 2026–2035, propelled by its essential contribution to enhancing strength, durability, and corrosion resistance in alloy and stainless steels.
Key Growth Trends:
- Increase in urbanization
- Technological advancements in smelting
Major Challenges:
- Increased price volatility for raw material
- Environmental regulations and sustainability pressures
Key Players: Glencore plc, Samancor Chrome, Yildirim Group, Outokumpu Oyj, Hernic Ferrochrome Ltd., Tata Steel Ltd., IMFA – Indian Metals & Ferro Alloys Ltd., Jindal Stainless Ltd., Balasore Alloys Ltd., Nippon Steel Corporation, Pohang Iron and Steel Company – POSCO, Yunnan Wenshan Electric Ferroalloy Co. Ltd., Shanxi Jiang County Minmetal Ferroalloy Co. Ltd., Eurasian Resources Group, Merafe Resources Ltd., Assmang Ltd., Kazchrome JSC, Afarak Group, Al Tamman Indsil Ferrochrome LLC, Consolidated Minerals Ltd.
Global Ferrochrome Market Forecast and Regional Outlook:
Market Size & Growth Projections:
- 2025 Market Size: USD 37.1 billion
- 2026 Market Size: USD 44.7 billion
- Projected Market Size: USD 166.4 billion by 2035
- Growth Forecasts: 11.5% CAGR (2026-2035)
Key Regional Dynamics:
- Largest Region: Asia Pacific (46.3% Share by 2035)
- Fastest Growing Region: North America
- Dominating Countries: China, India, South Africa, Kazakhstan, Japan
- Emerging Countries: Indonesia, Vietnam, Brazil, Turkey, Mexico
Last updated on : 2 January, 2026
Ferrochrome Market - Growth Drivers and Challenges
Growth Drivers
- Increase in urbanization: The aspect of large-scale transportation and construction investments, especially in China and India, is deliberately fueling chromium-based steel demand, thus uplifting the ferrochrome market globally. According to an article published by Our World in Data Organization in 2024, over 4 billion people reside in urban locations. Besides, across high-income regions, such as the Middle East, Japan, Australia, America, and West Europe, more than 80% of the population lives in urban areas. Additionally, in upper-middle-income nations, including South America, North and South Africa, East Asia, and East Europe, between 50% to 80% of people reside. Moreover, internationally, more people reside in urbanized settings, which is more than 50% of the urban mark, thus suitable for bolstering the market’s growth.
- Technological advancements in smelting: The adoption of electric arc and plasma furnaces optimizes efficiency and lowers emissions, thereby driving the competitiveness of the market. As per an article published by Materials Today Sustainability in March 2025, the construction sector accounts for 6% to 7% of the worldwide carbon dioxide and energy resources. Besides, the annual international output of slag ranges between 340 million tons to 410 million tons. Additionally, an estimated 103 million tons of electric arc furnace slag have been produced yearly during steel production. Moreover, the infrastructure and building industry globally has consumed more than 50% of the steel, which has surpassed other industries. Based on this, the durability and strength of steel, thus fueling the market’s demand.
- Government funding for chemicals: The presence of national strategies in India, Germany, and Japan readily supports sustainable chemical processes, which are indirectly bolstering the stainless equipment demand in the ferrochrome market. As stated in an article published by the UNEP in September 2025, the Global Framework on Chemicals Fund readily supports USD 300,000 to USD 800,000 for projects, with an implementation period of almost 3 years. Besides, as per an article published by UNESCO in March 2025, research grants, such as PhosAgro and IUPAC has offered almost USD 30,000 in green chemistry programme to scientists. The purpose is to ensure advanced research projects, which positively impact the market’s expansion.
Challenges
- Increased price volatility for raw material: The market is highly dependent on chrome ore, primarily sourced from South Africa, Kazakhstan, and India. Price volatility in chrome ore directly impacts ferrochrome production costs, creating uncertainty for manufacturers and stainless steel producers. Supply disruptions that are caused by mining strikes, energy shortages, or geopolitical instability can lead to sharp price spikes, reducing profitability and destabilizing long-term contracts. For instance, South Africa’s electricity crisis has repeatedly disrupted smelting operations, raising costs and limiting output. Additionally, global shipping bottlenecks and tariffs amplify volatility, making it difficult for producers to forecast demand and secure stable margins, thereby causing a hindrance in the market’s growth.
- Environmental regulations and sustainability pressures: The ferrochrome production is energy-intensive and generates significant emissions, including carbon dioxide and hexavalent chromium, a hazardous pollutant. Governments worldwide, particularly in Europe, are tightening environmental regulations under frameworks, such as the regional Green Deal, mandating cleaner production methods and stricter waste disposal standards. Compliance requires costly investments in advanced smelting technologies, emission control systems, and sustainable energy sources. Smaller producers often struggle to meet these requirements, leading to consolidation and reduced competition. For instance, Europe-based producers have invested heavily in low-carbon ferrochrome, but rising costs limit their global competitiveness against APAC suppliers.
Ferrochrome Market Size and Forecast:
| Report Attribute | Details |
|---|---|
|
Base Year |
2025 |
|
Forecast Year |
2026-2035 |
|
CAGR |
5.6% |
|
Base Year Market Size (2025) |
USD 19.3 billion |
|
Forecast Year Market Size (2035) |
USD 31.5 billion |
|
Regional Scope |
|
Ferrochrome Market Segmentation:
Production Process Segment Analysis
The electric arc furnace segment, which is part of the production process, is anticipated to garner the largest market share of 95.2% by the end of 2035. The segment’s upliftment is highly attributed to this particular method highly favored due to its efficiency, scalability, and ability to handle diverse feedstocks, including chrome ore fines and recycled materials. EAF technology uses high-voltage electric arcs to melt ore and reductants, producing ferrochrome with controlled carbon content. Its flexibility allows producers to manufacture high-carbon, low-carbon, and charge chrome grades, making it the backbone of the industry. The process is particularly advantageous in regions with abundant electricity and chrome ore reserves, such as South Africa, Kazakhstan, and India. Moreover, EAF furnaces are increasingly integrated with pre-reduction and pelletizing technologies, improving energy efficiency and lowering emissions.
Product Type Segment Analysis
Based on the product type, the high-carbon ferrochrome sub-segment in the ferrochrome market is expected to account for the second-highest share during the forecast timeline. The sub-segment’s growth is highly propelled by its importance for making corrosion-resistant, durable, and strong steels, particularly alloy and stainless steels, by adding chromium to optimize high-temperature, wear resistance, and hardness. According to a data report published by the Environment Clearance in 2022, steel usually comprises almost 1% and preferably 3% to 4.5% of chromium, along with stainless steel comprising 12% to 20% of chromium. Besides, high-carbon ferrochrome has a chromium content of almost 8%. In this regard, the chromium ore output has increased by 24.8% to 34.8 million tons, and South Africa is considered the largest producer, with 21.0 million tons, thereby denoting a huge growth opportunity for the sub-segment.
Application Segment Analysis
By the end of the stipulated timeline, the stainless steel sub-segment, within the application, is projected to hold the third-largest share in the market. The sub-segment’s development is highly bolstered by its provision of the essential chromium units that impart corrosion resistance, strength, and durability to stainless steel, making it indispensable across industries. The sub-segment’s demand is driven by construction, automotive, aerospace, consumer goods, and chemical processing equipment, where stainless steel’s performance advantages are critical. Asia-Pacific, particularly China and India, leads consumption due to rapid urbanization, infrastructure expansion, and industrial growth. Europe and North America contribute steady demand, with emphasis on high-grade stainless for aerospace, medical, and chemical sectors. Stainless steel’s recyclability also supports circular economy initiatives, reinforcing long-term demand, thus fueling the sub-segment’s growth.
Our in-depth analysis of the ferrochrome market includes the following segments:
|
Segment |
Subsegments |
|
Production Process |
|
|
Product Type |
|
|
Application |
|
|
Carbon Content |
|
|
Grade/Form |
|
|
Sales Channel |
|

Vishnu Nair
Head - Global Business DevelopmentCustomize this report to your requirements — connect with our consultant for personalized insights and options.
Ferrochrome Market - Regional Analysis
APAC Market Insights
The Asia Pacific market is anticipated to garner the highest share of 46.3% by the end of 2035. The market’s upliftment in the region is boosted by an increase in the stainless-steel capacity in South Korea, Japan, India, and China, along with a surge in the high-carbon ferrochrome utilization across integrated merchant and mills supply chains. According to an article published by the ILO Organization in September 2025, the supply chain aspect in the region accounts for 41% of the international merchandise trade valuation and supports almost 75 million workers, particularly in Southeast Asia, built in large-scale corporations, along with micro and small and medium-sized enterprises. These small economic units make up nearly 97% of overall enterprises and readily employ 70% of the region’s labor force, thereby making it suitable for bolstering the market’s growth.
China’s ferrochrome market is growing significantly, owing to a surge in the stainless steel production, dominance of high-carbon ferrochrome, as well as the sustained industrial investment. As per an article published by the AISU Steel Organization in January 2024, the stainless steel production in the country readily increased by 12.6% as of 2023 in comparison to 2022, reaching 36 million tons. Besides, the stainless steel export in the country has been estimated to account for 4.1 million tons as of 2023, in comparison to 4.5 million tons in 2022. Meanwhile, imports reached 2.0 million tons from 3.2 million tons within the same timeline. Moreover, the yearly production capacity has reached 50 million tons, along with the capacity utilization rate catering to 70%. Additionally, in 2024, it was about 13 million tons of energy that has been put into operation, thus boosting the market’s growth.
India’s market is also growing due to industrial modernization, infrastructure, and growth in the chemical industry. Besides, the government ensures standard documents to provide evidence for the continuous policy support and funding for petrochemicals and chemicals. As stated in an article published by Invest India in March 2025, the domestic chemical sector has been estimated to be worth USD 220 billion as of 2024, and is expected to reach USD 300 billion by the end of 2028. Additionally, the upcoming chemical manufacturing center has predicted that the country’s chemical sector is poised to witness growth by 11% to 12%, along with 7% to 10% by the end of 2040, denoting an increase by three times. Besides, 70% of the domestic chemical production is consumed regionally, and the country is expected to account for 205 of incremental international consumption of chemicals for more than the upcoming two decades, thus suitable for uplifting the market.
North America Market Insights
North America in the ferrochrome market is expected to emerge as the fastest-growing region during the forecast period. The market’s development in the region is highly driven by an increase in stainless-steel demand in the automotive, chemical processing, and machinery sectors. In addition, the region has strict safety and environmental frameworks that shape choices throughout the chemical value chain. Besides, according to an article published by the U.S. Department of Energy (DOE) in March 2024, the chemical sector in the U.S. supports over 25% of the gross domestic product (GDP). It is also heavily dependent on fossil resources both as energy and feedstock, and is responsible for 513 million metric tons of energy-based carbon dioxide emissions. Moreover, the industry presently converts raw materials into more than 70,000 different products, thus proliferating the market’s upliftment.
The U.S. in the ferrochrome market is gaining increased traction, owing to the demand linkage, federal budget context, the presence of governmental programs, along with advanced materials and manufacturing. Besides, as per the March 2022 EPA Government data report, the 2023 President’s Budget amounted to USD 11.8 billion with 16,204.1 FTE for making advancements to protect human and environmental health. Besides, the EPM, as well as the S&T, has demonstrated USD 11.9 million as of 2022, along with USD 23.7 million in 2023, thereby suitable for supporting programs to ensure chemical sustainability and safety. This also signals sustained public funding for environmental oversight of chemicals within the country. Moreover, the annual EPA budget provision frequently favors stainless steel for durability and compliance for sustaining the ferrochrome demand, particularly in regulated chemical operations.
Yearly EPA’s Budget Analysis in the U.S. (2014-2023)
|
Year |
Budget Amount (USD Billion) |
|
2014 |
8.2 |
|
2015 |
8.1 |
|
2016 |
8.1 |
|
2017 |
8.3 |
|
2018 |
8.8 |
|
2019 |
8.8 |
|
2020 |
9.0 |
|
2021 |
9.2 |
|
2022 |
9.2 |
|
2023 |
11.9 |
Source: EPA Government
Canada in the ferrochrome market is also developing due to industrial demand, government support for chemicals, regulation and sustainability, along with market and trade competitiveness. As stated in an article published by CIAC in November 2025, USD 2 billion has been allocated as a critical minerals fund for more than 5 years to successfully establish a Critical Minerals Sovereign Fund for supporting tactical investments across the country’s clean economy value chain. Besides, as stated in a data report published by the Clean Energy Canada in March 2023, the country’s chemical and fertilizer industry effectively employs more than 88,800 workers and produces 21 million tons of greenhouse gas emissions, thereby making it the highest emitter of the robust industries. Additionally, the sector has generated USD 4.7 trillion in international yearly revenues, thus denoting an optimistic outlook for the market’s growth.
Europe Market Insights
Europe in the ferrochrome market is projected to experience considerable growth by the end of the stipulated timeline. The market’s growth in the region is highly uplifted due to chemical processing equipment, along with the stainless-steel demand in construction, automotive, and machinery. In addition, tightened regional regulatory frameworks on industrial and chemical emissions steer buyers towards traceable, lower-emission, and quality smelting routes are also fueling the market’s exposure. According to an article published by the Europe Environment Agency in March 2023, the chemical sales in the region amounted to EUR 499 billion, with the production hitting 271 million tons, and meanwhile, the consumption aspect stood at 289 million tons. Moreover, in the case of chemical diversity, there have been more than 26,600 chemical registrations in the region under the domestic REACH legislation.
The ferrochrome market in Germany is gaining increased exposure, owing to the presence of the massive industrial base in chemicals, engineered, automotive, and machinery equipment that depends on corrosion-based stainless steel. As per an article published by the British Stainless Steel Association in 2025, the steel consumption in the overall region grew to 148.1 million tons. In addition, the steel consumption in the country rose by 3.2% as of 2024, accounting for 28.9 million tons, as well as denoting a rise by 10% in 2025 with 31.8 million tons. Besides, Thyssenkrupp, the domestic steelmaker, has declared plans to lower the production capacity at its very own Duisburg location from 11 million tons to between 9 to 9.5 million tons, ensuring a suitable balance in the production process, therefore denoting an optimistic outlook for the market’s growth.
The ferrochrome market in Poland is also growing due to the existence of regional sustainability and safety standards, industrial expansion, structural funding opportunities, and modernization of manufacturing and chemical bases. As per the January 2024 ITA article, the country is an emerging innovator by grabbing 62.8% of the regional average, based on which the overall performance is increasing at an increasing rate on a whole. Besides, the country spends 1.3% of its GDP on research and development. Meanwhile, 66% of domestic organizations have successfully implemented at least one innovative digitalized technology for the overall manufacturing process. Besides, as of June 2023, Intel Corporation has initiated the largest foreign direct investment, amounting to a USD 5 billion Semiconductor Integration and Testing Plant in Miękinia, thereby proliferating the market’s growth.
Key Ferrochrome Market Players:
- Glencore plc (Switzerland)
- Company Overview
- Business Strategy
- Key Product Offerings
- Financial Performance
- Key Performance Indicators
- Risk Analysis
- Recent Development
- Regional Presence
- SWOT Analysis
- Samancor Chrome (South Africa)
- Yildirim Group (Turkey)
- Outokumpu Oyj (Finland)
- Hernic Ferrochrome Ltd. (South Africa)
- Tata Steel Ltd. (India)
- IMFA – Indian Metals & Ferro Alloys Ltd. (India)
- Jindal Stainless Ltd. (India)
- Balasore Alloys Ltd. (India)
- Nippon Steel Corporation (Japan)
- Pohang Iron and Steel Company – POSCO (South Korea)
- Yunnan Wenshan Electric Ferroalloy Co. Ltd. (China)
- Shanxi Jiang County Minmetal Ferroalloy Co. Ltd. (China)
- Eurasian Resources Group (Kazakhstan)
- Merafe Resources Ltd. (South Africa)
- Assmang Ltd. (South Africa)
- Kazchrome JSC (Kazakhstan)
- Afarak Group (UK)
- Al Tamman Indsil Ferrochrome LLC (Oman)
- Consolidated Minerals Ltd. (Australia)
- Glencore plc is one of the world’s largest and lowest-cost producers of ferrochrome, with integrated mining and smelting operations. In 2024, the company produced over 1,166 kilotons of ferrochrome, supplying stainless steel manufacturers globally. Its scale and cost efficiency give it a dominant position in the European and Asian stainless steel supply chains.
- Samancor Chrome is one of South Africa’s leading ferrochrome producers. The company operates extensive mining and smelting assets and has been central to stabilizing South Africa’s ferrochrome industry amid rising energy costsMining Indaba. Its partnership with Eskom in 2025 reflects strategic efforts to sustain competitiveness in global markets.
- Yildirim Group, through its subsidiary YILMADEN, is the world’s second-largest high-carbon ferrochrome producer. The company owns Eti Krom, Turkey’s only high-carbon ferrochrome producer, with reserves exceeding 130 million tons of chrome ore. Its international acquisitions, including Vargön Alloys in Sweden, have expanded its global footprint in ferroalloys.
- Outokumpu Oyj operates the Kemi chrome mine and Tornio ferrochrome smelter, making ferrochrome a core part of its stainless steel production. The company emphasizes clean and sustainable ferrochrome, positioning it as a competitive advantage in Europe. In 2024, Outokumpu temporarily reduced production due to weak demand, but maintains long-term integration with its stainless operations.
- Hernic Ferrochrome Ltd. is one of South Africa’s largest integrated ferrochrome producers, supplying charge chrome to global stainless steel markets. The company faced challenges from rising energy costs and competition from China-based fast markets. Despite cutbacks, Hernic remains a recognized name in the ferrochrome industry, reflecting South Africa’s legacy as a major supplier.
Here is a list of key players operating in the global market:
The international ferrochrome market is significantly consolidated, with APAC and Europe-based players dominating production and supply chains. Companies such as Glencore, Samancor, and Tata Steel leverage vertical integration and long-lasting ore contracts to secure raw material stability. Strategic initiatives include capacity expansions in India and China, sustainability programs in Europe aligned with the regional Green Deal, and digital transformation projects in South Korea and Japan to enhance smelting efficiency. Besides, in July 2025, TNC Kazchrome JSC, a subsidiary of Eurasian Resources Group, has successfully gained the latest production record by manufacturing almost 31.2 million tons of ferroalloys, and comprises a robust and highly diversified consumer base, including stainless steel producers in Europe, the U.S., Southeast Asia, Japan, and China, thus suitable for boosting the market globally.
Corporate Landscape of the Ferrochrome Market:
Recent Developments
- In December 2025, Eskom has successfully finalized the Memorandum of Understanding (MoU) with ferrochrome producers, namely Samancor Chrome, along with the Glencore–Merafe Chrome Venture, for developing the long-lasting and sustainable intervention for the overall ferrochrome industry.
- In December 2025, the Glencore Marafe Chrome Venture recently engaged with Eskom and other stakeholders, including Glencore Ferroalloys, and effectively signed Memorandum of Understanding (MOU) to expand engagement and collaboration for ensuring a workable energy solution for the ferrochrome sector.
- In December 2024, Outokumpu initiated an investment in the bio-carbon facility in Germany to significantly reduce its direct emissions, and replace fossil-based raw materials with economically viable alternatives.
- Report ID: 5045
- Published Date: Jan 02, 2026
- Report Format: PDF, PPT
- Explore a preview of key market trends and insights
- Review sample data tables and segment breakdowns
- Experience the quality of our visual data representations
- Evaluate our report structure and research methodology
- Get a glimpse of competitive landscape analysis
- Understand how regional forecasts are presented
- Assess the depth of company profiling and benchmarking
- Preview how actionable insights can support your strategy
Explore real data and analysis
Frequently Asked Questions (FAQ)
Ferrochrome Market Report Scope
Free Sample includes current and historical market size, growth trends, regional charts & tables, company profiles, segment-wise forecasts, and more.
Connect with our Expert


Copyright @ 2026 Research Nester. All Rights Reserved.
